 Arctic Biodiversity Data Service - ABDS Catalog
inlandWaters
Type of resources
Available actions
Topics
Keywords
Contact for the resource
Provided by
Representation types
Update frequencies
status
-
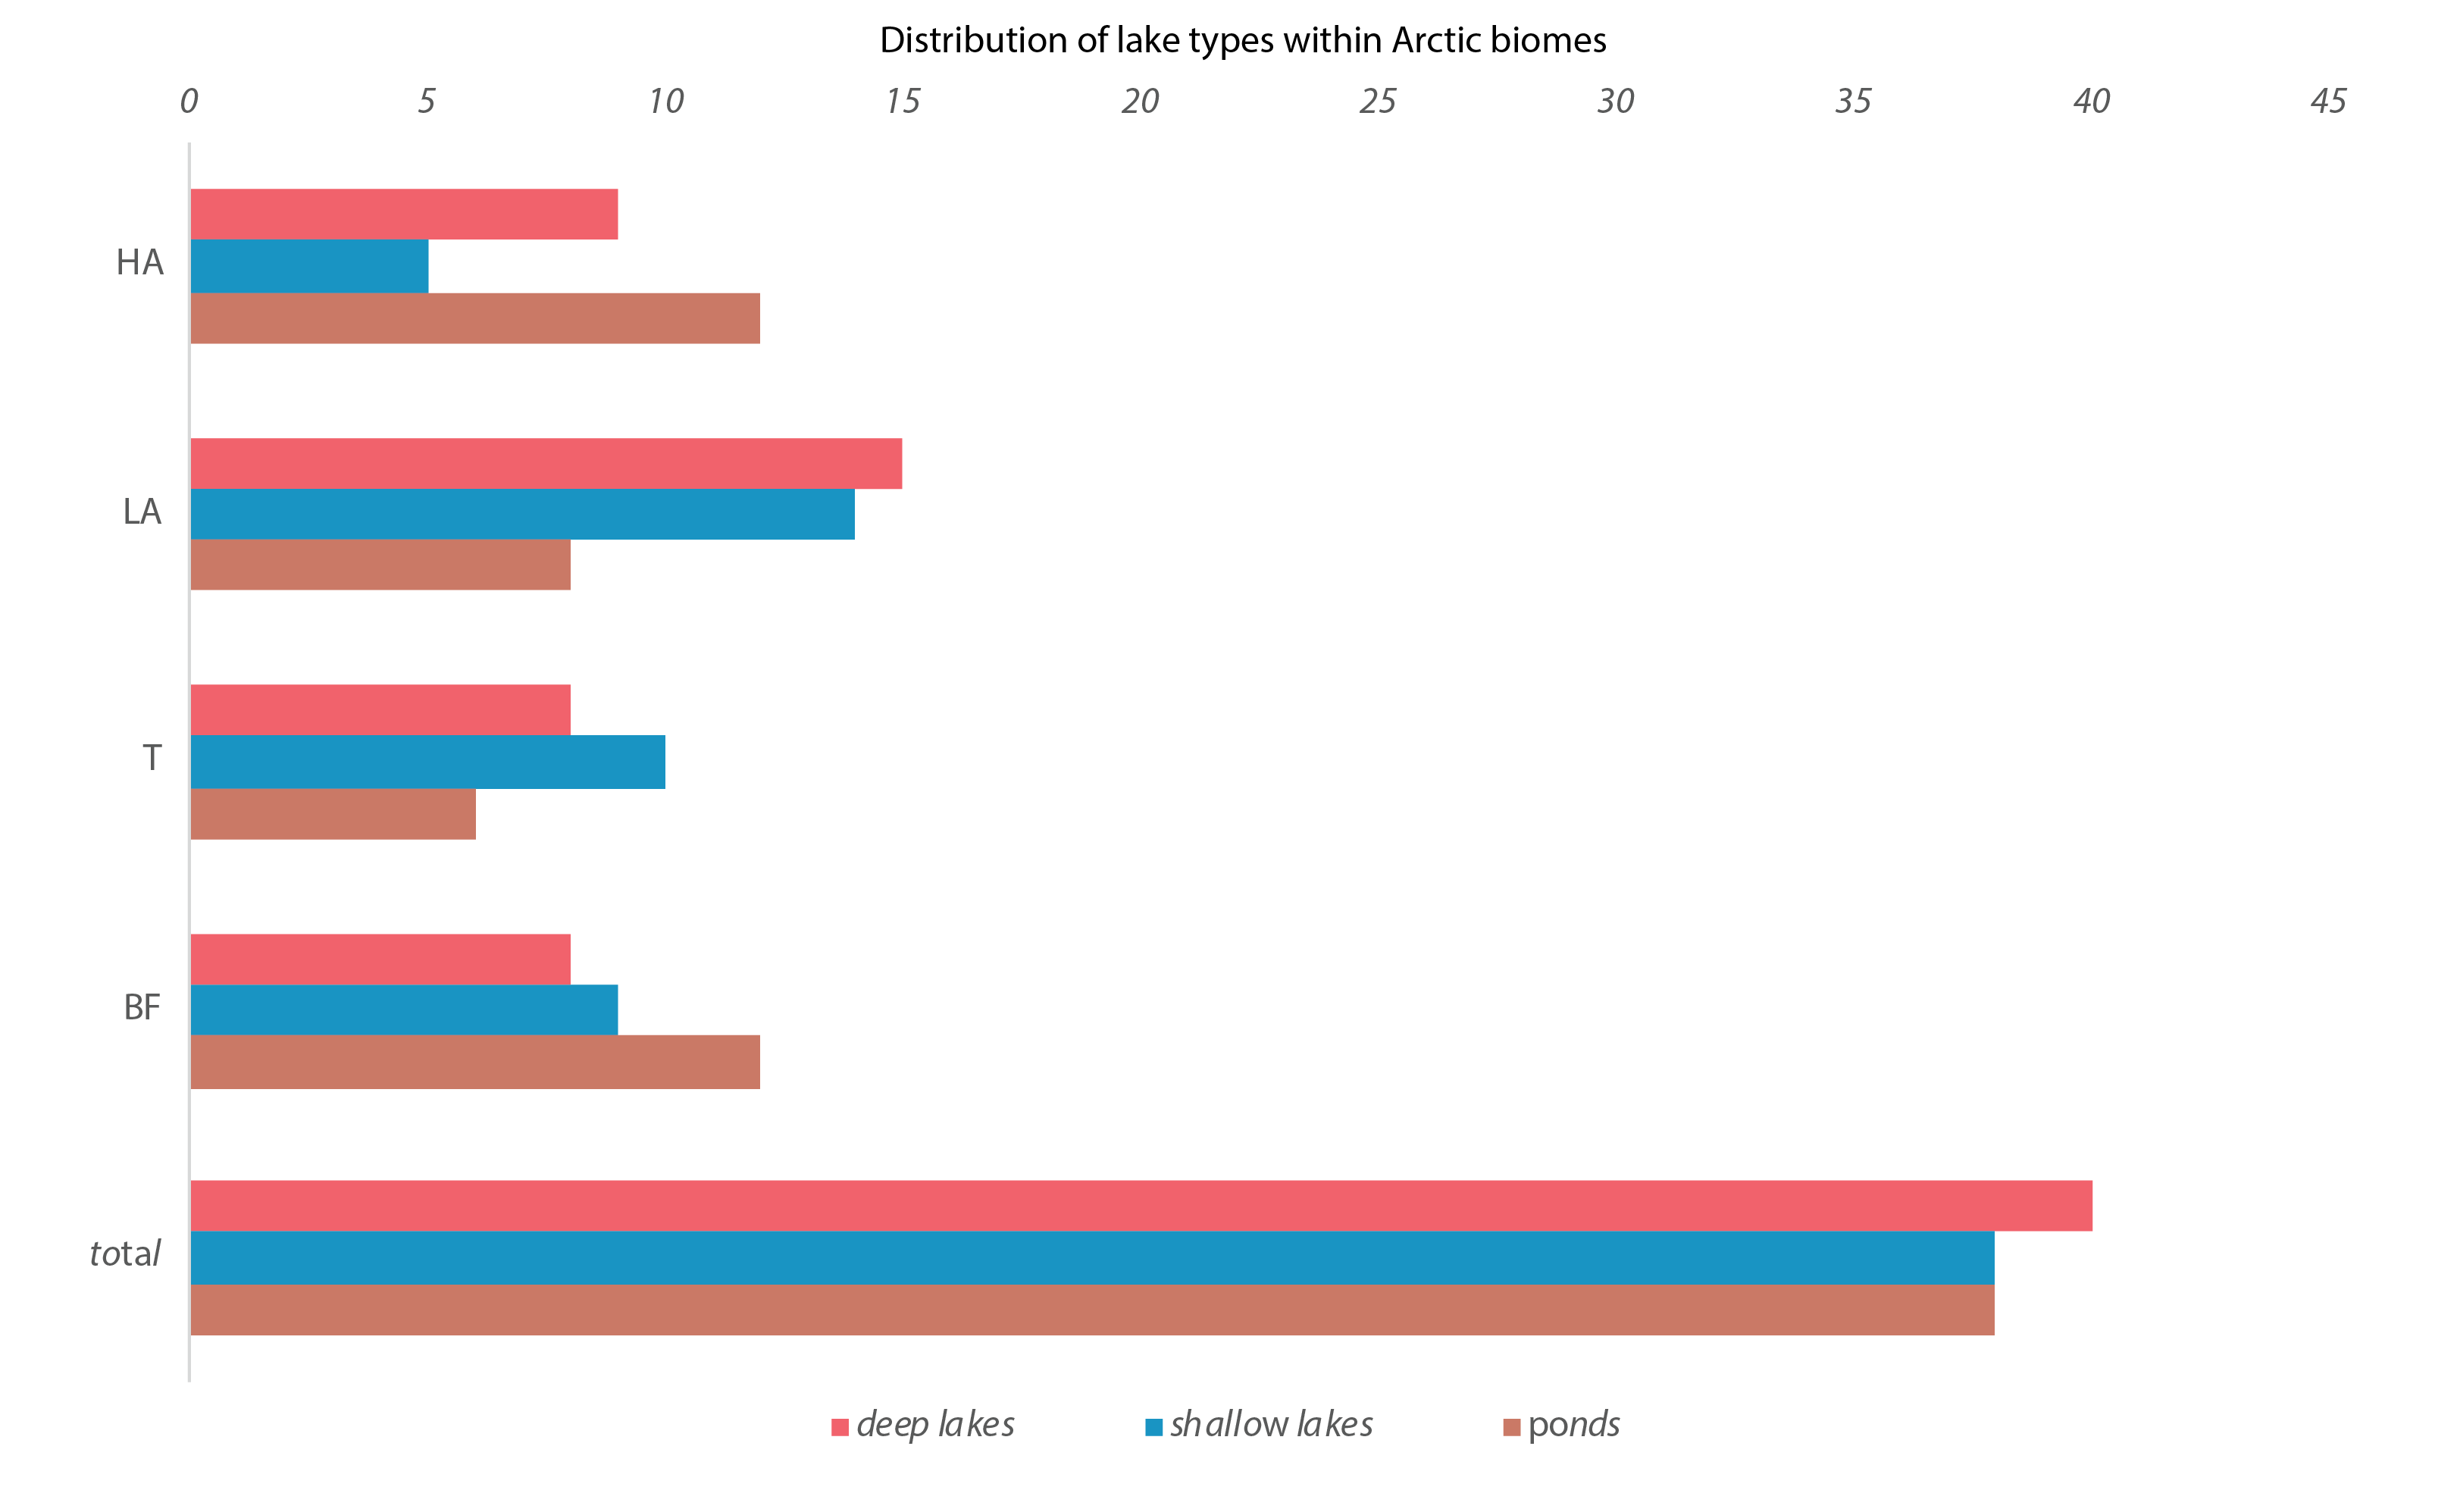
Figure 4-13 Number of deep lakes (red), shallow lakes (blue), and ponds (brown) in each geographical zone (BF, T, LA, HA). BF = Boreal Forest, T =Transition Zone, LA = Low Arctic, HA = High Arctic. State of the Arctic Freshwater Biodiversity Report - Chapter 4 - Page 40 - Figure 4-13
-
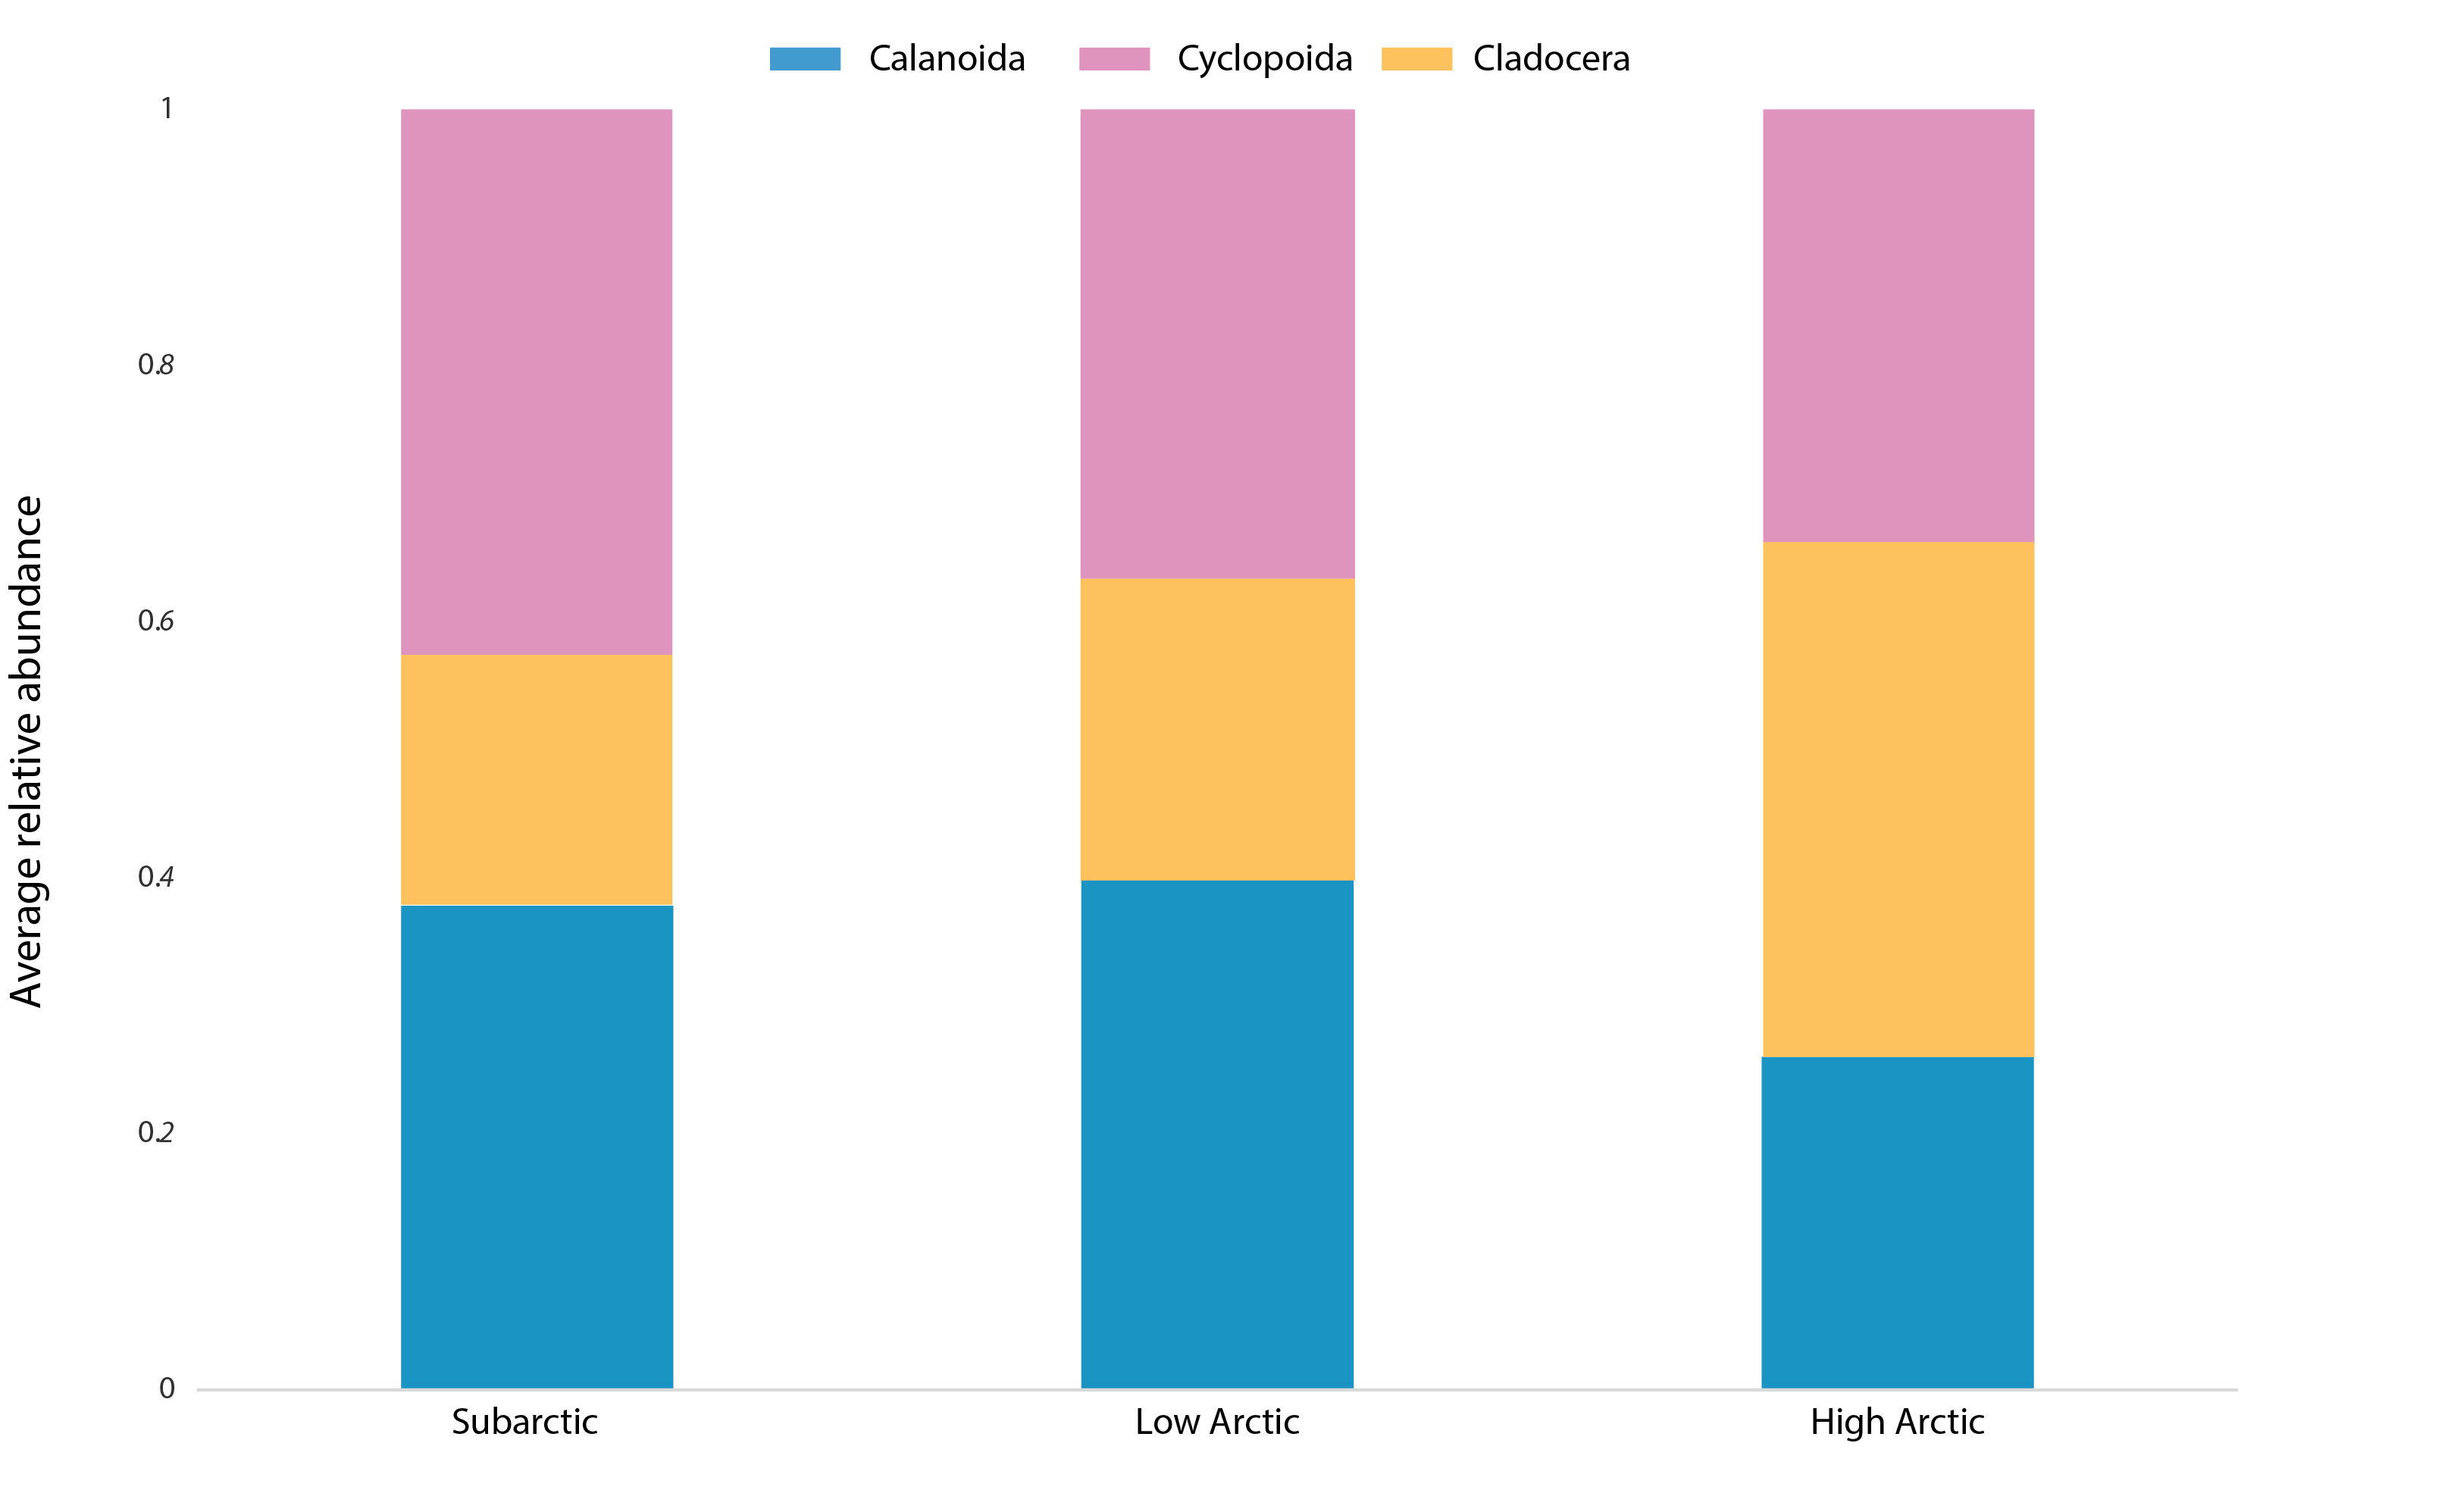
Average relative abundance of the main zooplankton groups (calanoid copepods, cyclopoid copepods, cladocerans) for the sub-Arctic (n=150), low- Arctic (n=154), and high-Arctic (n=55) regions. Samples with a single taxon have been excluded. State of the Arctic Freshwater Biodiversity Report - Chapter 4 - Page 61 - Figure 4-28
-
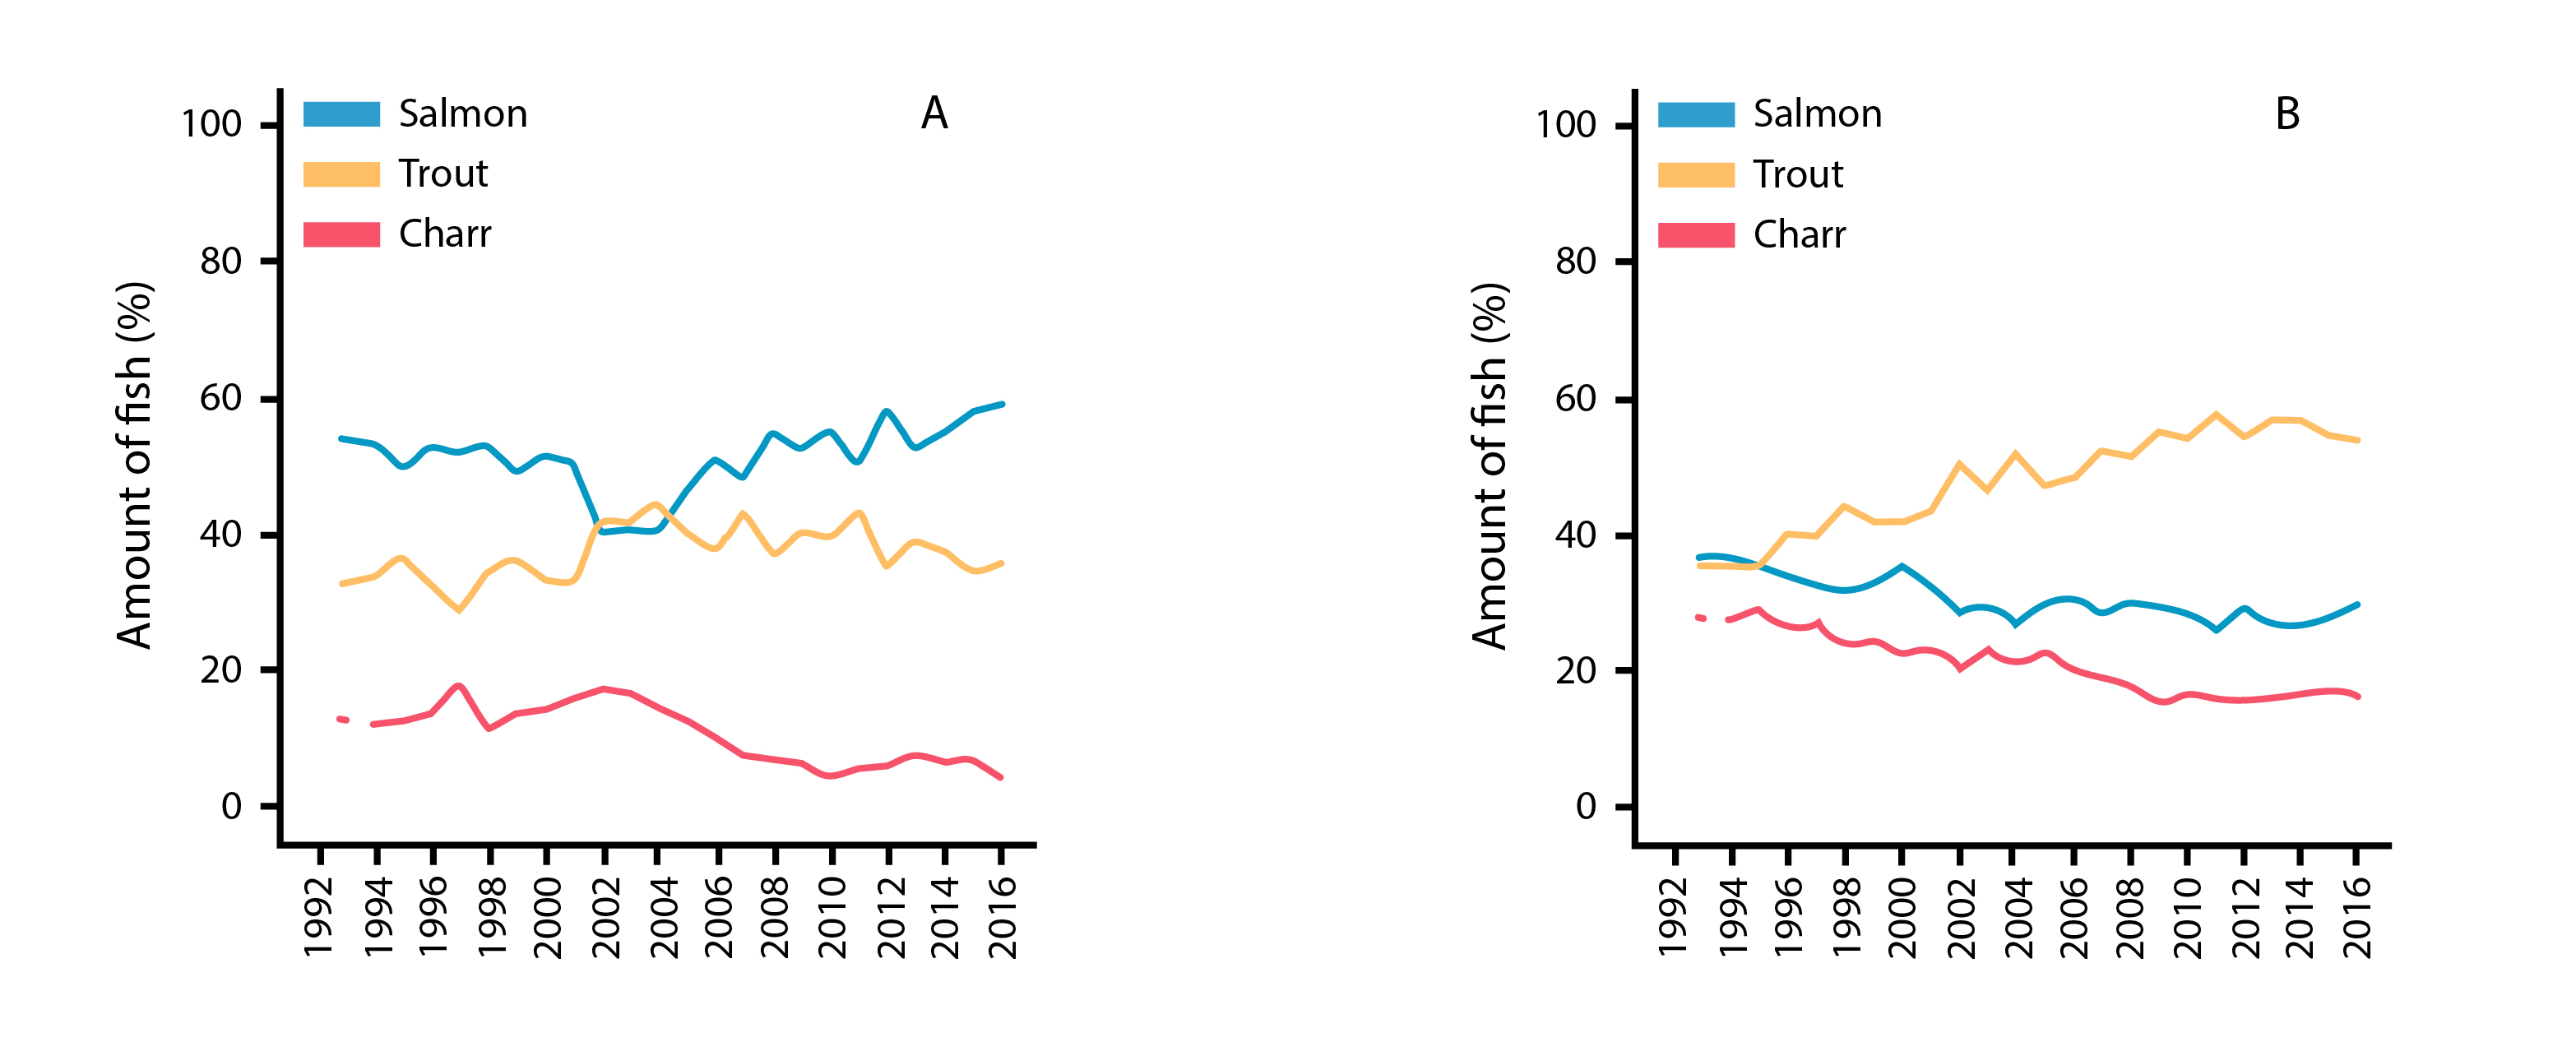
Temporal patterns in % abundance of Atlantic salmon, brown trout, and anadromous Arctic charr from catch statistics in northern Norway rivers monitored from 1993 to 2016, including basins dominated by (a) rivers and (b) lakes. State of the Arctic Freshwater Biodiversity Report - Chapter 4 - Page 81- Figure 4-42
-
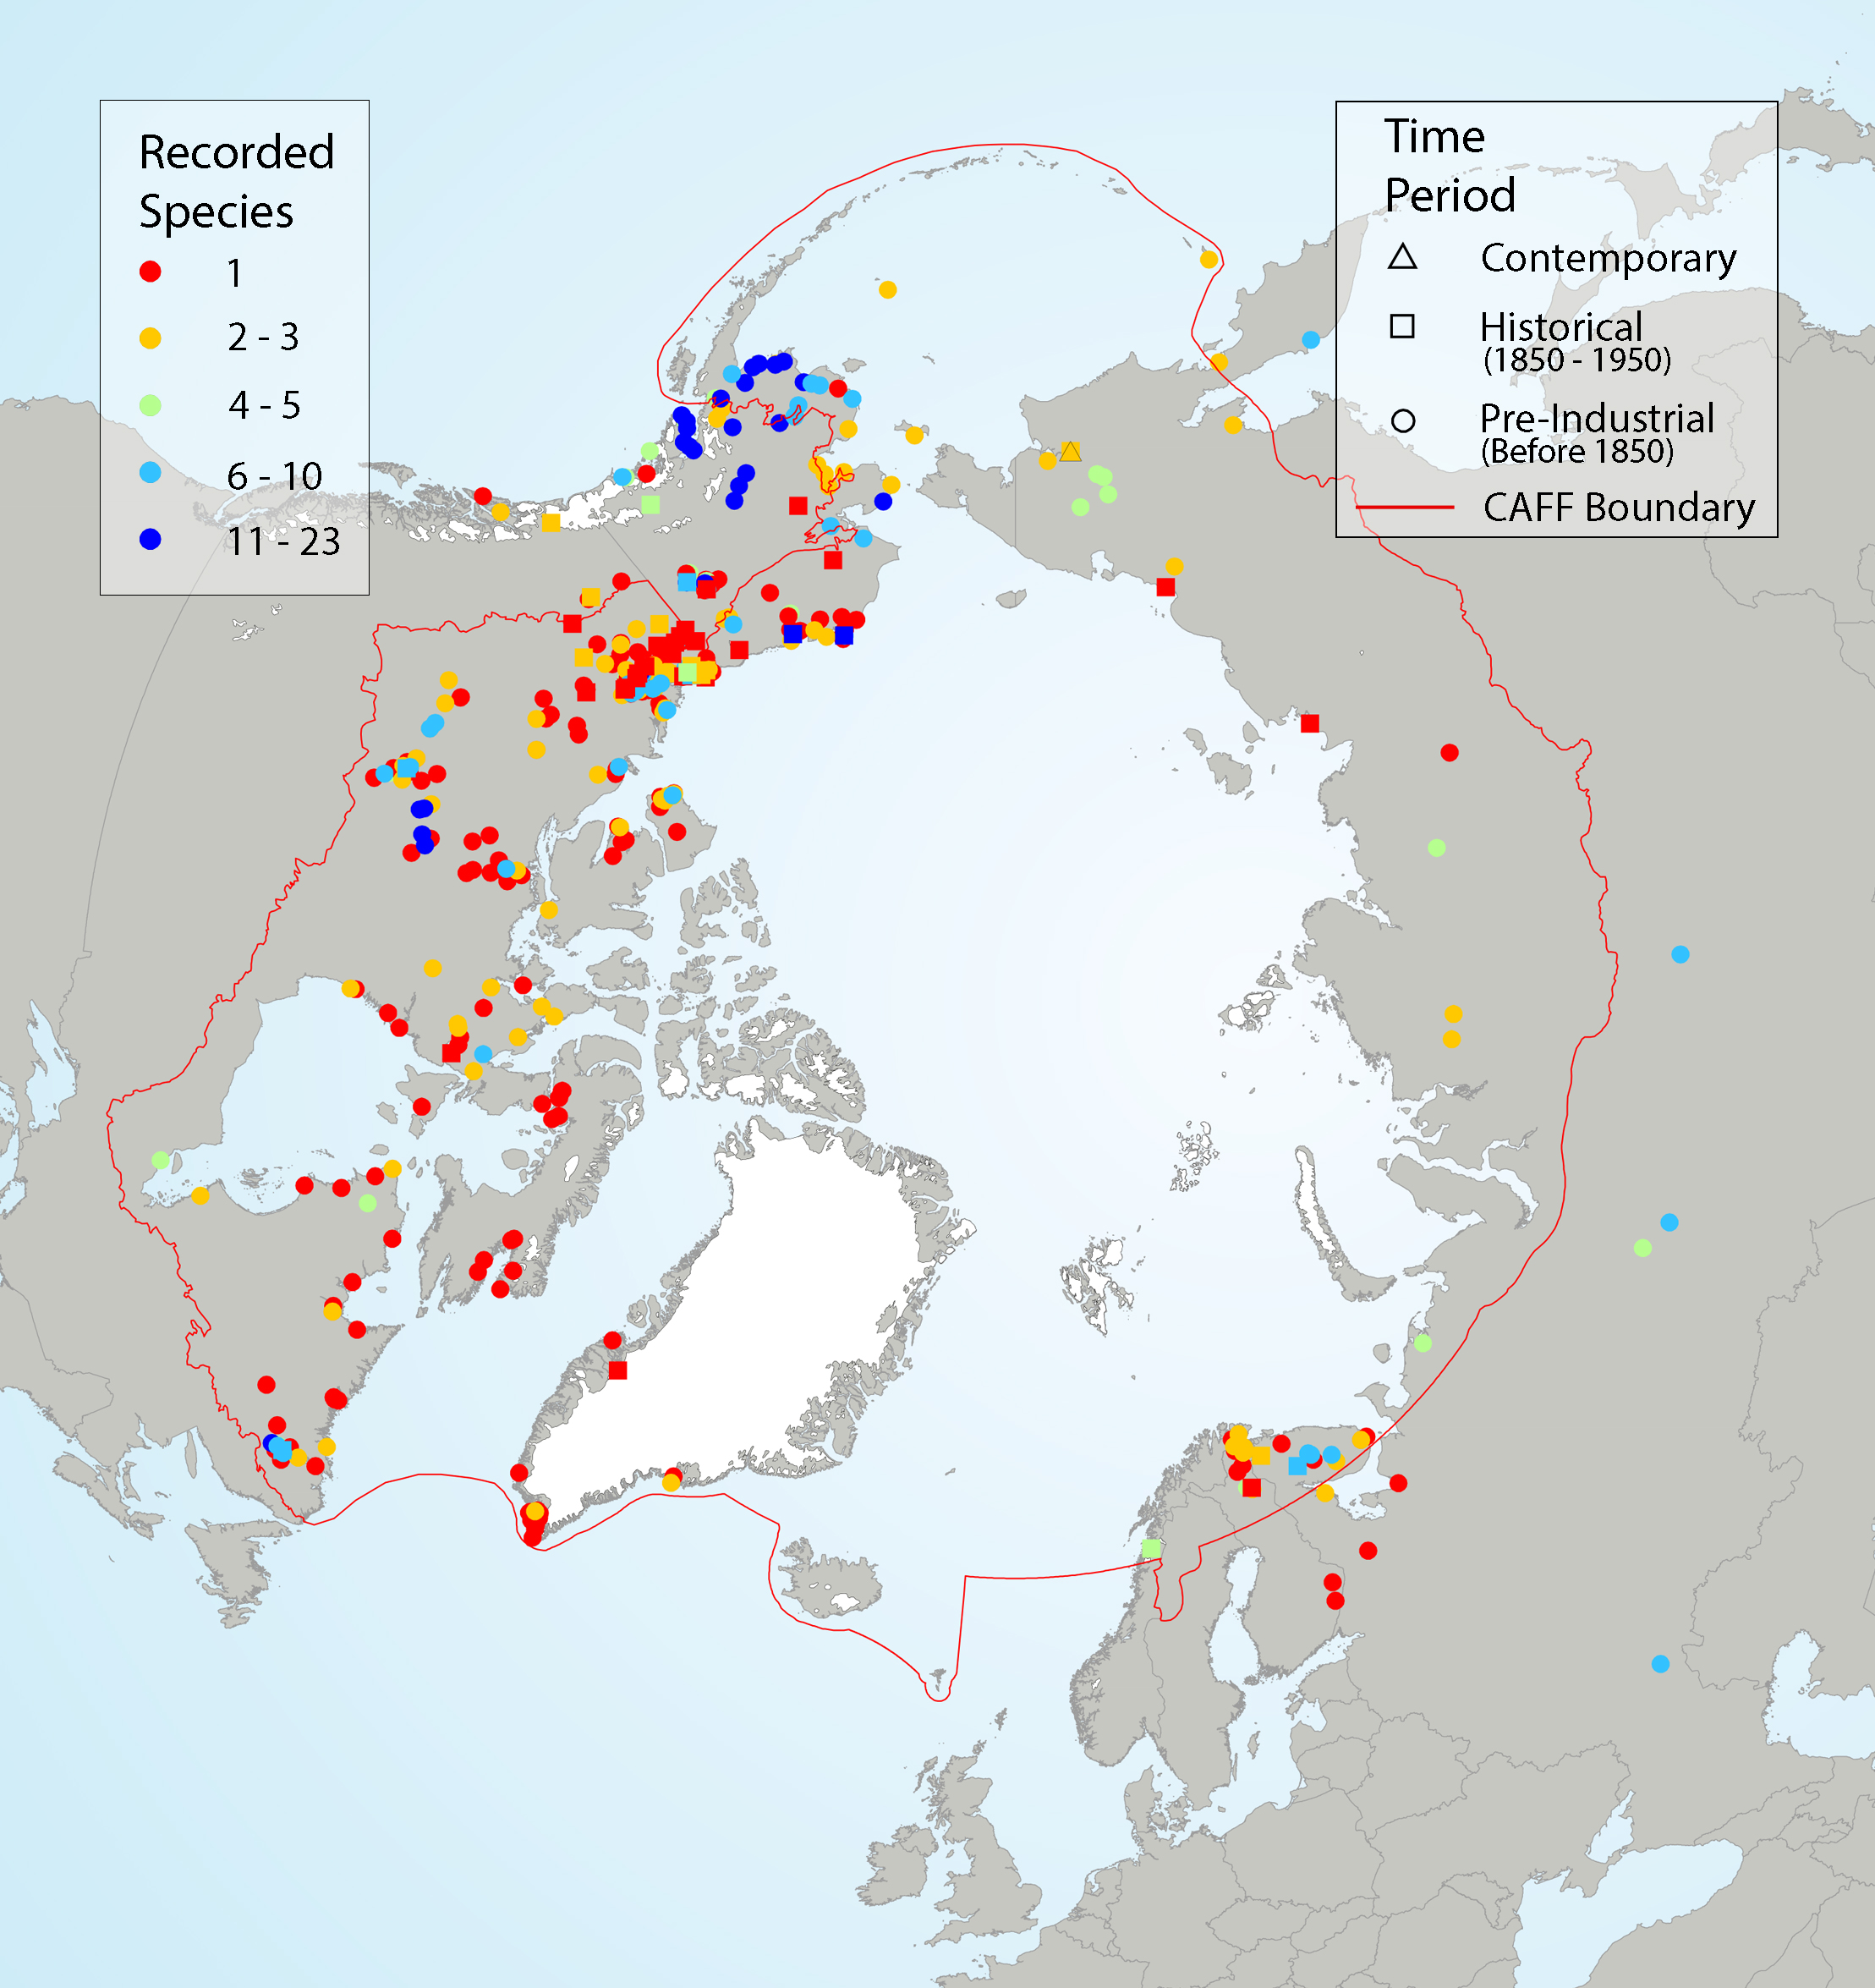
Fish species observations from Traditional Knowledge (TK ) literature, plotted in the approximate geographic location of observed record, with symbol colour indicating the number of fish species recorded and shape indicating the approximate time period of observation. Results are from a systematic literature search of TK sources from Alaska, Canada, Greenland, Fennoscandia, and Russia. State of the Arctic Freshwater Biodiversity Report - Chapter 4 - Page 75- Figure 4-37
-
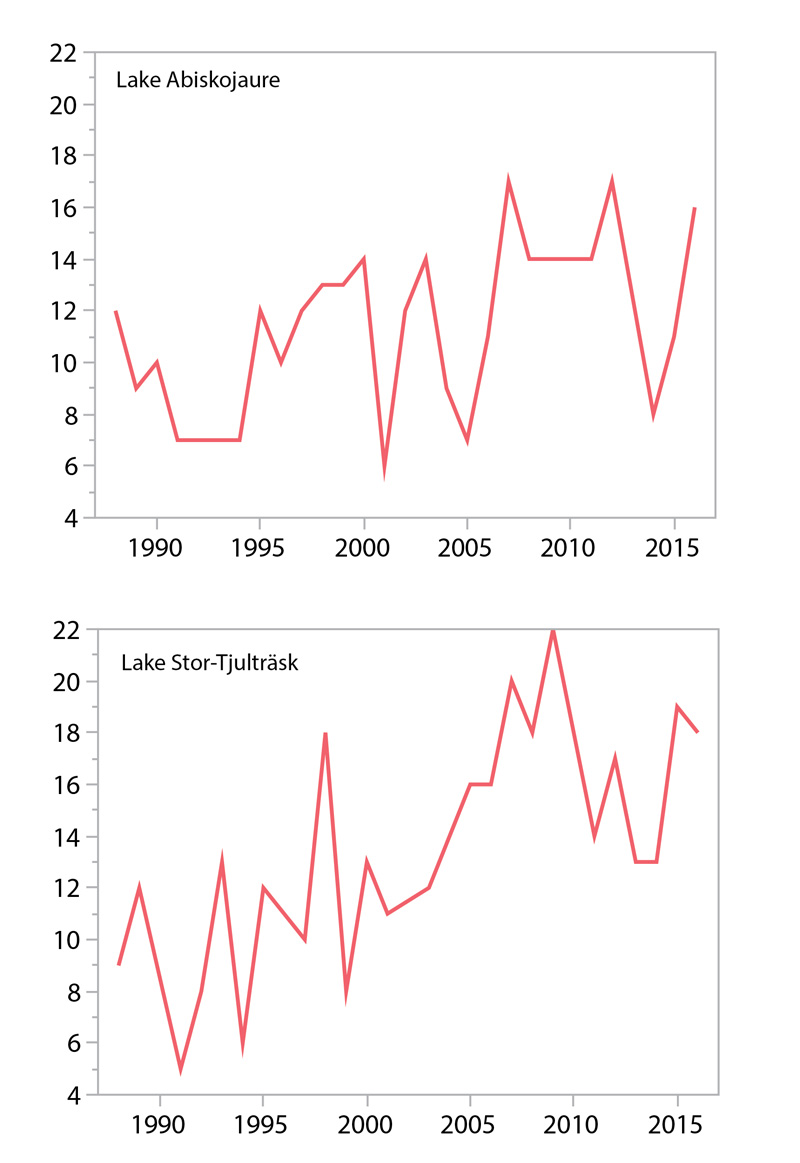
30-year trends in alpha diversity of benthic macroinvertebrates in the stony littoral zones (1 m depth) of two Scandinavian Arctic/alpine lakes: Lake Abiskojaure (upper panel) and Lake Stor-Tjulträsk (lower panel). State of the Arctic Freshwater Biodiversity Report - Chapter 4 - Page 71- Figure 4-35
-

Although the circumpolar countries endeavor to support monitoring programs that provide good coverage of Arctic and subarctic regions, this ideal is constrained by the high costs associated with repeated sampling of a large set of lakes and rivers in areas that often are very remote. Consequently, freshwater monitoring has sparse, spatial coverage in large parts of the Arctic, with only Fennoscandia and Iceland having extensive monitoring coverage of lakes and streams Figure 6-2 Current state of monitoring for river FECs in each Arctic country State of the Arctic Freshwater Biodiversity Report - Chapter 6 - Page 94 - Figure 6-2
-
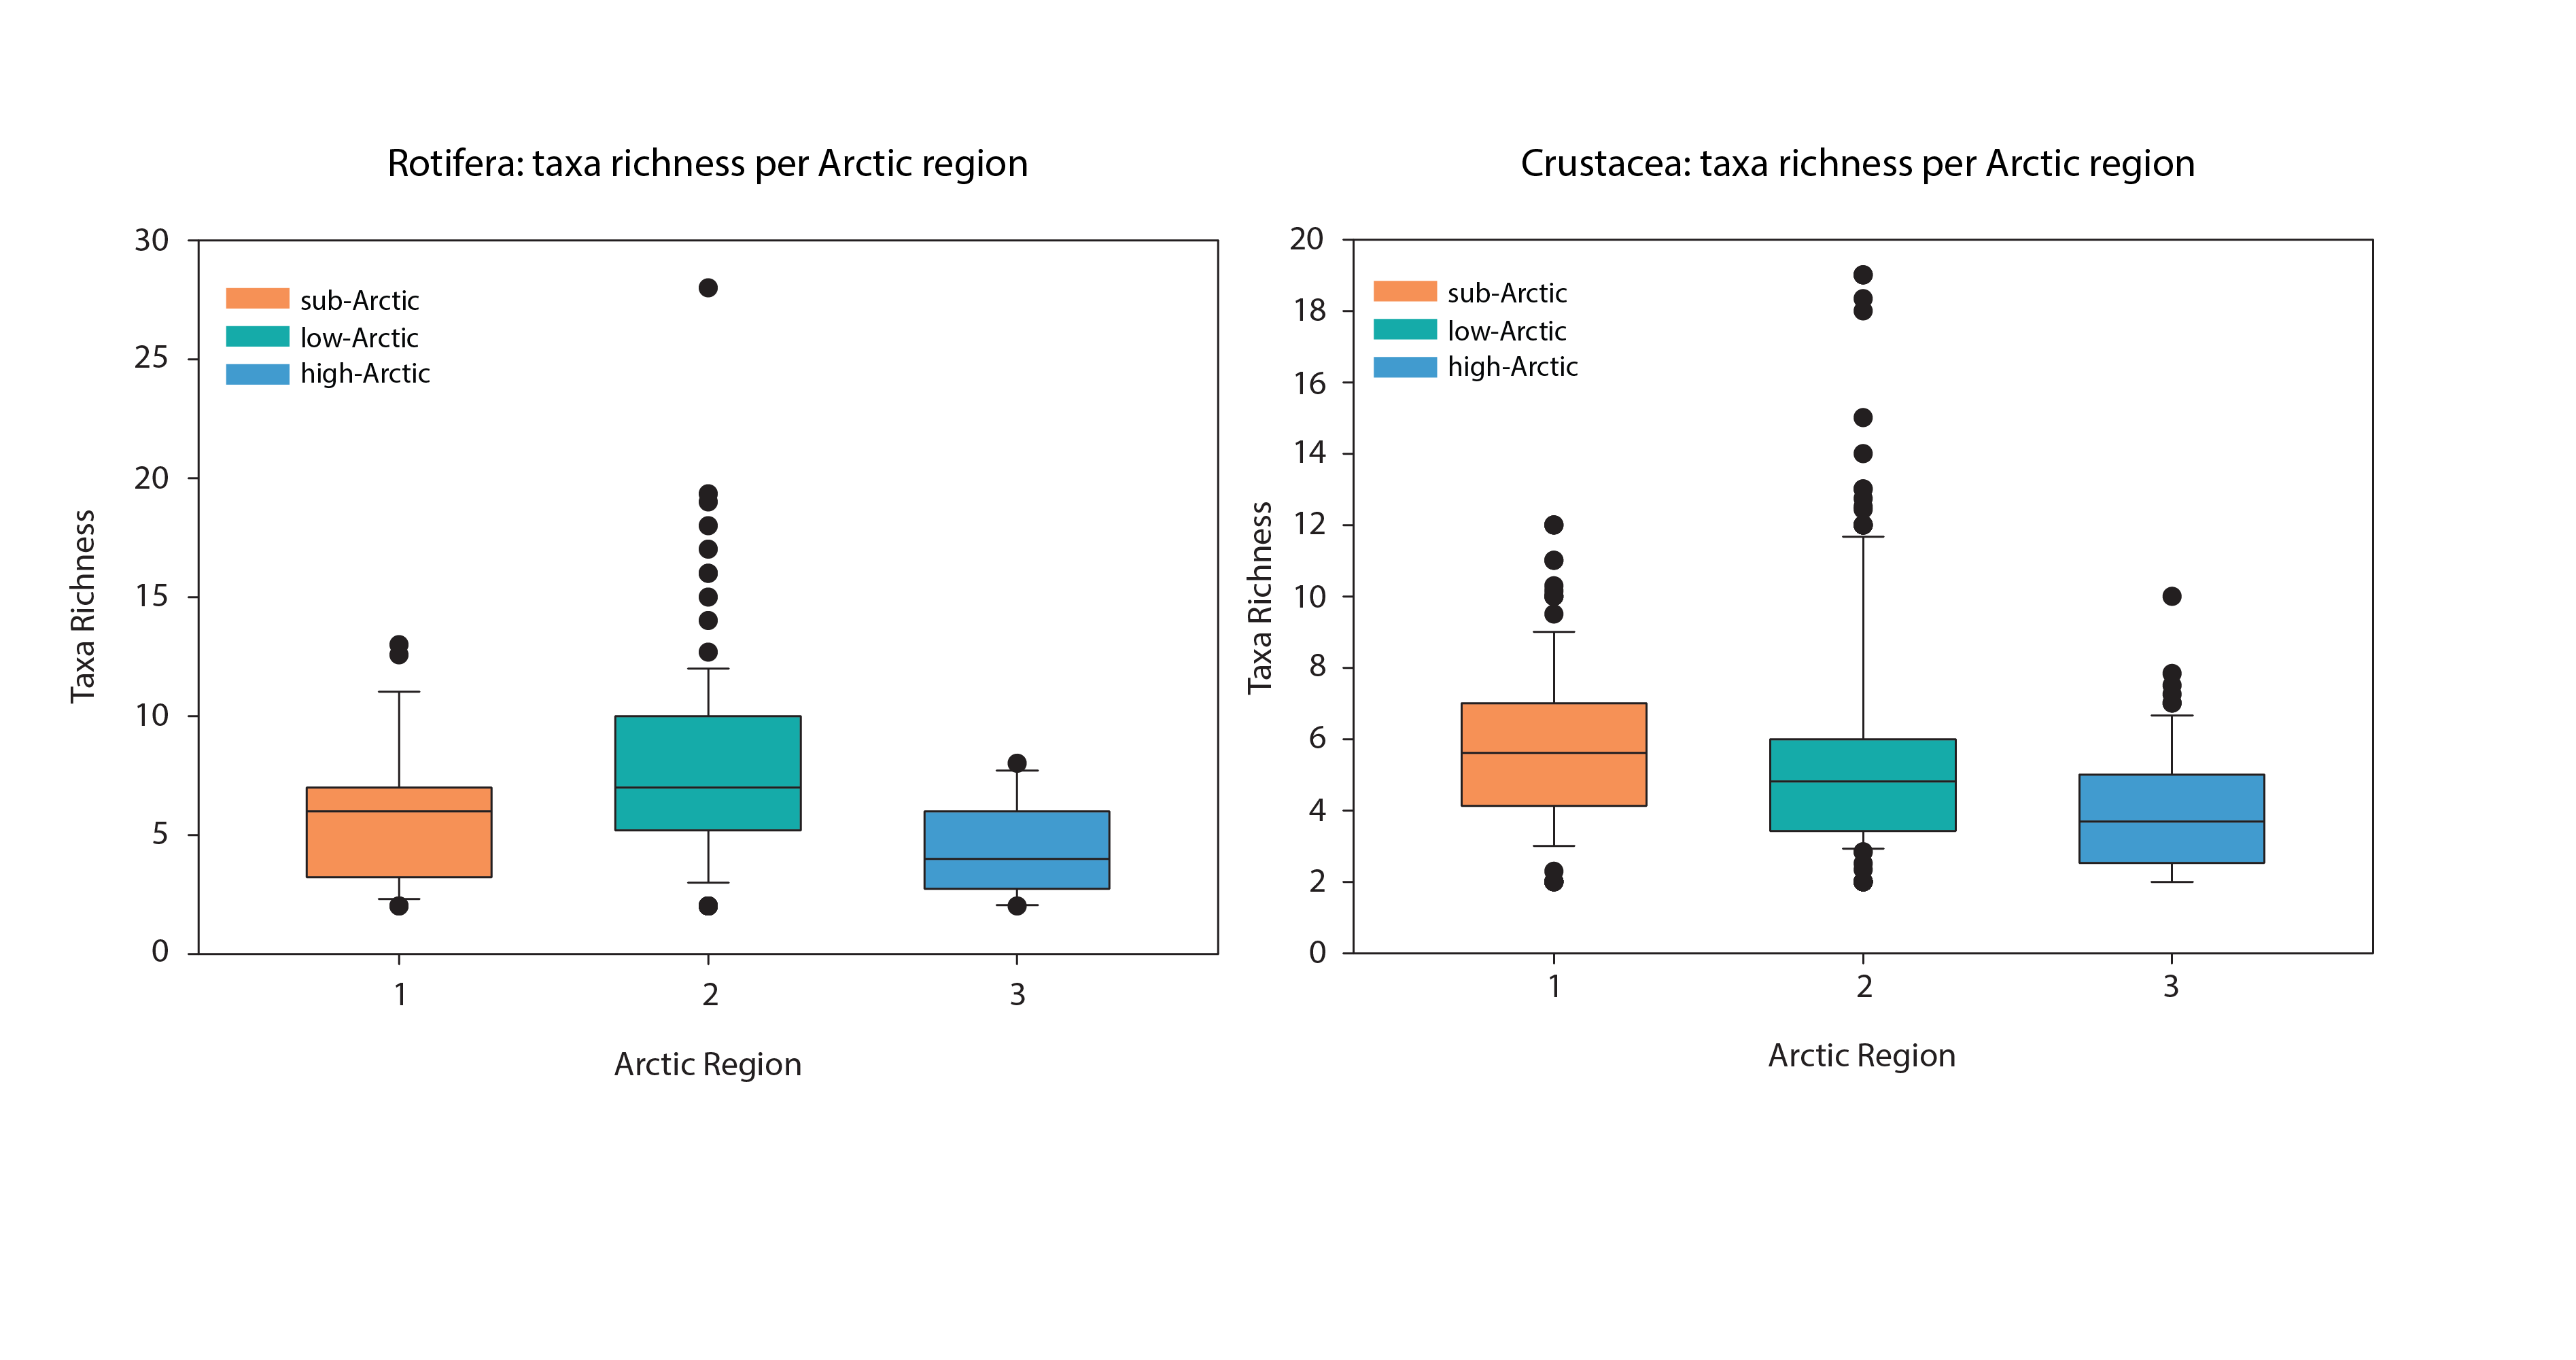
Box-plots of taxa richness (average per lake) by Arctic regions for rotifers (left) and crustaceans (right). Crustacean taxa are restricted to taxa within Calanoida, Cyclopoida and Cladocera. Samples with only a single taxon have been excluded. Boxes represent median and interquartile range. State of the Arctic Freshwater Biodiversity Report - Chapter 4 - Page 60 - Figure 4-27
-
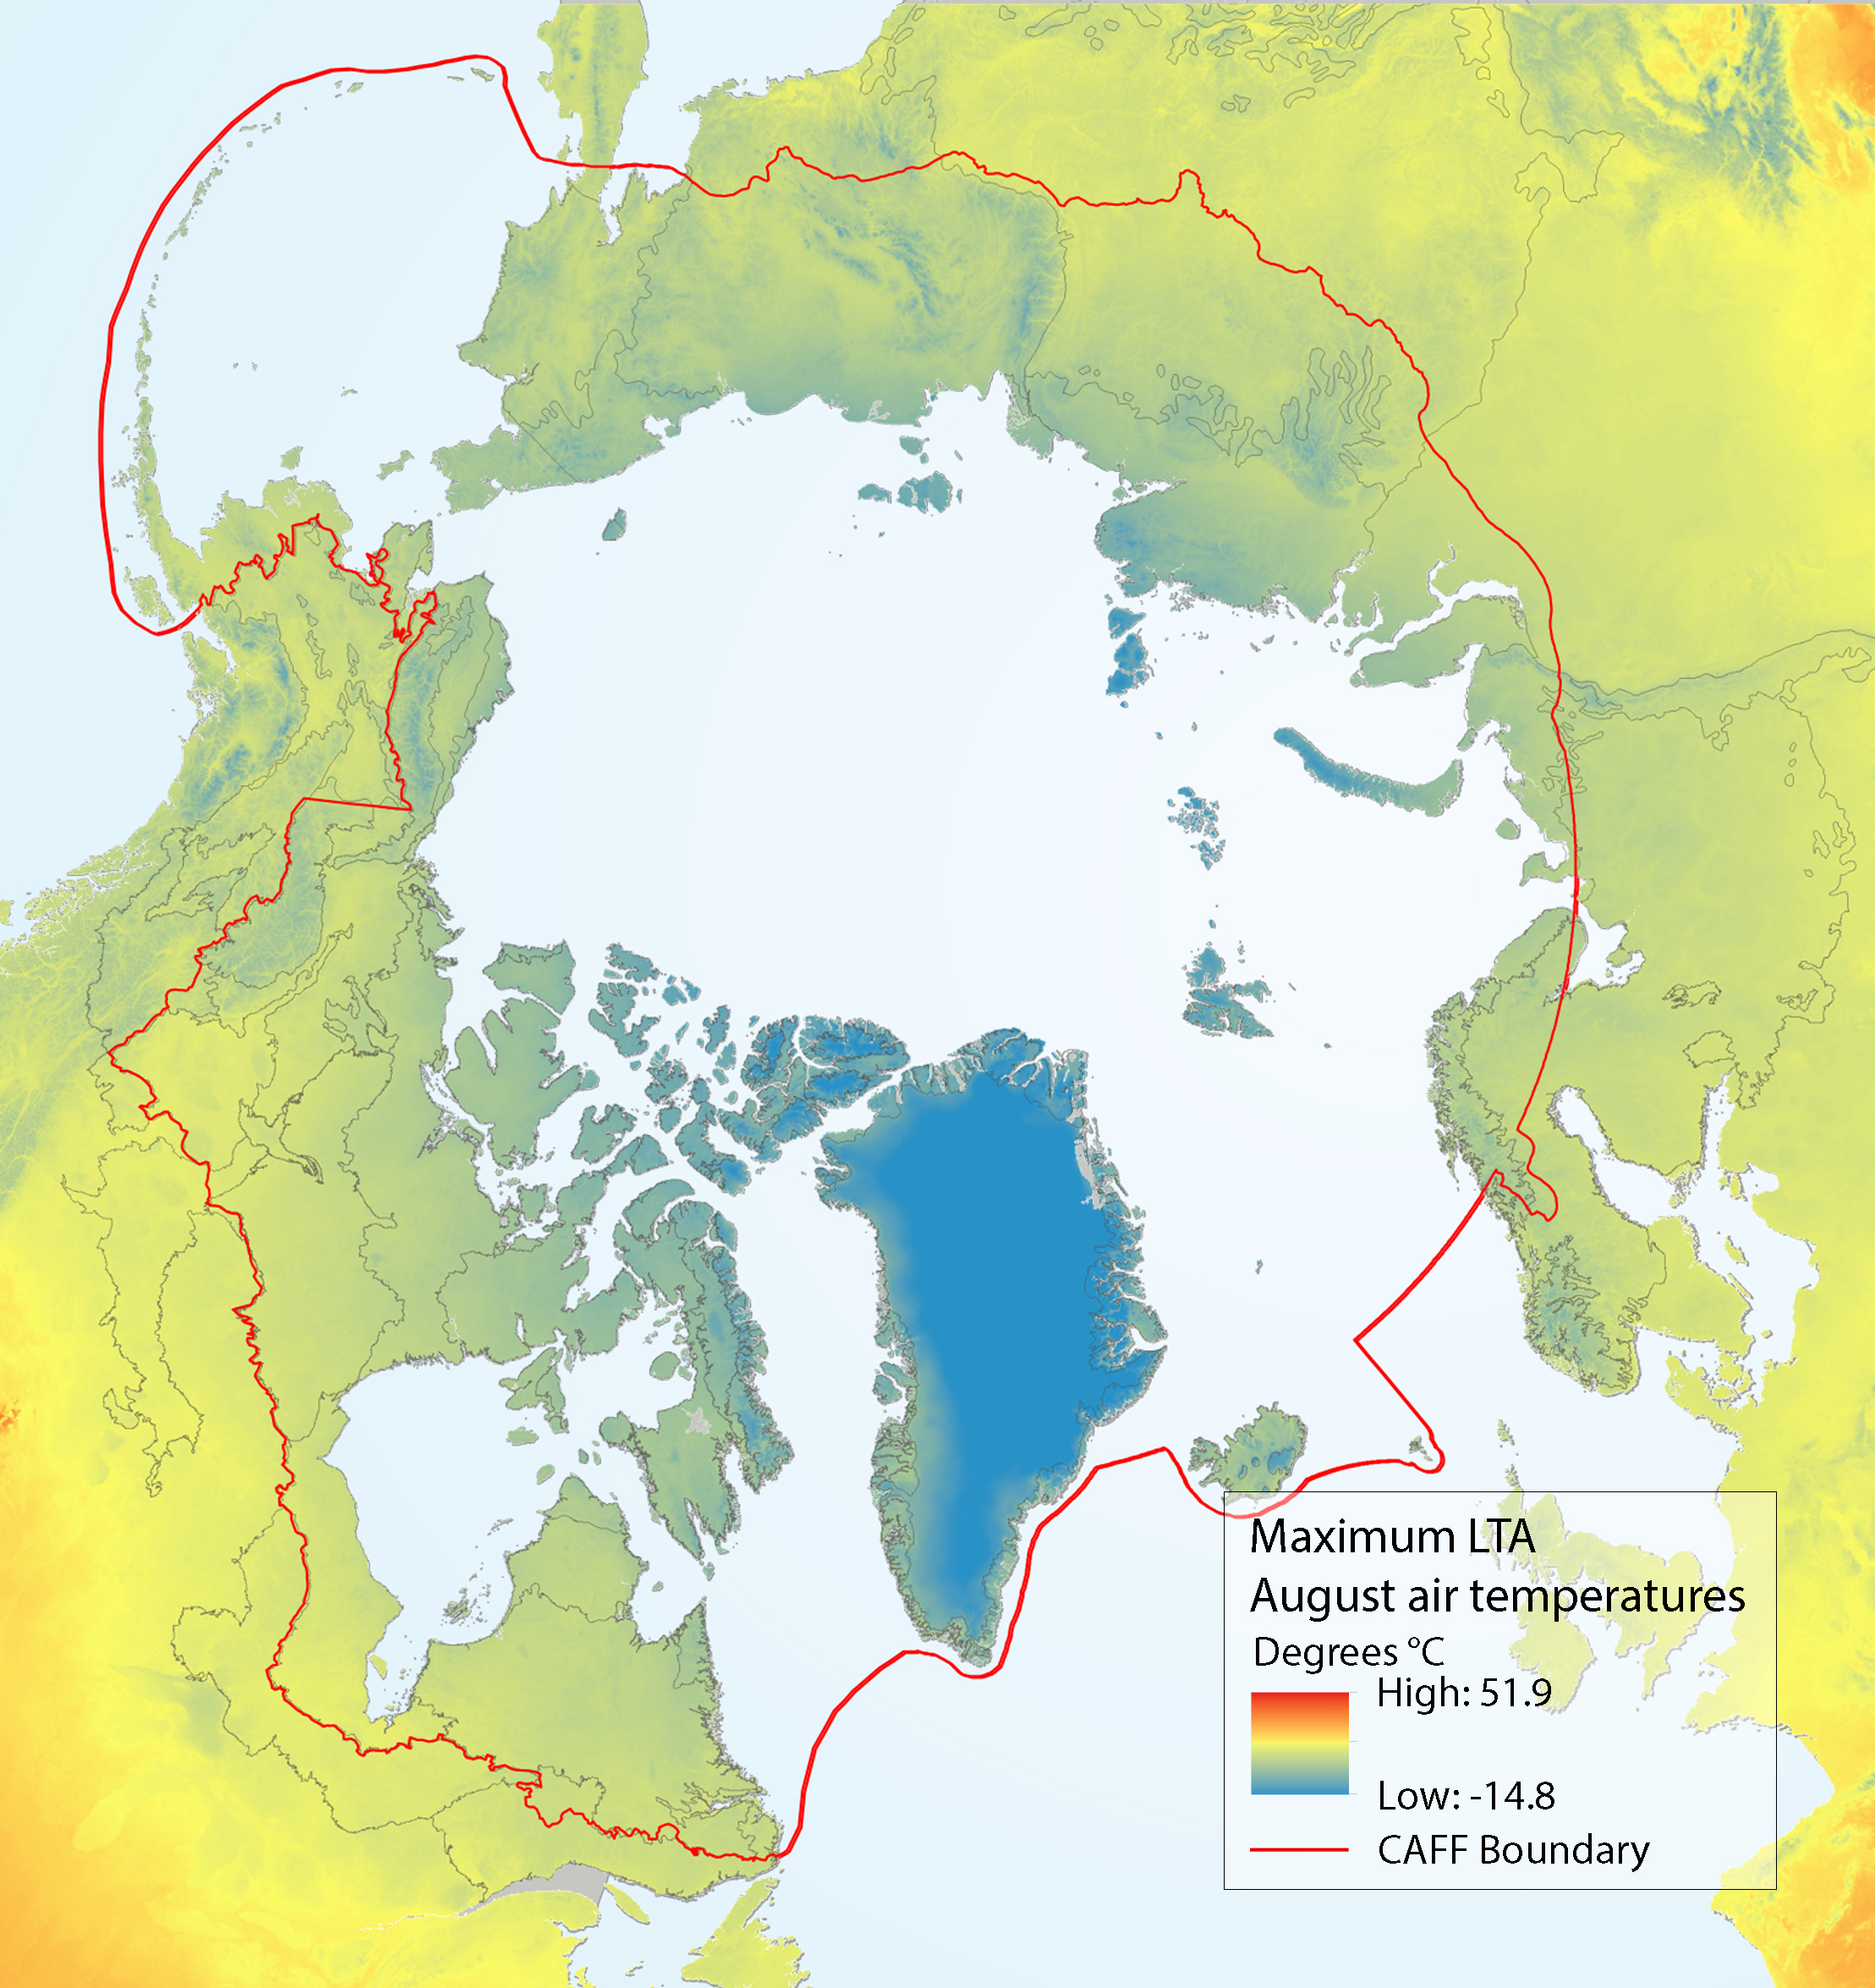
Maximum LTA (long-term average) August air temperatures for the circumpolar region, with ecoregions used in the analysis of the SAFBR outlined in black. Source for temperature layer: Fick and Hijmans (2017). State of the Arctic Freshwater Biodiversity Report - Chapter 5 - Page 89 - Figure 5-5
-
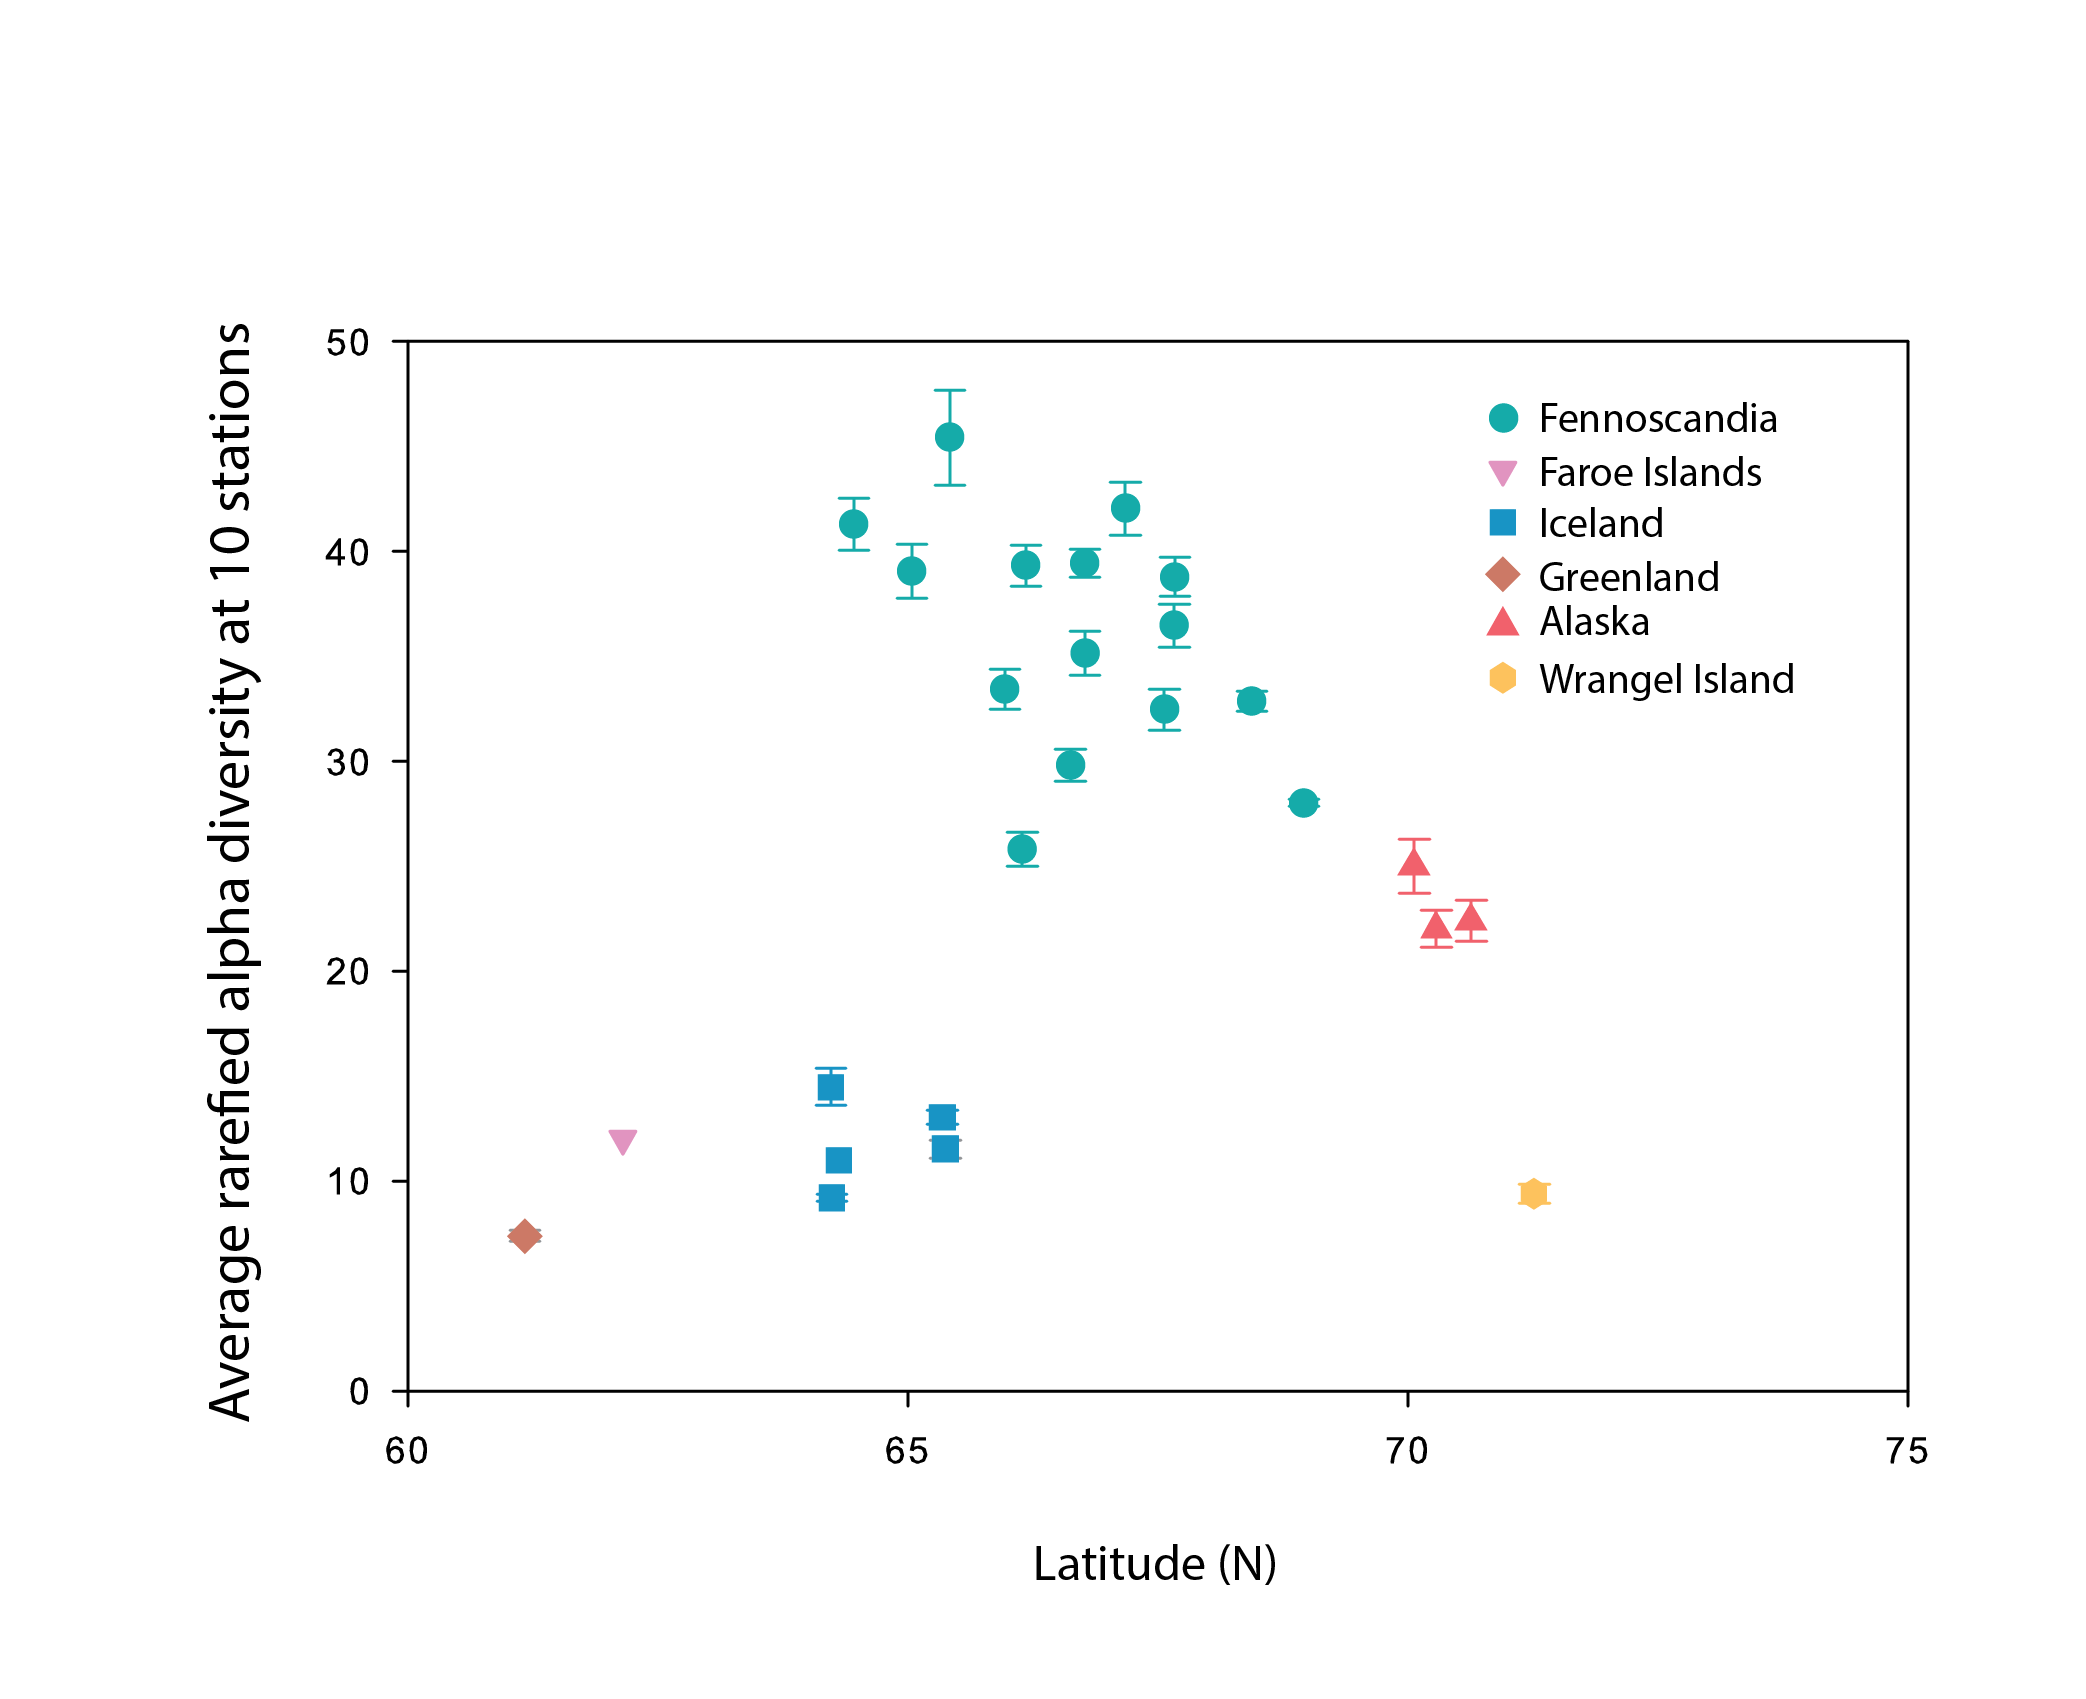
Alpha diversity (rarefied to 10 stations, with error bars indicating standard error) of littoral lake benthic macroinvertebrates plotted as a function of the average latitude of stations in each hydrobasin. Hydrobasins are coloured by country/region. State of the Arctic Freshwater Biodiversity Report - Chapter 4- Page 68 - Figure 4-31
-
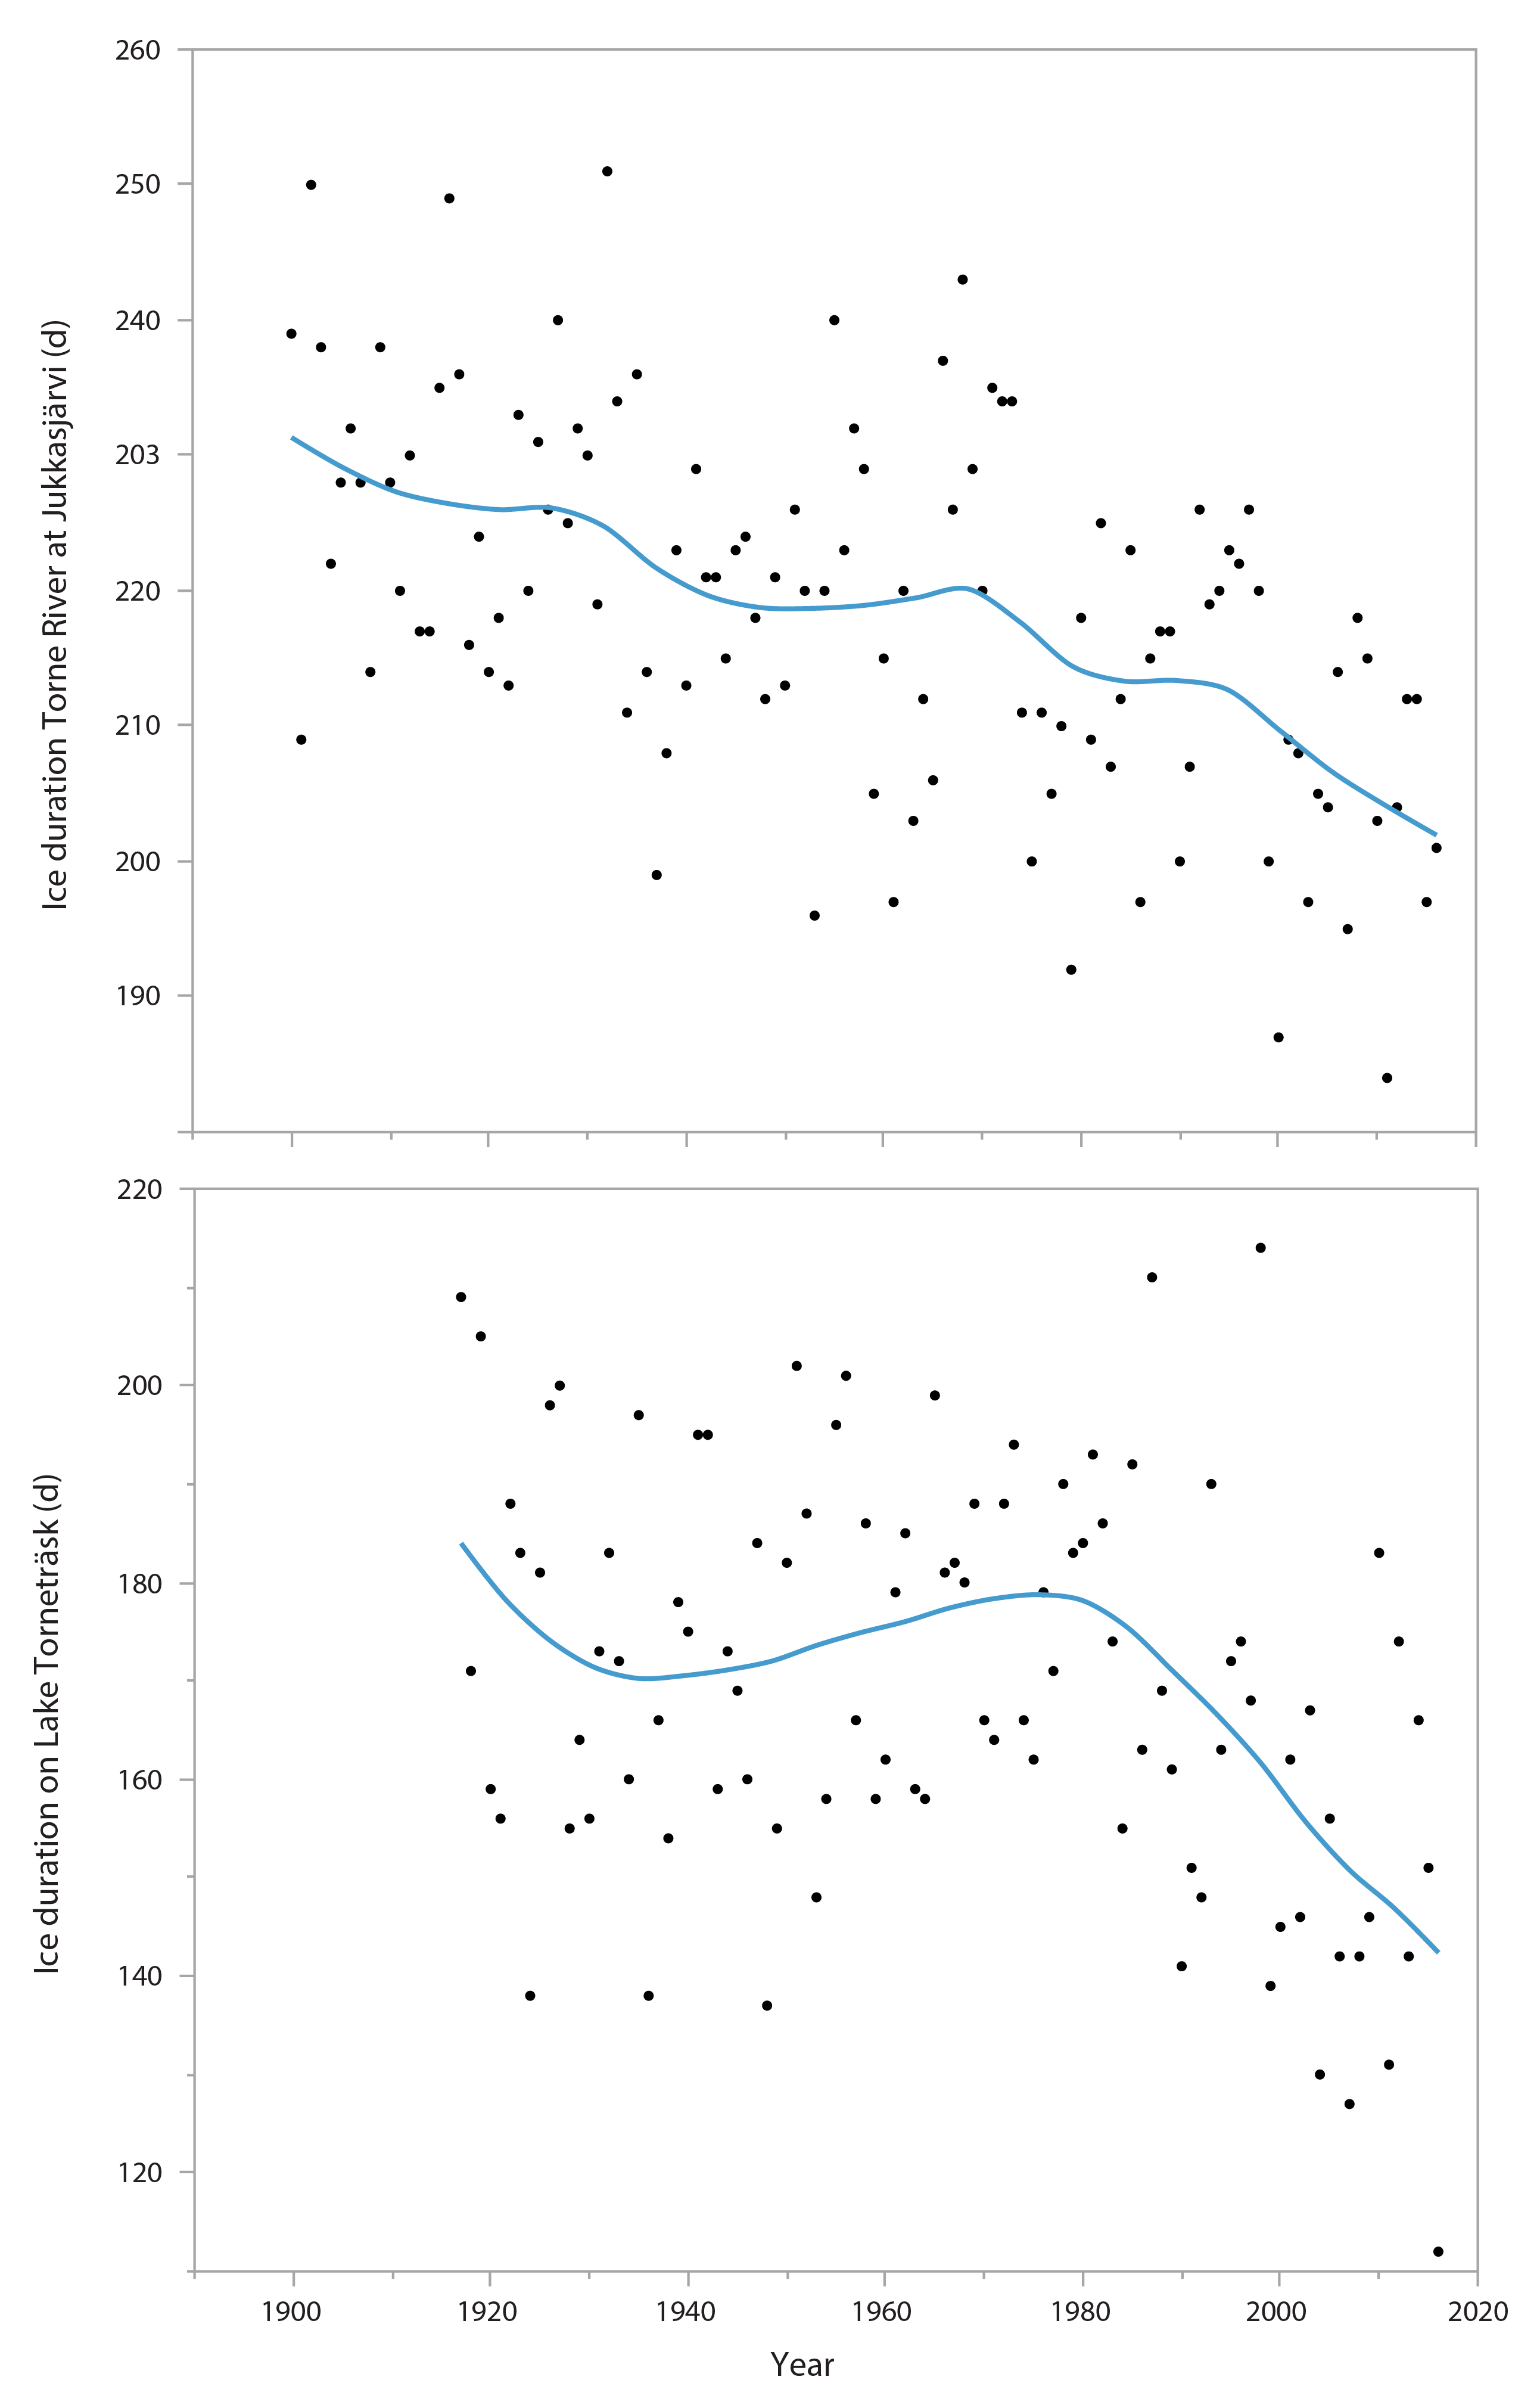
Figure 3-1 Long-term trends in ice duration (as days) in the River Torne (upper plot) and Lake Torneträsk (lower plot) at 68° north on the Scandinavian peninsula. Lines show smooth fit. Data source: Swedish Meteorological and Hydrological Institute. State of the Arctic Freshwater Biodiversity Report - Chapter 3 - Page 19 - Figure 3-1