 Arctic Biodiversity Data Service - ABDS Catalog
dataset
Type of resources
Available actions
Topics
Keywords
Contact for the resource
Provided by
Years
Formats
Representation types
Update frequencies
status
Scale
-
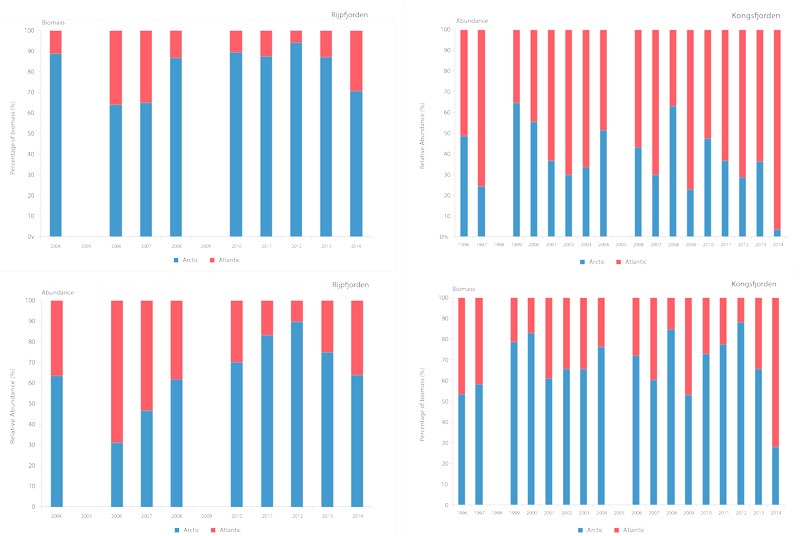
Time series of relative proportions of Arctic and Atlantic Calanus species in Kongsfjorden (top) and Rijpfjorden (bottom) (Source: MOSJ, Norwegian Polar Institute). STATE OF THE ARCTIC MARINE BIODIVERSITY REPORT - <a href="https://arcticbiodiversity.is/findings/plankton" target="_blank">Chapter 3</a> - Page 77 - Figure 3.2.8
-
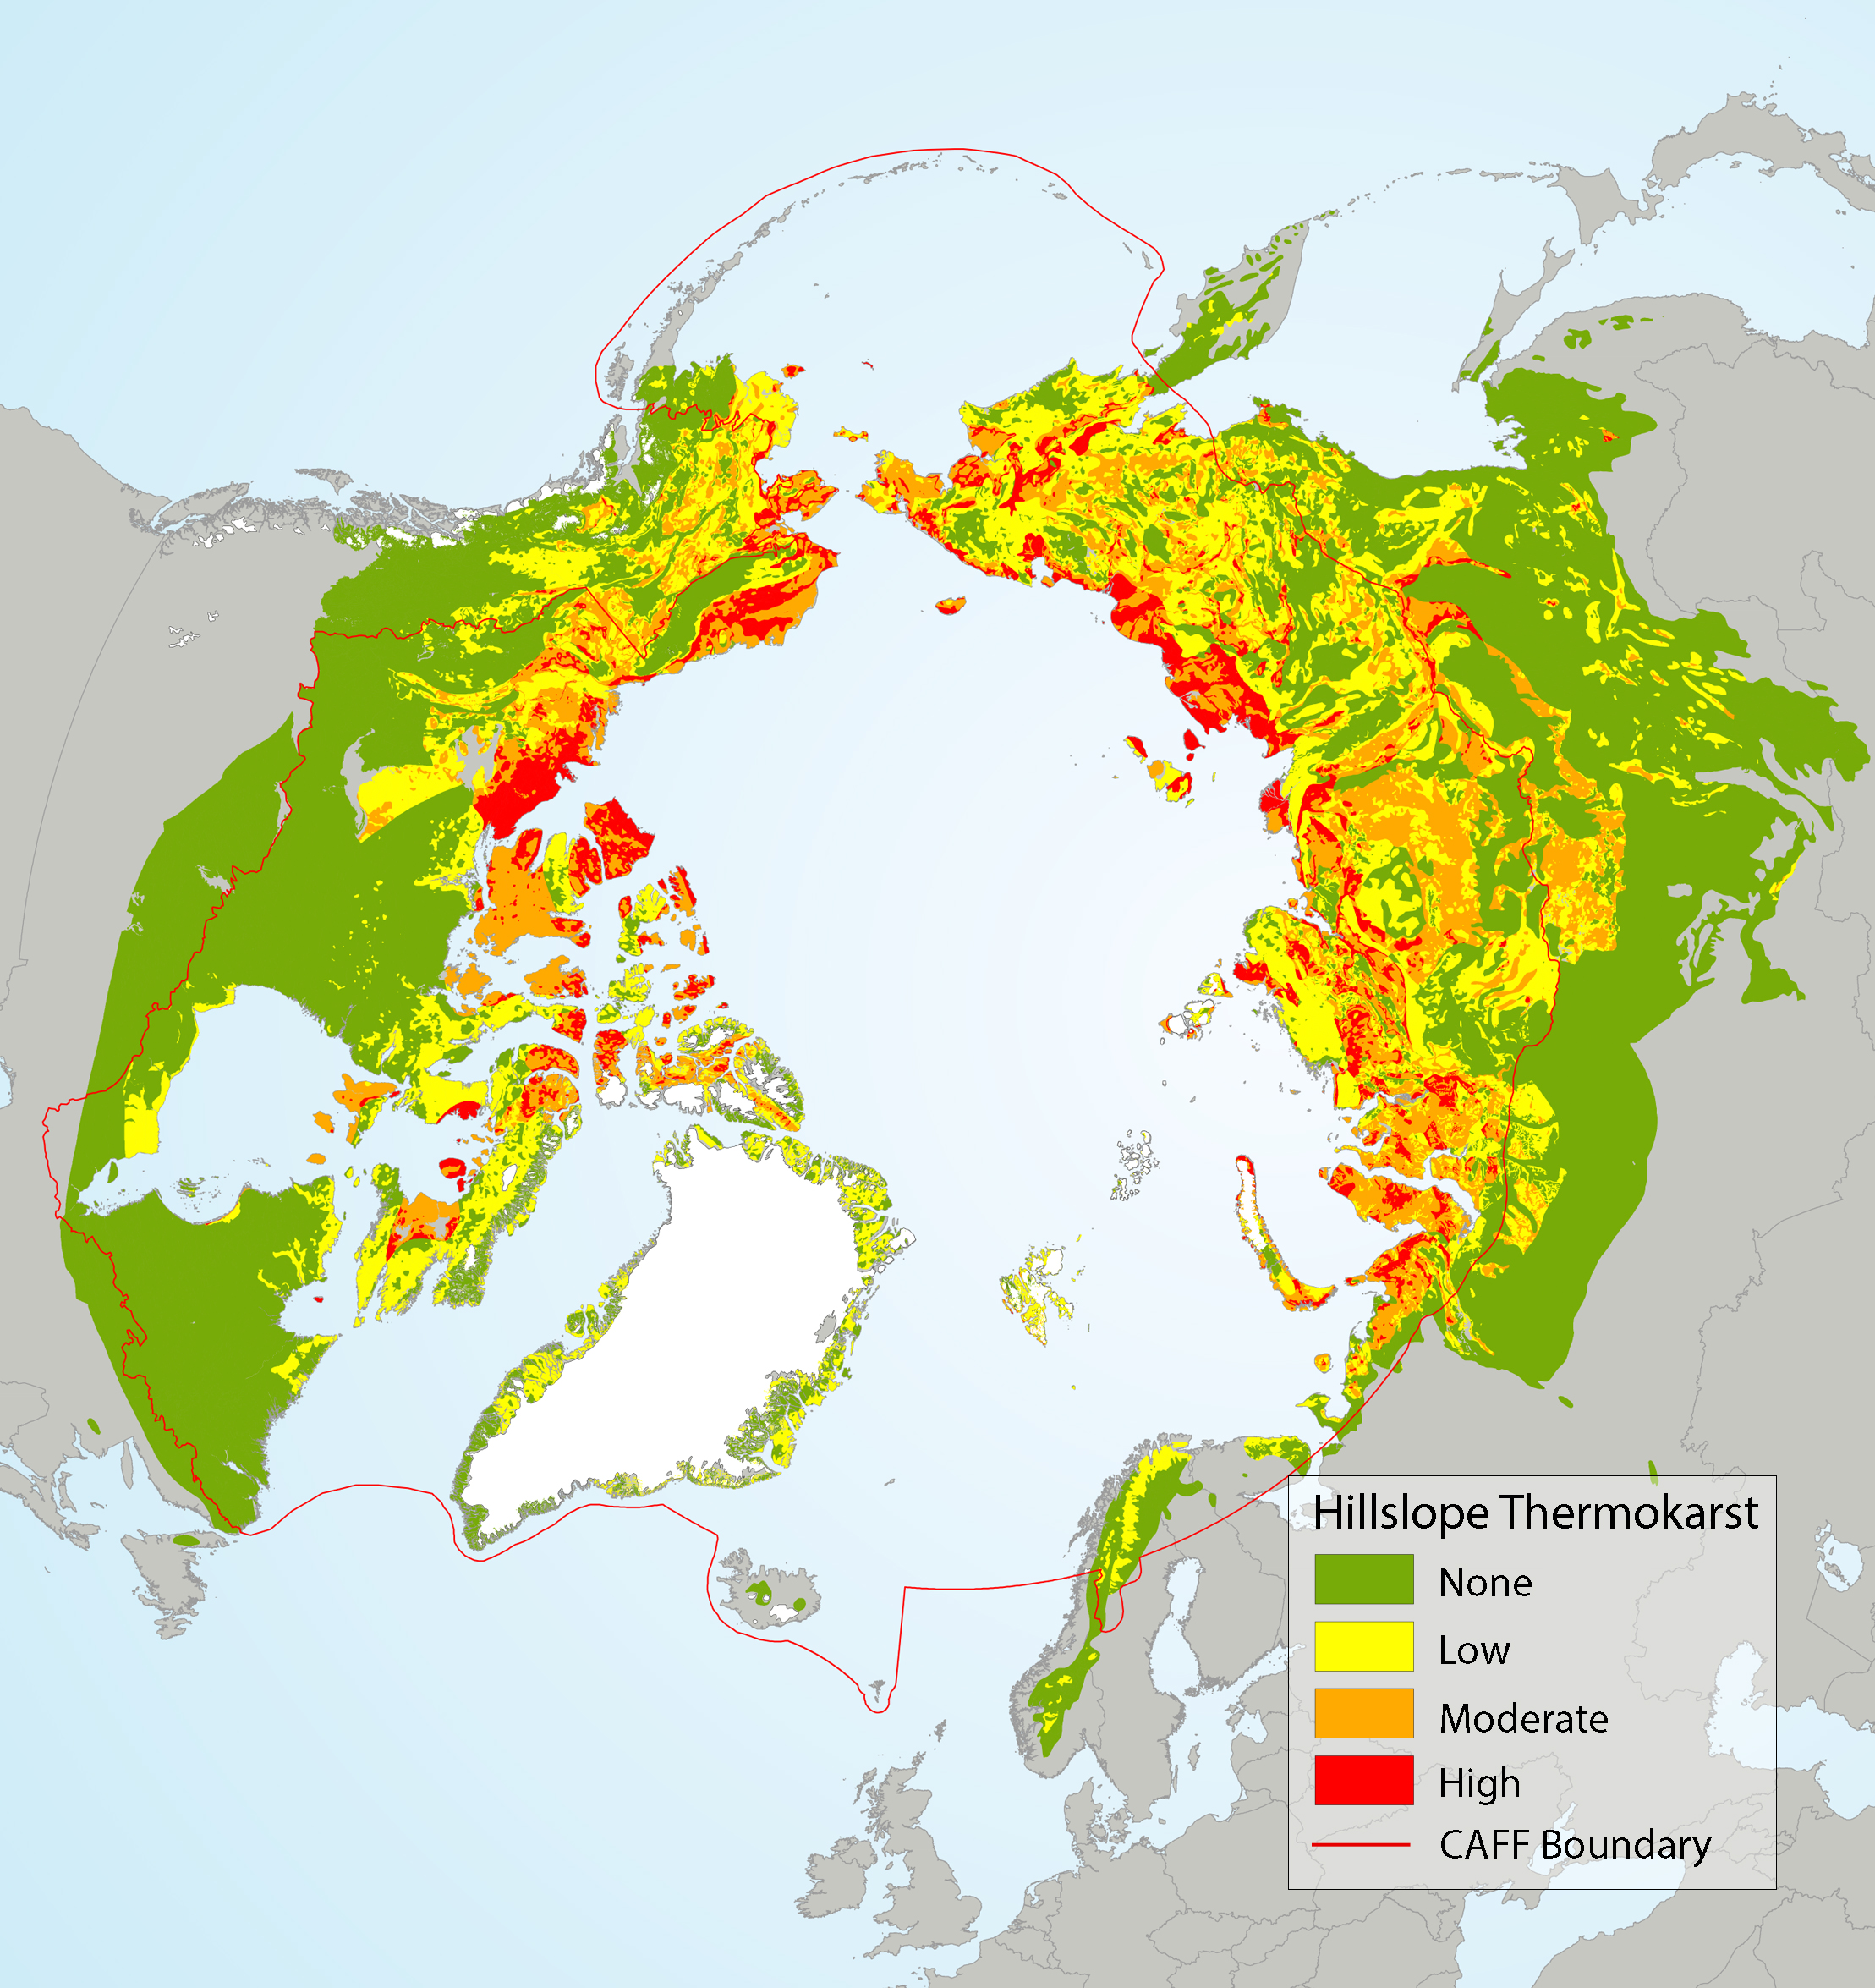
Spatial distribution of hillslope thermokarst across the circumpolar area, overlain with ecoregions used in the SAFBR analysis, showing no, low, moderate, and high thermokarst. Source for thermokarst layer: Olefeldt et al. (2016) State of the Arctic Freshwater Biodiversity Report - Chapter 4 - Page 90 - Figure 5-7
-
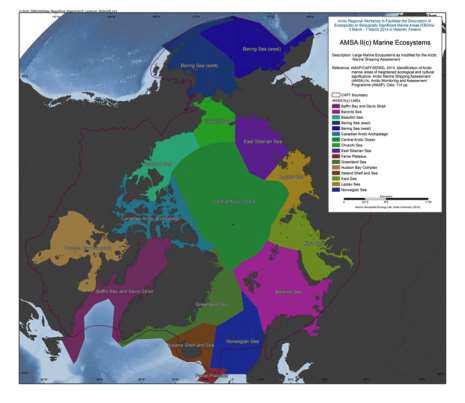
The Arctic Council’s 2009 Arctic Marine Shipping Assessment (AMSA) identified a number of recommendations to guide future action by the Arctic Council, Arctic States and others on current and future Arctic marine activity. Recommendation II C under the theme Protecting Arctic People and the Environment recommended: “That the Arctic states should identify areas of heightened ecological and cultural significance in light of changing climate conditions and increasing multiple marine use and, where appropriate, should encourage implementation of measures to protect these areas from the impacts of Arctic marine shipping, in coordination with all stakeholders and consistent with international law.” As a follow-up to the AMSA, the Arctic Council’s Arctic Monitoring and Assessment Programme (AMAP) and Conservation of Arctic Flora and Fauna (CAFF) working groups undertook to identify areas of heightened ecological significance, and the Sustainable Development Working Group (SDWG) undertook to identify areas of heightened cultural significance. The work to identify areas of heightened ecological significance builds on work conducted during the preparation of the AMAP (2007) Arctic Oil and Gas Assessment. Although it was initially intended that the identification of areas of heightened ecological and cultural significance would be addressed in a similar fashion, this proved difficult. The information available on areas of heightened cultural significance was inconsistent across the Arctic and contained gaps in data quality and coverage which could not be addressed within the framework of this assessment. The areas of heightened cultural significance are therefore addressed within a separate section of the report (Part B) and are not integrated with the information on areas of heightened ecological significance (Part A). In addition, Part B should be seen as instructive in that it illustrates where additional data collection and integration efforts are required, and therefore helps inform future efforts on identification of areas of heightened cultural significance. The results of this work provide the scientific basis for consideration of protective measures by Arctic states in accordance with AMSA recommendation IIc, including the need for specially designated Arctic marine areas as follow-up to AMSA recommendation IId. Reference: AMAP/CAFF/SDWG, 2013. Identification of Arctic marine areas of heightened ecological and cultural significance: Arctic Marine Shipping Assessment (AMSA) IIc. Arctic Monitoring and Assessment Programme (AMAP), Oslo. 114 pp. Data avaiable from: source: <a href="http://www.amap.no/documents/doc/Identification-of-Arctic-marine-areas-of-heightened-ecological-and-cultural-significance-Arctic-Marine-Shipping-Assessment-AMSA-IIc/869" target="_blank">Identification of Arctic marine areas of heightened ecological and cultural significance</a>
-
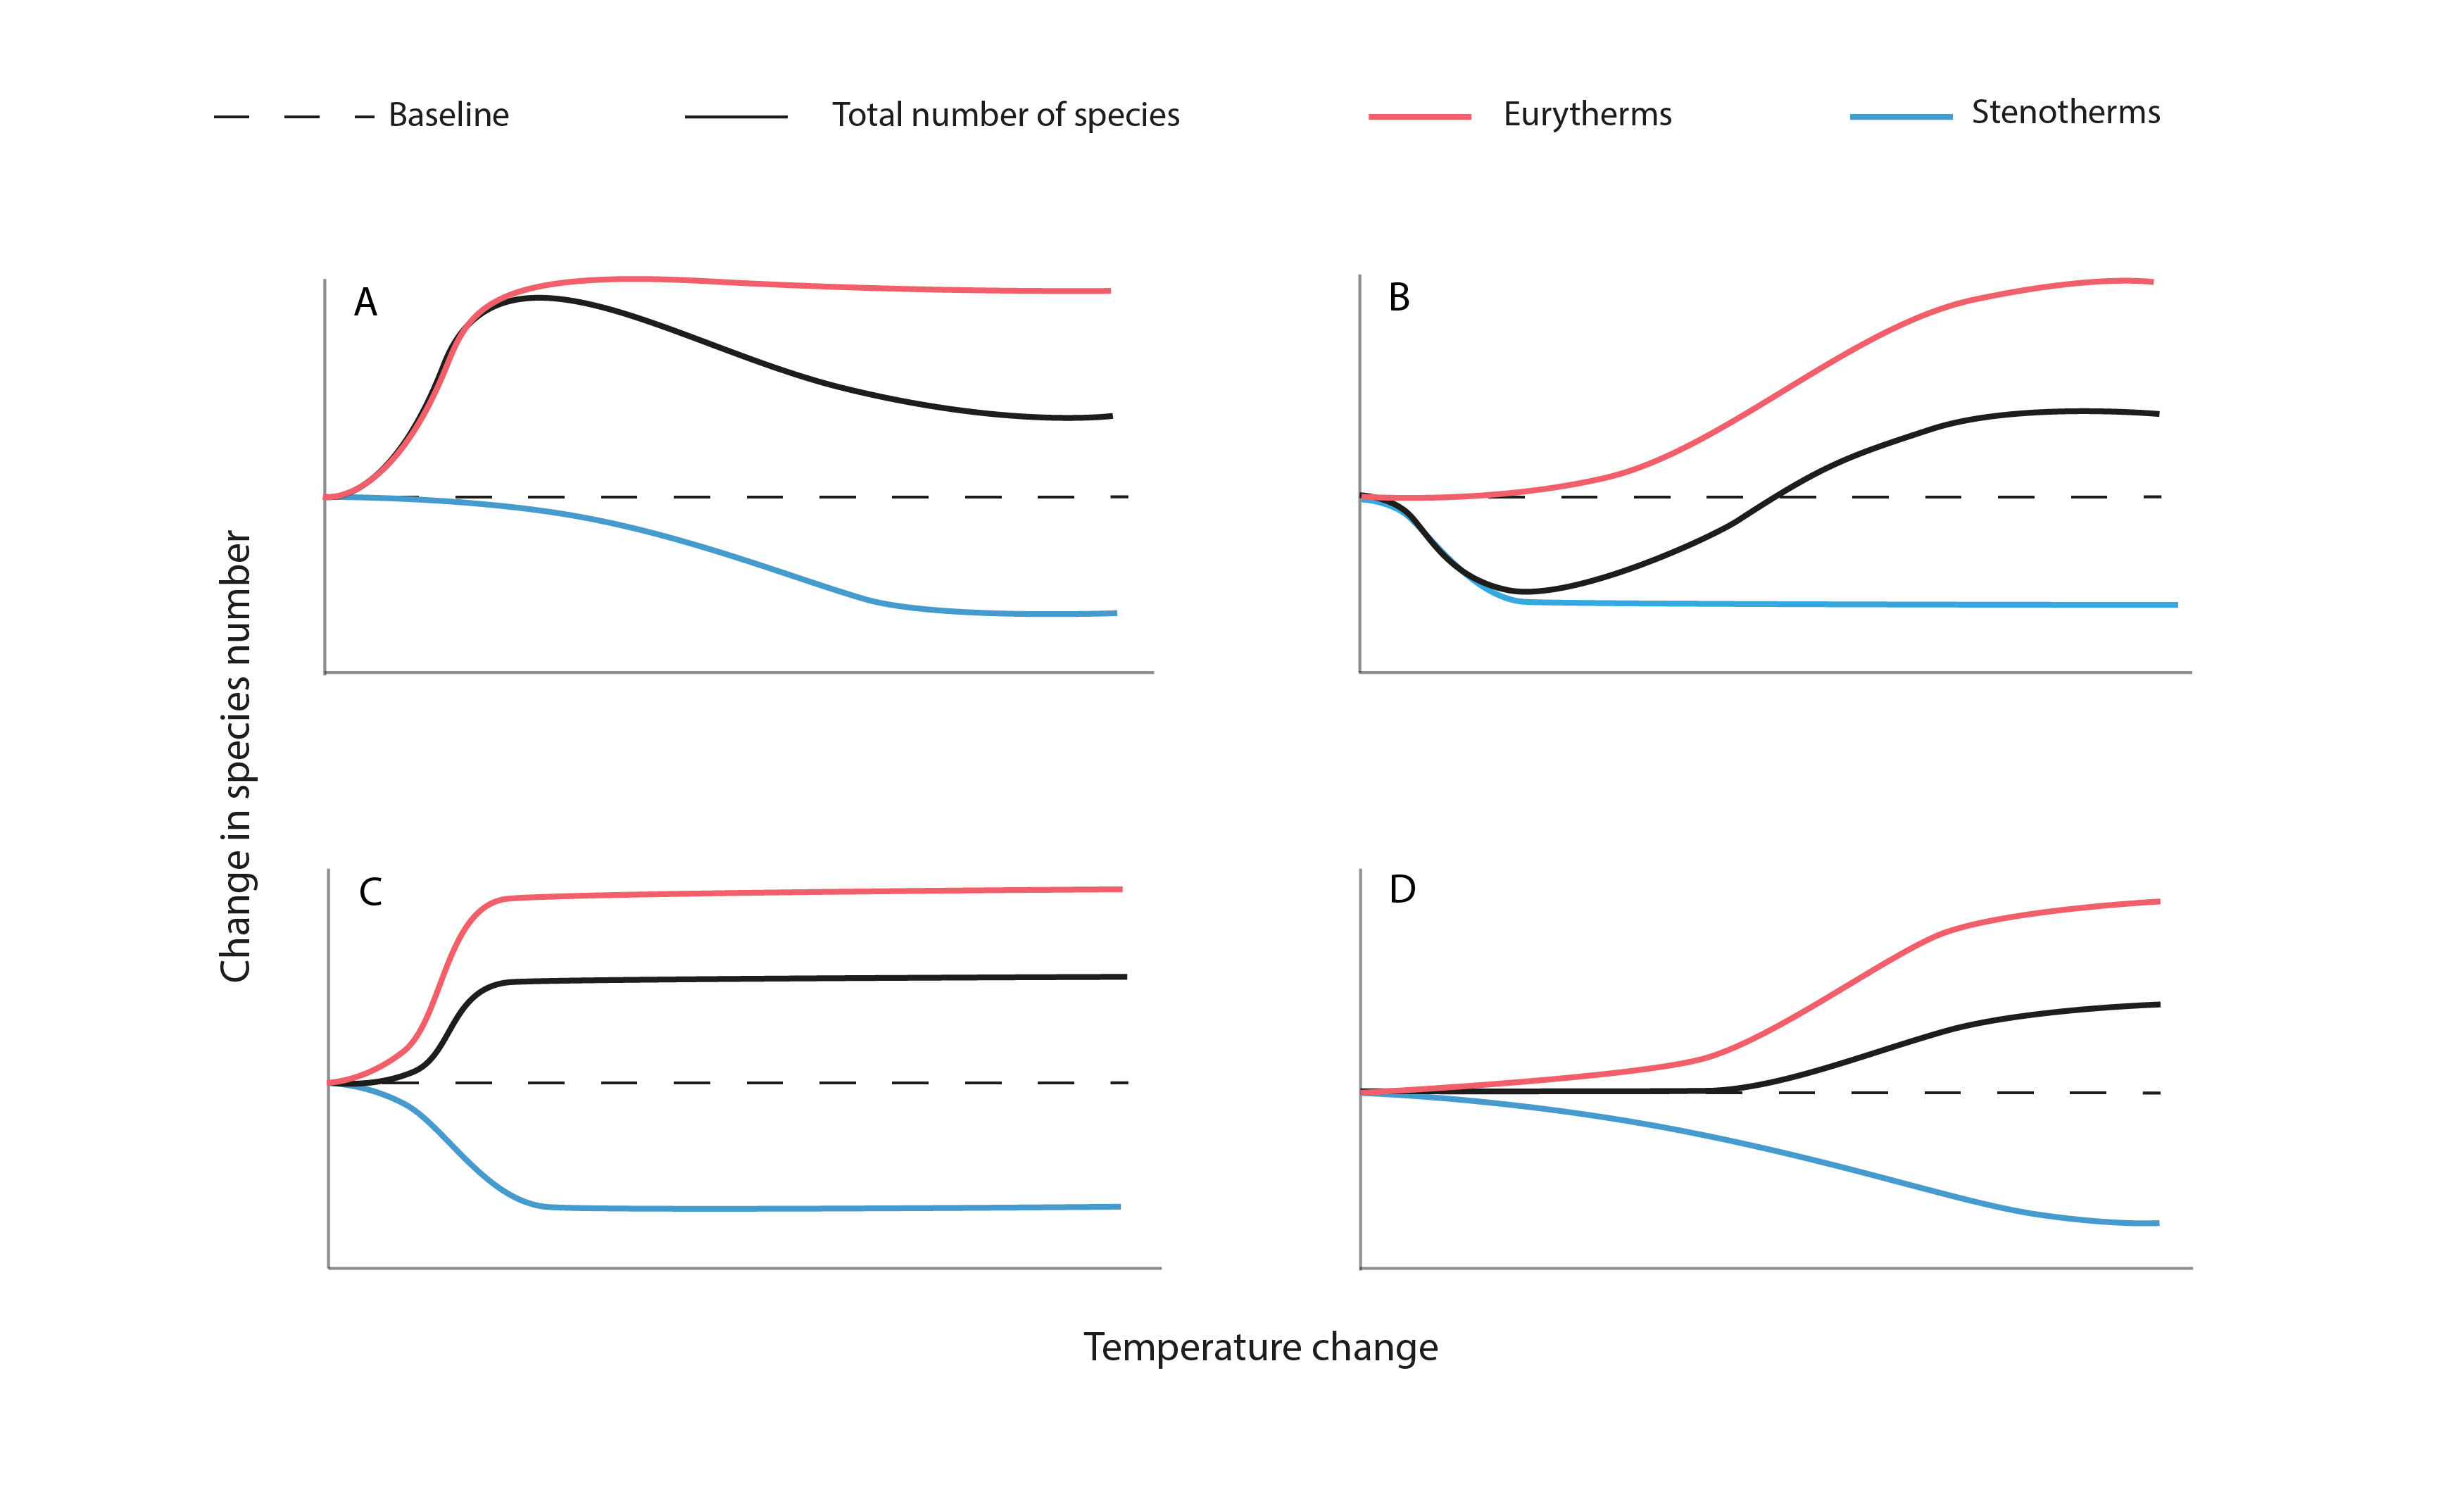
Figure 3-6. The hypothesized effects of rising mean water temperature on biodiversity (as total species number) of Arctic freshwater ecosystems. A pulsed increase in gamma biodiversity (a) results from the combination of high eurythermal invasion and establishment and low stenothermic loss with increasing water temperature. A pulsed decrease in gamma biodiversity (b) results from the combination of low eurythermal invasion and establishment and high stenothermic loss. Rapid increases (c) and slow increases (d) in species diversity occur, respectively, with high eurythermal invasion and establishment coupled with high stenothermic loss or low eurythermal invasion and establishment and low stenothermic loss as temperatures increase. For simplification, barriers to dispersal have been assumed to be limited in these models. State of the Arctic Freshwater Biodiversity Report - Chapter 3 - Page 23 - Figure 3-6
-

Trends in total abundance of moths and species richness, from two locations in Iceland, 1995–2016. Trends differ between locations. The solid and dashed straight lines represent linear regression lines which are significant or non-significant, respectively. Modified from Gillespie et al. 2020a. STATE OF THE ARCTIC TERRESTRIAL BIODIVERSITY REPORT - Chapter 3 - Page 41 - Figure 3.14
-
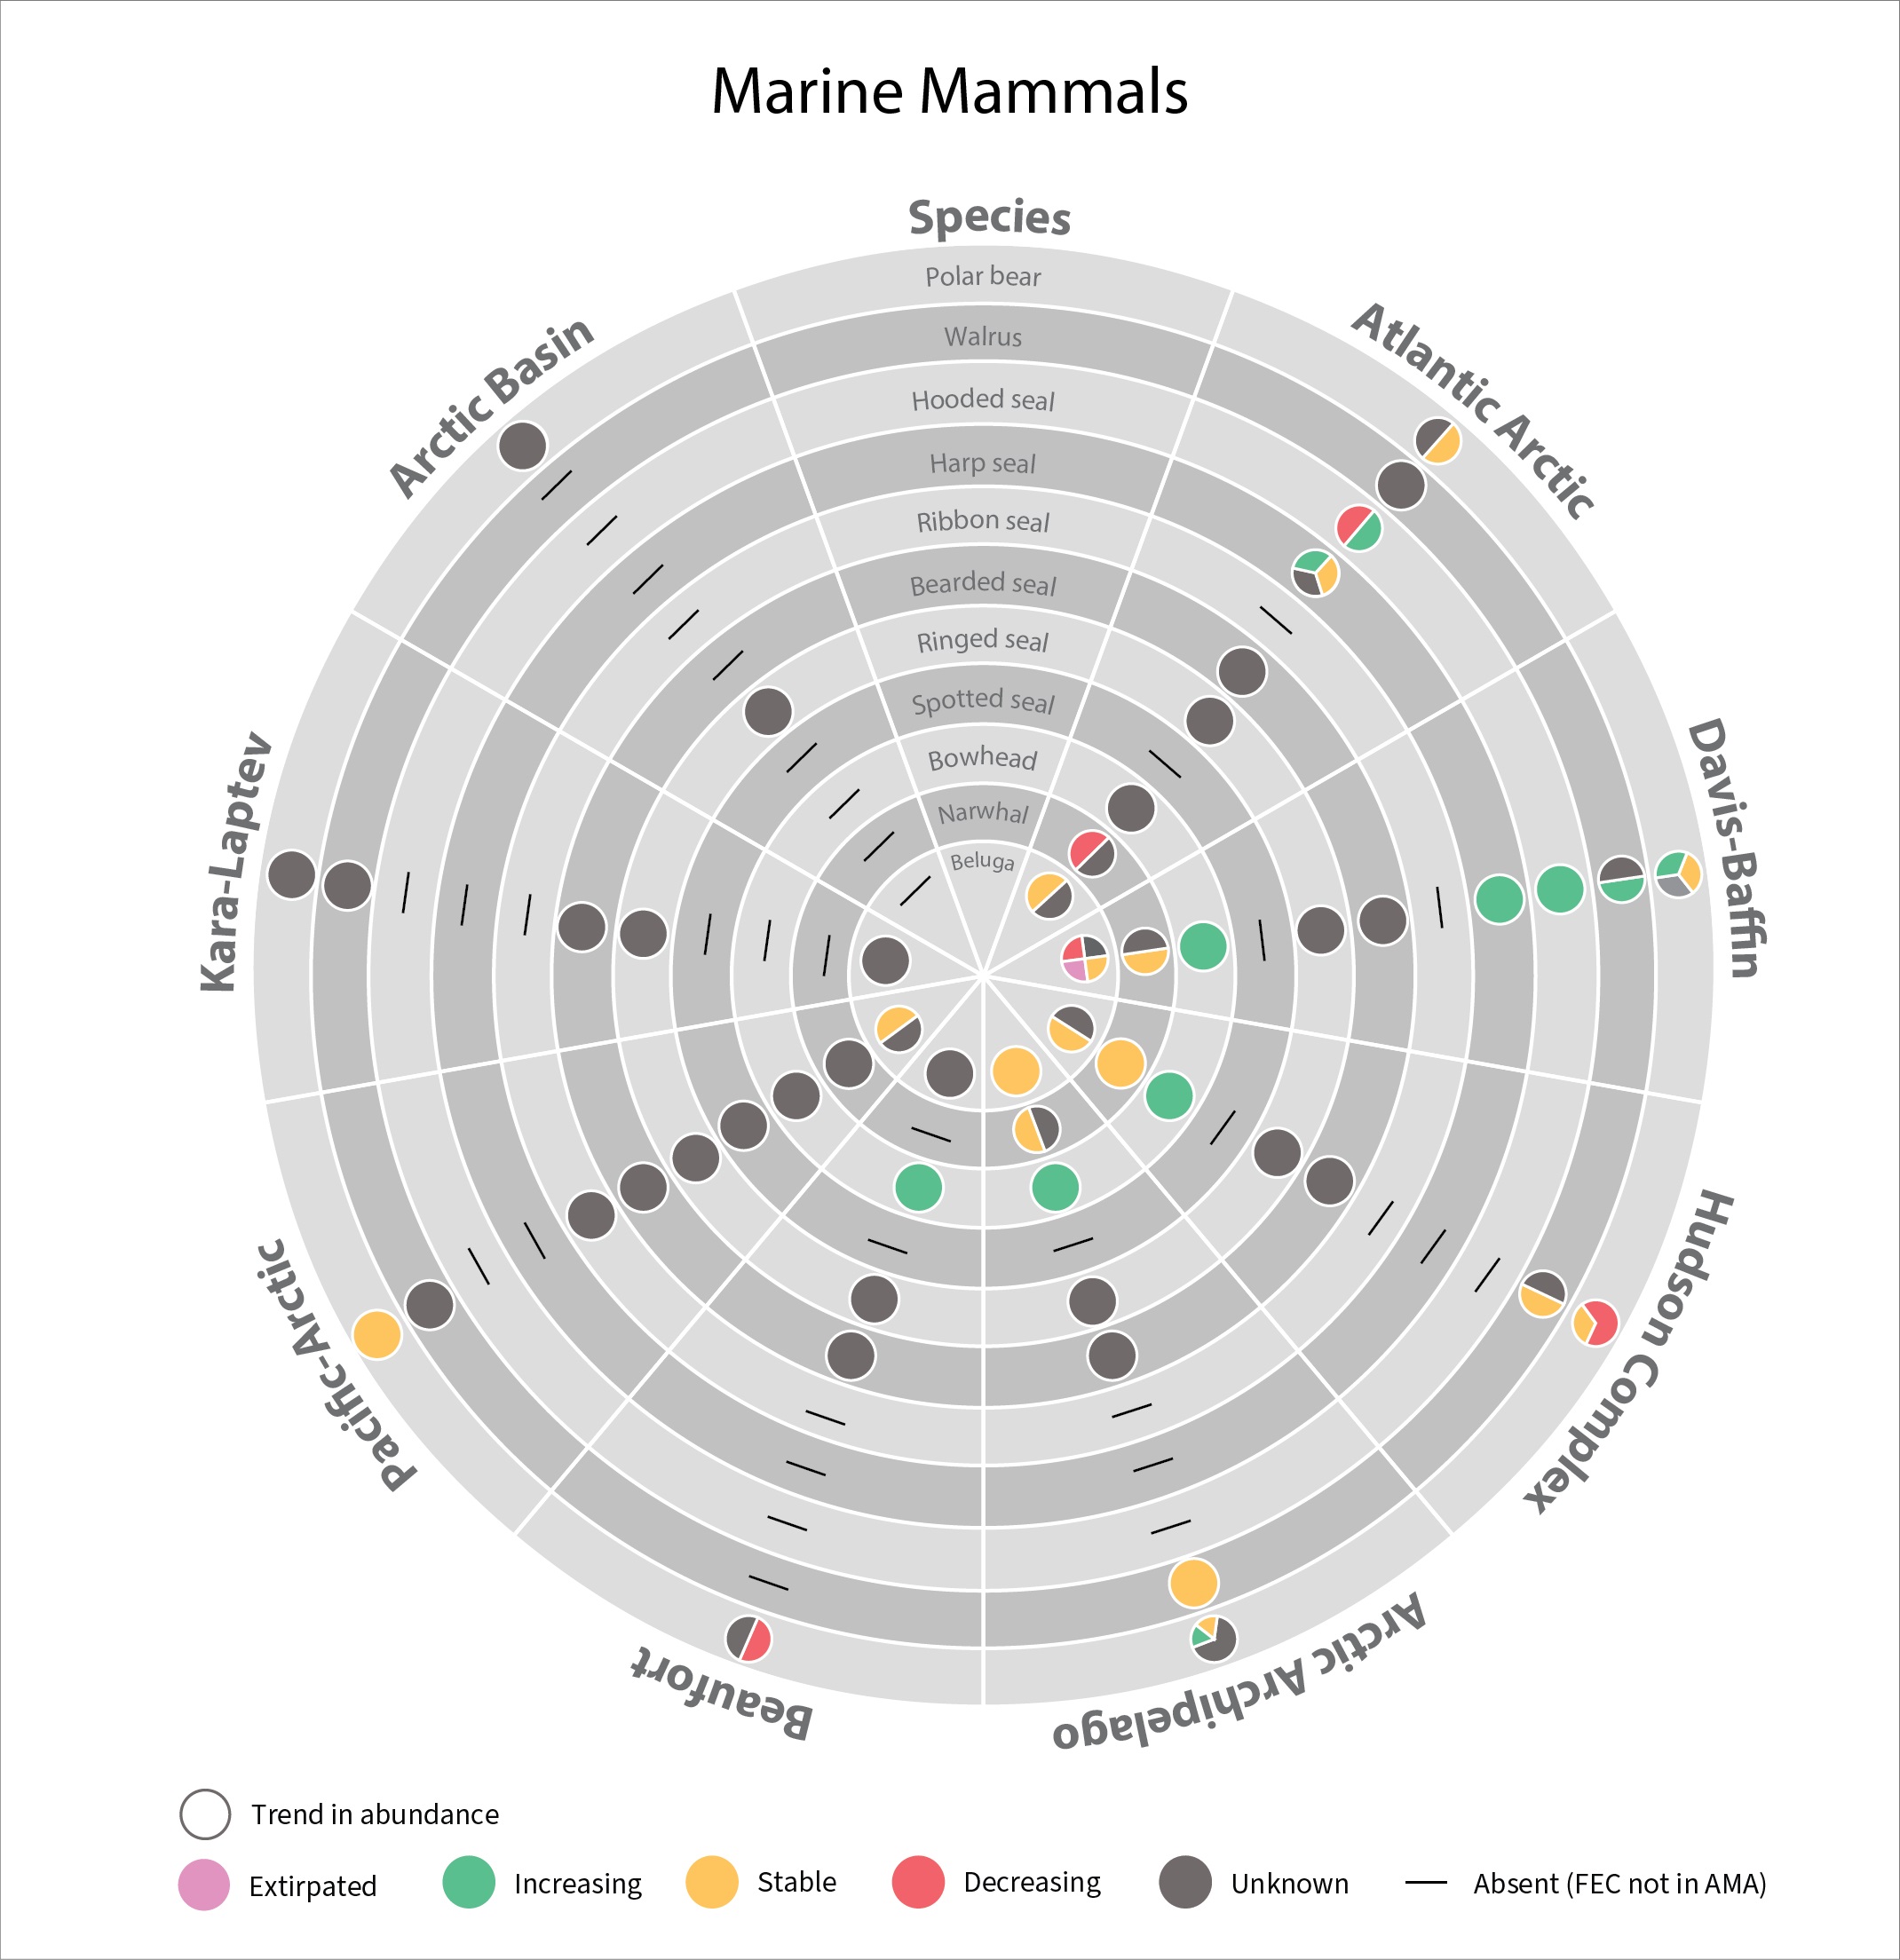
In 2017 the SAMBR synthesized data about biodiversity in Arctic marine ecosystems around the circumpolar Arctic.. SAMBR highlighted observed changes and relevant monitoring gaps. This 2021 update provides information on the status of marine mammals in the Arctic from 2015–2020: More detail can be found in the Marine Mammals 2021 Technical report. STATE OF THE ARCTIC MARINE BIODIVERSITY REPORT
-
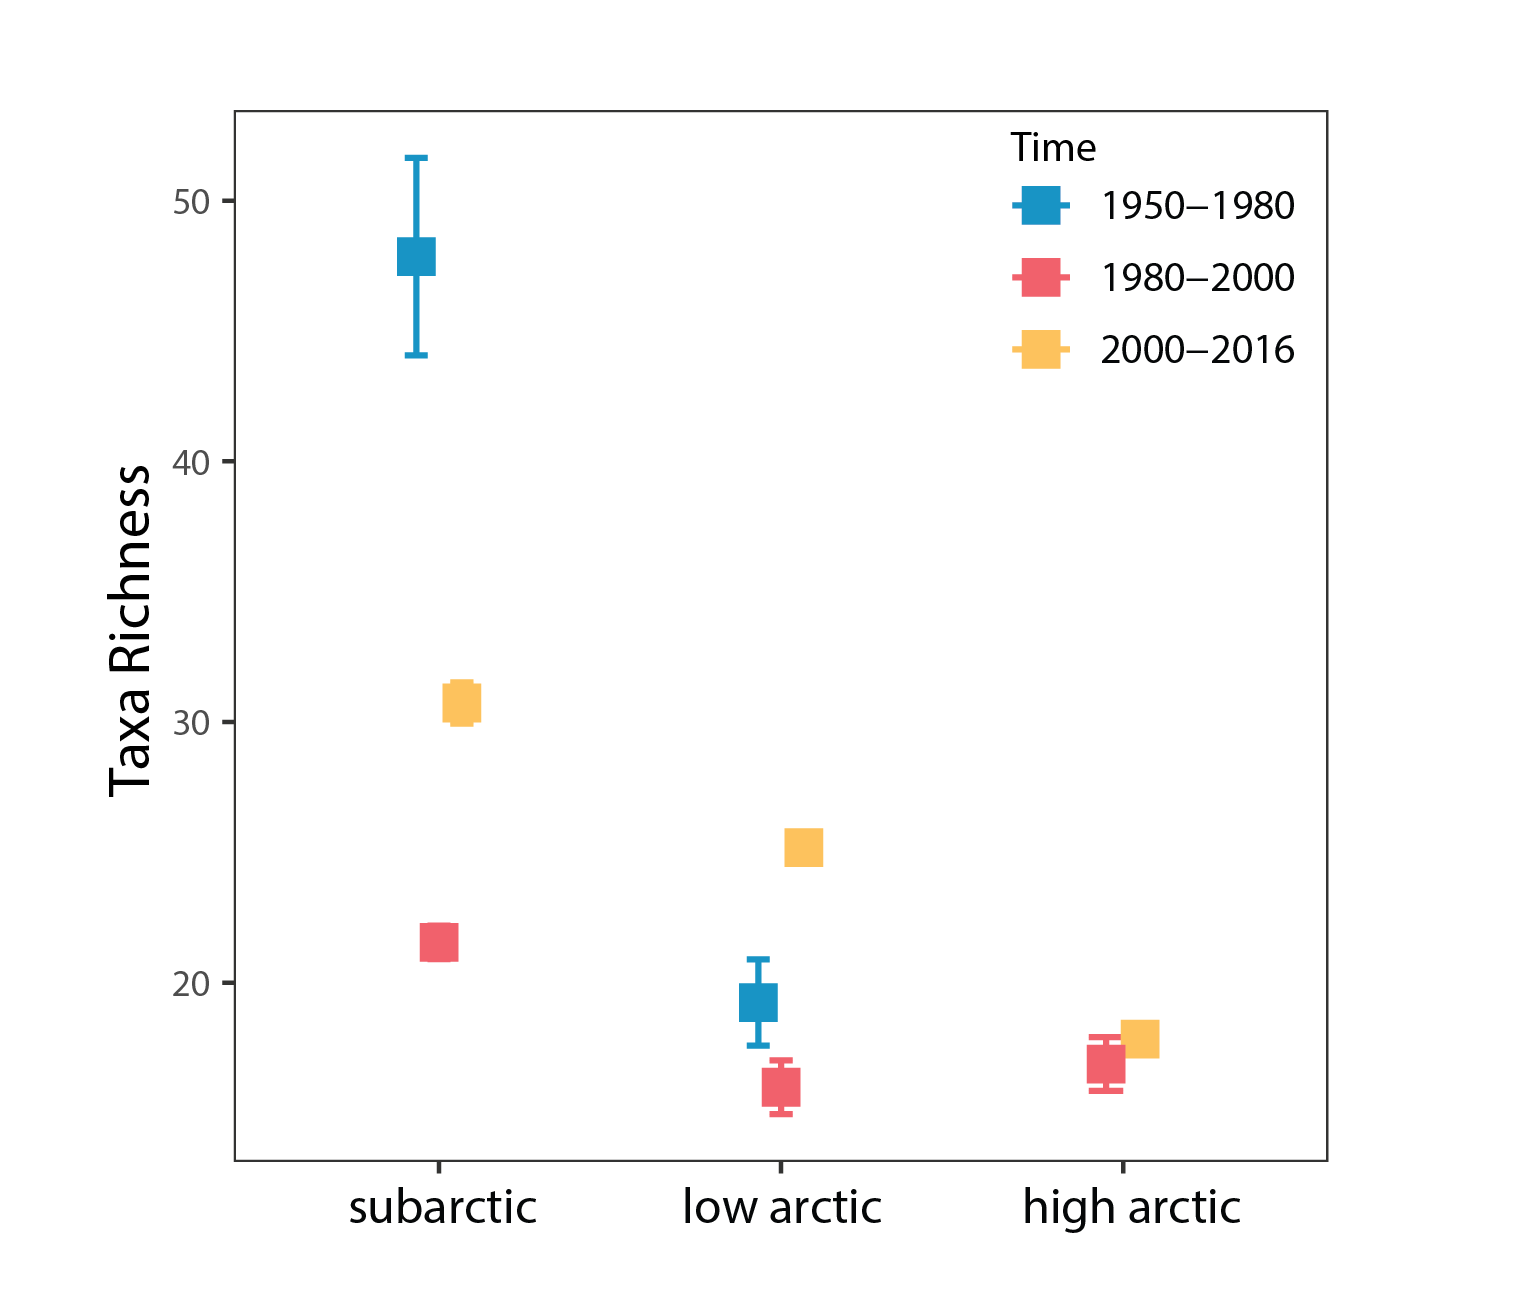
Phytoplankton species richness averaged by time periods ±SE in each Arctic region. State of the Arctic Freshwater Biodiversity Report - Chapter 4 - Page 49 - Figure 4-20
-
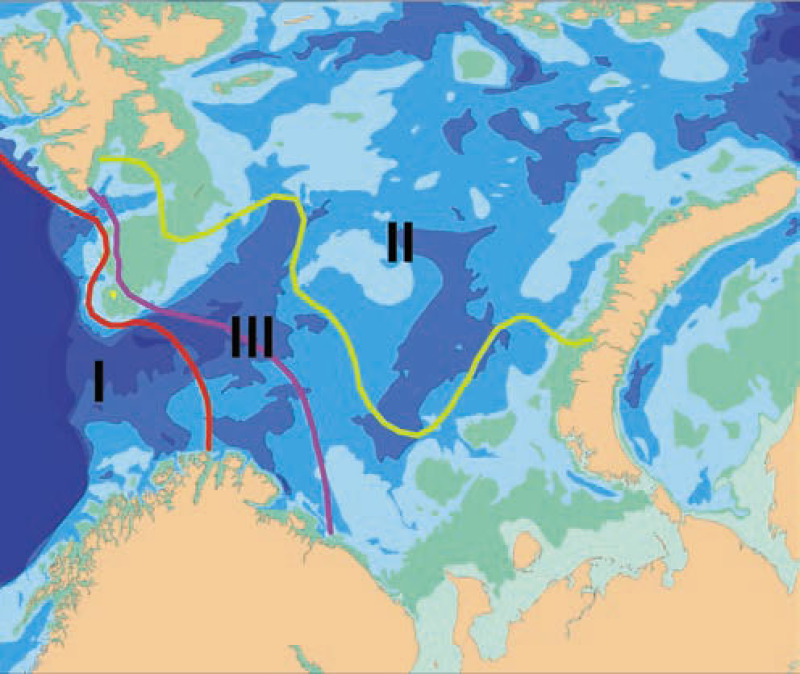
Biogeographic borders in the Barents Sea based on species distributions of bryozoans. Average position of the border with 50:50% of Atlantic boreal and Arctic species numbers is indicated by the pink line, and the red and green lines indicate the extreme positions of the border in cold and warm periods respectively. Area III between them is the transitional zone between the Atlantic boreal and the Arctic regions. Thus, area I always has > 50% Atlantic boreal species, and area II always > 50% Arctic species (after Denisenko 1990).
-
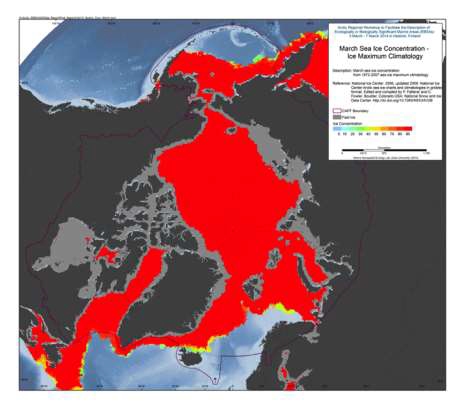
The U.S. National Ice Center (NIC) is an inter-agency sea ice analysis and forecasting center comprised of the Department of Commerce/NOAA, the Department of Defense/U.S. Navy, and the Department of Homeland Security/U.S. Coast Guard components. Since 1972, NIC has produced Arctic and Antarctic sea ice charts. This data set is comprised of Arctic sea ice concentration climatology derived from the NIC weekly or biweekly operational ice-chart time series. The charts used in the climatology are from 1972 through 2007; and the monthly climatology products are median, maximum, minimum, first quartile, and third quartile concentrations, as well as frequency of occurrence of ice at any concentration for the entire period of record as well as for 10-year and 5-year periods. NIC charts are produced through the analyses of available in situ, remote sensing, and model data sources. They are generated primarily for mission planning and safety of navigation. NIC charts generally show more ice than do passive microwave derived sea ice concentrations, particularly in the summer when passive microwave algorithms tend to underestimate ice concentration. The record of sea ice concentration from the NIC series is believed to be more accurate than that from passive microwave sensors, especially from the mid-1990s on (see references at the end of this documentation), but it lacks the consistency of some passive microwave time series. Source: <a href="http://nsidc.org/data/G02172" target="_blank">NSIDC</a> Reference: National Ice Center. 2006, updated 2009. National Ice Center Arctic sea ice charts and climatologies in gridded format. Edited and compiled by F. Fetterer and C. Fowler. Boulder, Colorado USA: National Snow and Ice Data Center. Source: <a href="http://nsidc.org/data/G02172" target="_blank">NSIDC</a>
-
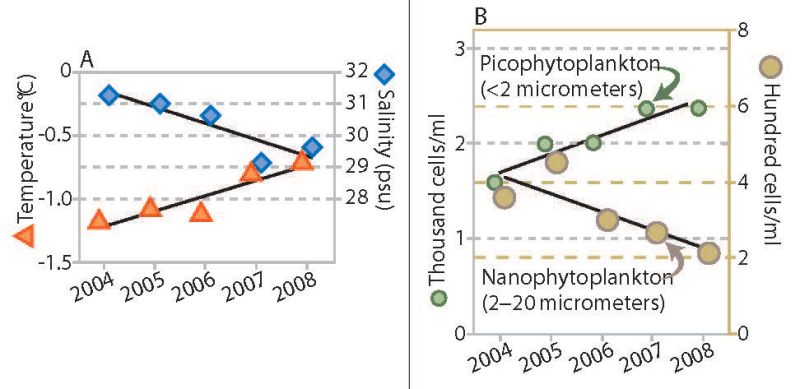
Trends in water temperature and salinity (A) and density of phytoplankton of two size ranges (B), Canada Basin, 2004 to 2008. Stratification of the water column increased throughout the Canada Basin over a recent five-year period, accompanied by a change in phytoplankton communities. The upper ocean layer showed trends of increased temperature and decreased salinity (Figure 18A), which combine to make this layer progressively less dense. The layer of water below this did not change in density over this period (not shown). The larger size class of phytoplankton (which would include diatoms) decreased in abundance, while the smaller types of plankton increased (Figure 18B). In addition to the trends shown, nutrient content in the upper ocean water layer decreased. Abundance of microbes (bacteria and similar organisms) that subsist on organic matter increased. Total phytoplankton biomass, however, remained unchanged. If this trend towards smaller species of phytoplankton and microbes is sustained, it may lead to reduced production of zooplankton, an impact that would be transmitted through the food web to birds, fish and mammals. Published in the Life Linked to Ice released in 2013, page 30. Life Linked to Ice: A guide to sea-ice-associated biodiversity in this time of rapid change. CAFF Assessment Series No. 10. Conservation of Arctic Flora and Fauna, Iceland. ISBN: 978-9935-431-25-7.