 Arctic Biodiversity Data Service - ABDS Catalog
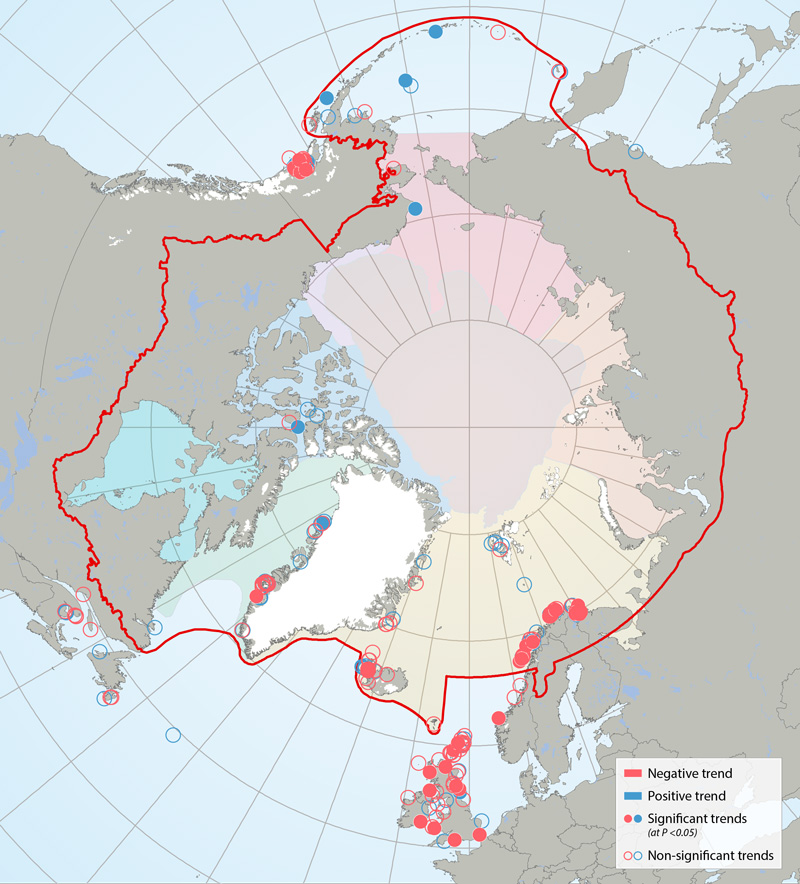
SAMBR - Trends in kittiwake colonies 2001-2010
Trends in kittiwake colonies 2001-2010, based on linear regression with year as the explanatory variable. Slope of the regression is red = negative trend, blue = positive trend; shaded circle = significant trend (at p<0.05), open circle = non-significant trend. Non-significant deviation from zero could imply a stable population, but in some cases was due to low sample size and low power. Provided with permission from Descamps et al. (in prep).
STATE OF THE ARCTIC MARINE BIODIVERSITY REPORT - <a href=" https://arcticbiodiversity.is/findings/seabirds" target="_blank">Chapter 3</a> - Page 135 - Figure 3.5.3
This figure is compiled from data from researchers working throughout circumpolar regions, primarily members of the Circumpolar Seabird Group, an EN of CAFF/seabirds. Dr. Sebastien Decamps conducted the analysis and produced the original figure; the full results will be available in an article in prep titled: “Descamps et al. in prep. Circumpolar dynamics of black-legged kittiwakes track large-scale environmental shifts and oceans' warming rate.” [expected submission spring 2016].
Colony population trends were analyzed using a linear regression with the year as explanatory variable. Based on slope of the regression (which cannot be exactly 0) colonies are either Declining (Slope of the regression <0) or Increasing (Slope of the regression >0). (Colonies may have had a negative but not significant slope, and could be stable but for some others, the slope is not significant due to small sample size / low power; thus we cannot say that all colonies with a non- significant slope are stable. The threshold was put at 5% to assess the significance of the trend.
Simple
- Date (Publication)
- 2017-05
- Credit
-
Sebastien Descamps,
Norwegian Polar Institute
Fram Centre
Postbox 6606 Langnes
NO-9296 Tromsø
and members of Circumpolar Seabird Group
- Status
- Completed
http://caff.is
- Hours of service
-
08:00 - 16:00 GMT
- Maintenance and update frequency
- Unknown
- Theme
-
-
CHAPTER3
-
Marine
-
Circumpolar Trends
-
black-legged kittiwake
-
- Place
-
-
Seabirds
-
- Access constraints
- Copyright
- Use constraints
- otherRestictions
- Spatial representation type
- Vector
- Language
- English
- Character set
- UTF8
- Topic category
-
- Oceans
- Begin date
- 2001-05-01
- End date
- 2010-09-01
))
- Supplemental Information
-
You can customize the template to suit your needs. You can add
and remove fields and fill out default information (e.g. contact details).
Fields you can not change in the default view may be accessible in the more
comprehensive (and more complex) advanced view. You can even use the XML editor
to create custom structures, but they have to be validated by the system, so
know what you do :-)
- Reference system identifier
- WGS 1984
- Protocol
-
WWW:LINK-1.0-http--link
- Protocol
-
OGC:WMS-1.1.1-http-get-map
- OnLine resource
-
fig3.5.3.png
(
WWW:DOWNLOAD-1.0-http--download
)
Image - Figure 3.5.3
- OnLine resource
-
Trends.zip
(
WWW:DOWNLOAD-1.0-http--download
)
Shape file
- OnLine resource
-
Fig. 3. Data_BLKI Colony Trends_Nov2015_from S.Descamps, May 2016.xlsx
(
WWW:DOWNLOAD-1.0-http--download
)
Excel data file
- OnLine resource
- C3_05f3_trends ( OGC:WMS-1.3.0-http-get-capabilities )
- OnLine resource
-
C3_05f3_trends_v2
(
OGC:WMS-1.3.0-http-get-capabilities
)
C3_05f3_trends
- Hierarchy level
- Dataset
Conformance result
- Date (Publication)
- File identifier
- 3abd7add-152d-44bf-86f4-41a010cc7480 XML
- Metadata language
- English
- Character set
- UTF8
- Date stamp
- 2024-01-10T10:20:39
- Metadata standard name
-
ISO 19115:2003/19139
- Metadata standard version
-
1.0
Overviews
Spatial extent
Provided by
