 Arctic Biodiversity Data Service - ABDS Catalog
Orthoimagery
Type of resources
Available actions
Keywords
Contact for the resource
Provided by
Years
Formats
Update frequencies
-
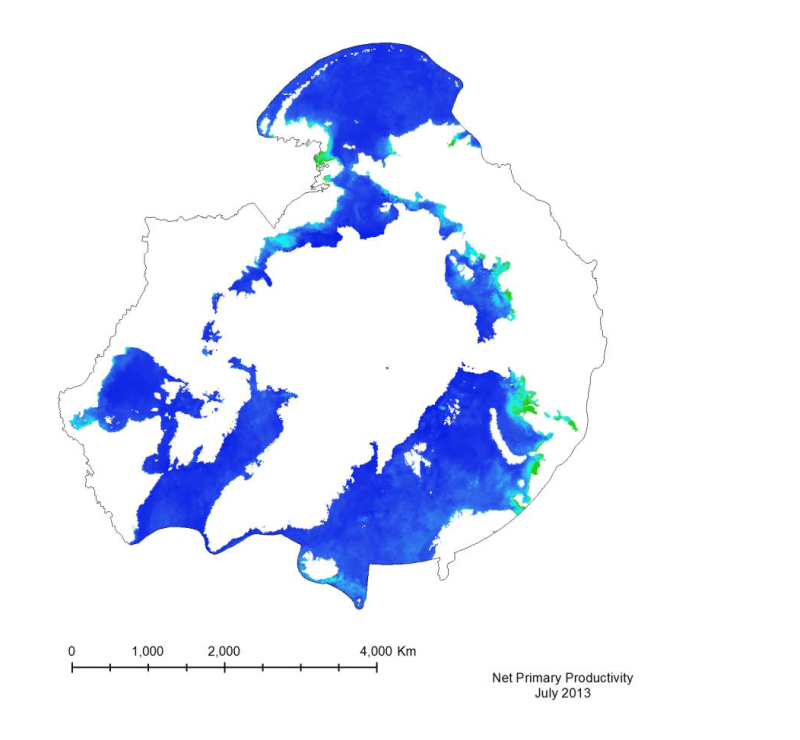
Marine primary productivity is not available from the NASA Ocean Color website. Currently the best product available for marine primary productivity is available through Oregon State University’s Ocean Productivity Project. A monthly global Net Primary Productivity product at 9 km spatial resolution has been selected for this analysis. The algorithm used to create the primary productivity is a Vertically Generalized Production Model (VGPM) created by Behrenfeld and Falkowski (1997). It is a “chlorophyll-based” model that estimates net primary production from chlorophyll using a temperature-dependent description of chlorophyll photosynthetic efficiency (O’Malley 2010). Inputs to the function are chlorophyll, available light, and photosynthetic efficiency.
-
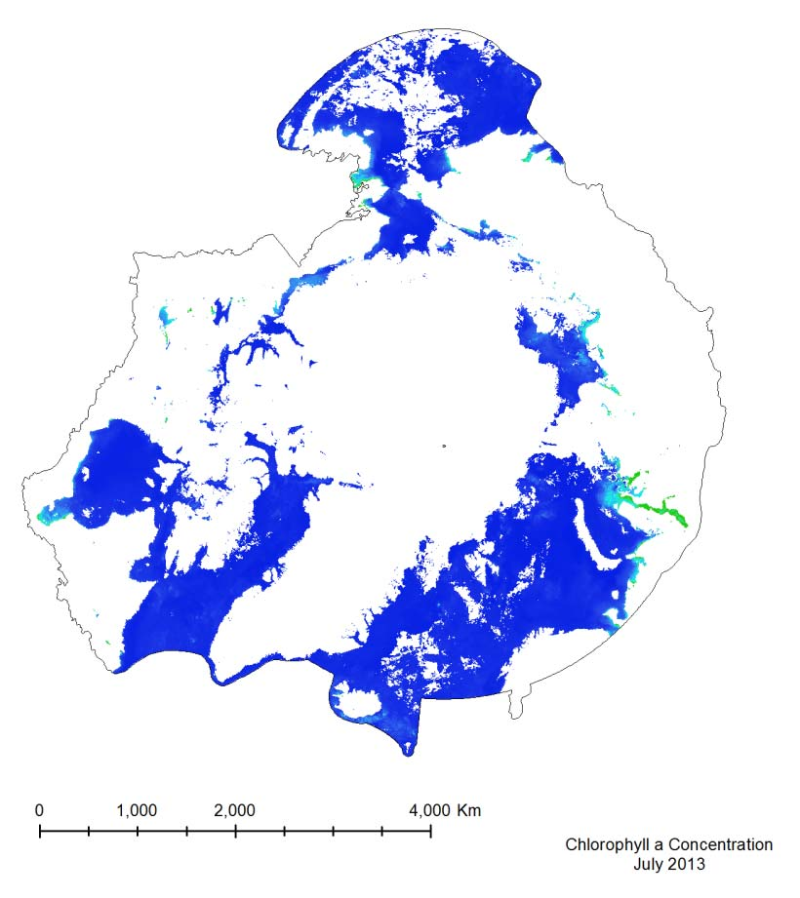
The MODIS marine chlorophyll a product provided, similar to SST, is a 4 km global monthly composite based on smaller resolution daily imagery compiled by NASA. The imagery is reliant on clear ocean (free of clouds and ice) so only months from March to October have been provided, as the chlorophyll levels in the Arctic diminish during the winter months, when sea ice is prevalent. The marine chlorophyll a is measured in mg/m3
-
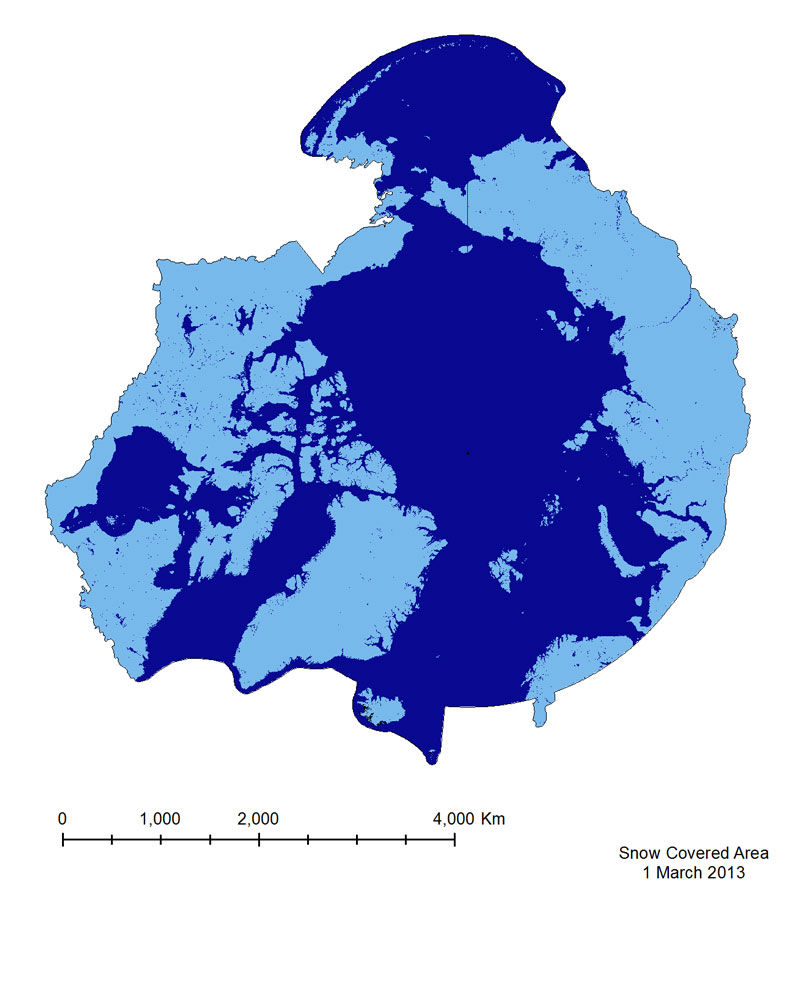
The Snow Covered Area product is based on a Normalized Difference Snow Index(NDSI), which is similar to NDVI, but exploits different bands in the equation (Equation 3),namely Green (Band 4) and Short Wavelength Near-infrared (SWNIR, Band 6). It isimportant to note that the Band 6 sensor on MODIS Aqua malfunctioned shortly after launch,so Snow Covered Area from the Aqua sensor is calculated using Bands 3 and 7. This mayintroduce errors in identifying snow in vegetated areas, as the use of Band 7 results in falsesnow detection. For this reason the MODIS Terra product has been provided for the CAFF-system.
-
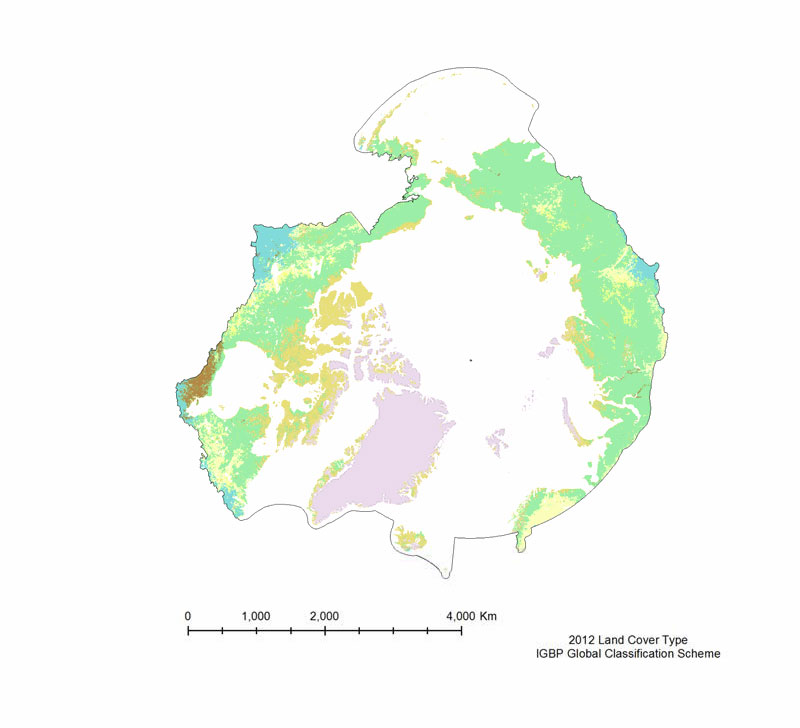
The MODIS Land Cover Type product is created yearly using three landclassification schemes; the International Geosphere Biosphere Programme (IGBP)classification scheme, the Univertiy of Maryland (UMD) classification scheme, and aMODIS-derived Leaf Area Index /Fraction of Photosynthetically Active Radiation(LAI/fPAR) classification scheme (Table 3). The International Geosphere Biosphere Programme (IGBP) identifies seventeenland cover classes, including eleven natural vegetation classes, three non-vegetated landclasses, and three developed land classes. The product provided is derived using the samealgorithm as the 500 m Land Cover Type (MOD12Q1), but is on a 0.05° Climate Model Grid(CMG), that has been clipped to the pan-Arctic extent. The UMD classification scheme issimilar to the IGBP classification scheme, but it excludes the Permanent wetlands,Cropland/Natural vegetation mosaic, and the Snow and ice classes. The LAI/fPARclassification scheme is the smallest of the three, and focuses on forest structure; it only haseleven classes. All three land cover classification schemes are provided, but the IGBPclassification scheme is the most amenable to the Pan-Arctic region.
-
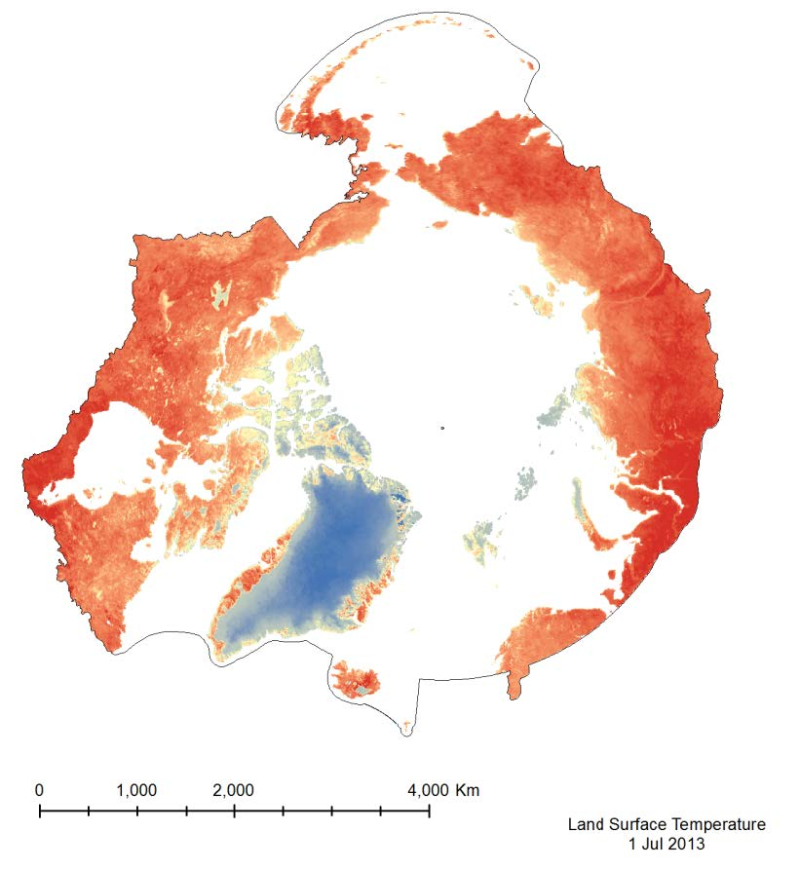
The MODIS Land Surface Temperature (LST) product provided is a monthlycomposite configured on a 0.05° Climate Model Grid (CMG). It includes both daytime andnighttime surface temperatures, taken at 11 um and 4 um (night). This product has beenscaled. To convert the raster values to a Kelvin temperature scale, multiply by a factor of 0.02.
-
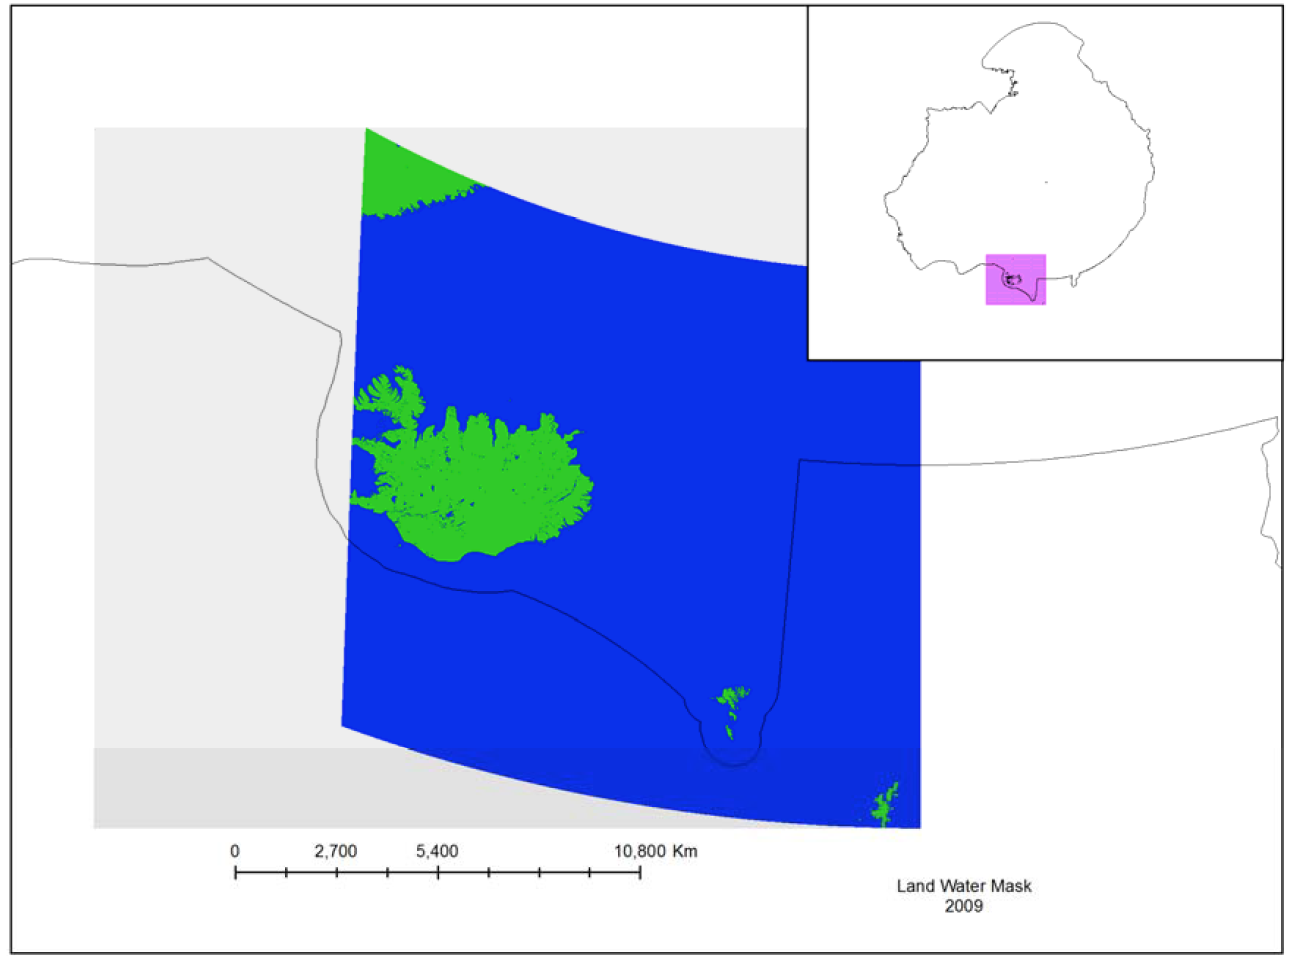
The MODIS Land Water Mask is created from MODIS 250 m imagery incombination with Shuttle Radar Topography Mission (SRTM) Water Body Data (SWBD) tocreate a global map of surface water at 250 m spatial resolution. Currently, only one mapexists, created in 2009 by Carroll et al. (2009). Because only one MODIS-based map exists,an analysis of surface water change is not possible at this time.