 Arctic Biodiversity Data Service - ABDS Catalog
Phytoplankton
Type of resources
Available actions
Topics
Keywords
Contact for the resource
Provided by
Representation types
Update frequencies
status
-

Figure 4 17 Results of circumpolar assessment of lake phytoplankton,(a) the location of phytoplankton stations, underlain by circumpolar ecoregions; (b) ecoregions with many phytoplankton stations, colored on the basis of alpha diversity rarefied to 35 stations; (c) all ecoregions with phytoplankton stations, colored on the basis of alpha diversity rarefied to 10 stations; (d) ecoregions with at least two stations in a hydrobasin, colored on the basis of the dominant component of beta diversity (species turnover, nestedness, approximately equal contribution, or no diversity) when averaged across hydrobasins in each ecoregion. State of the Arctic Freshwater Biodiversity Report - Chapter 4 - Page 56 - Figure 4-17
-
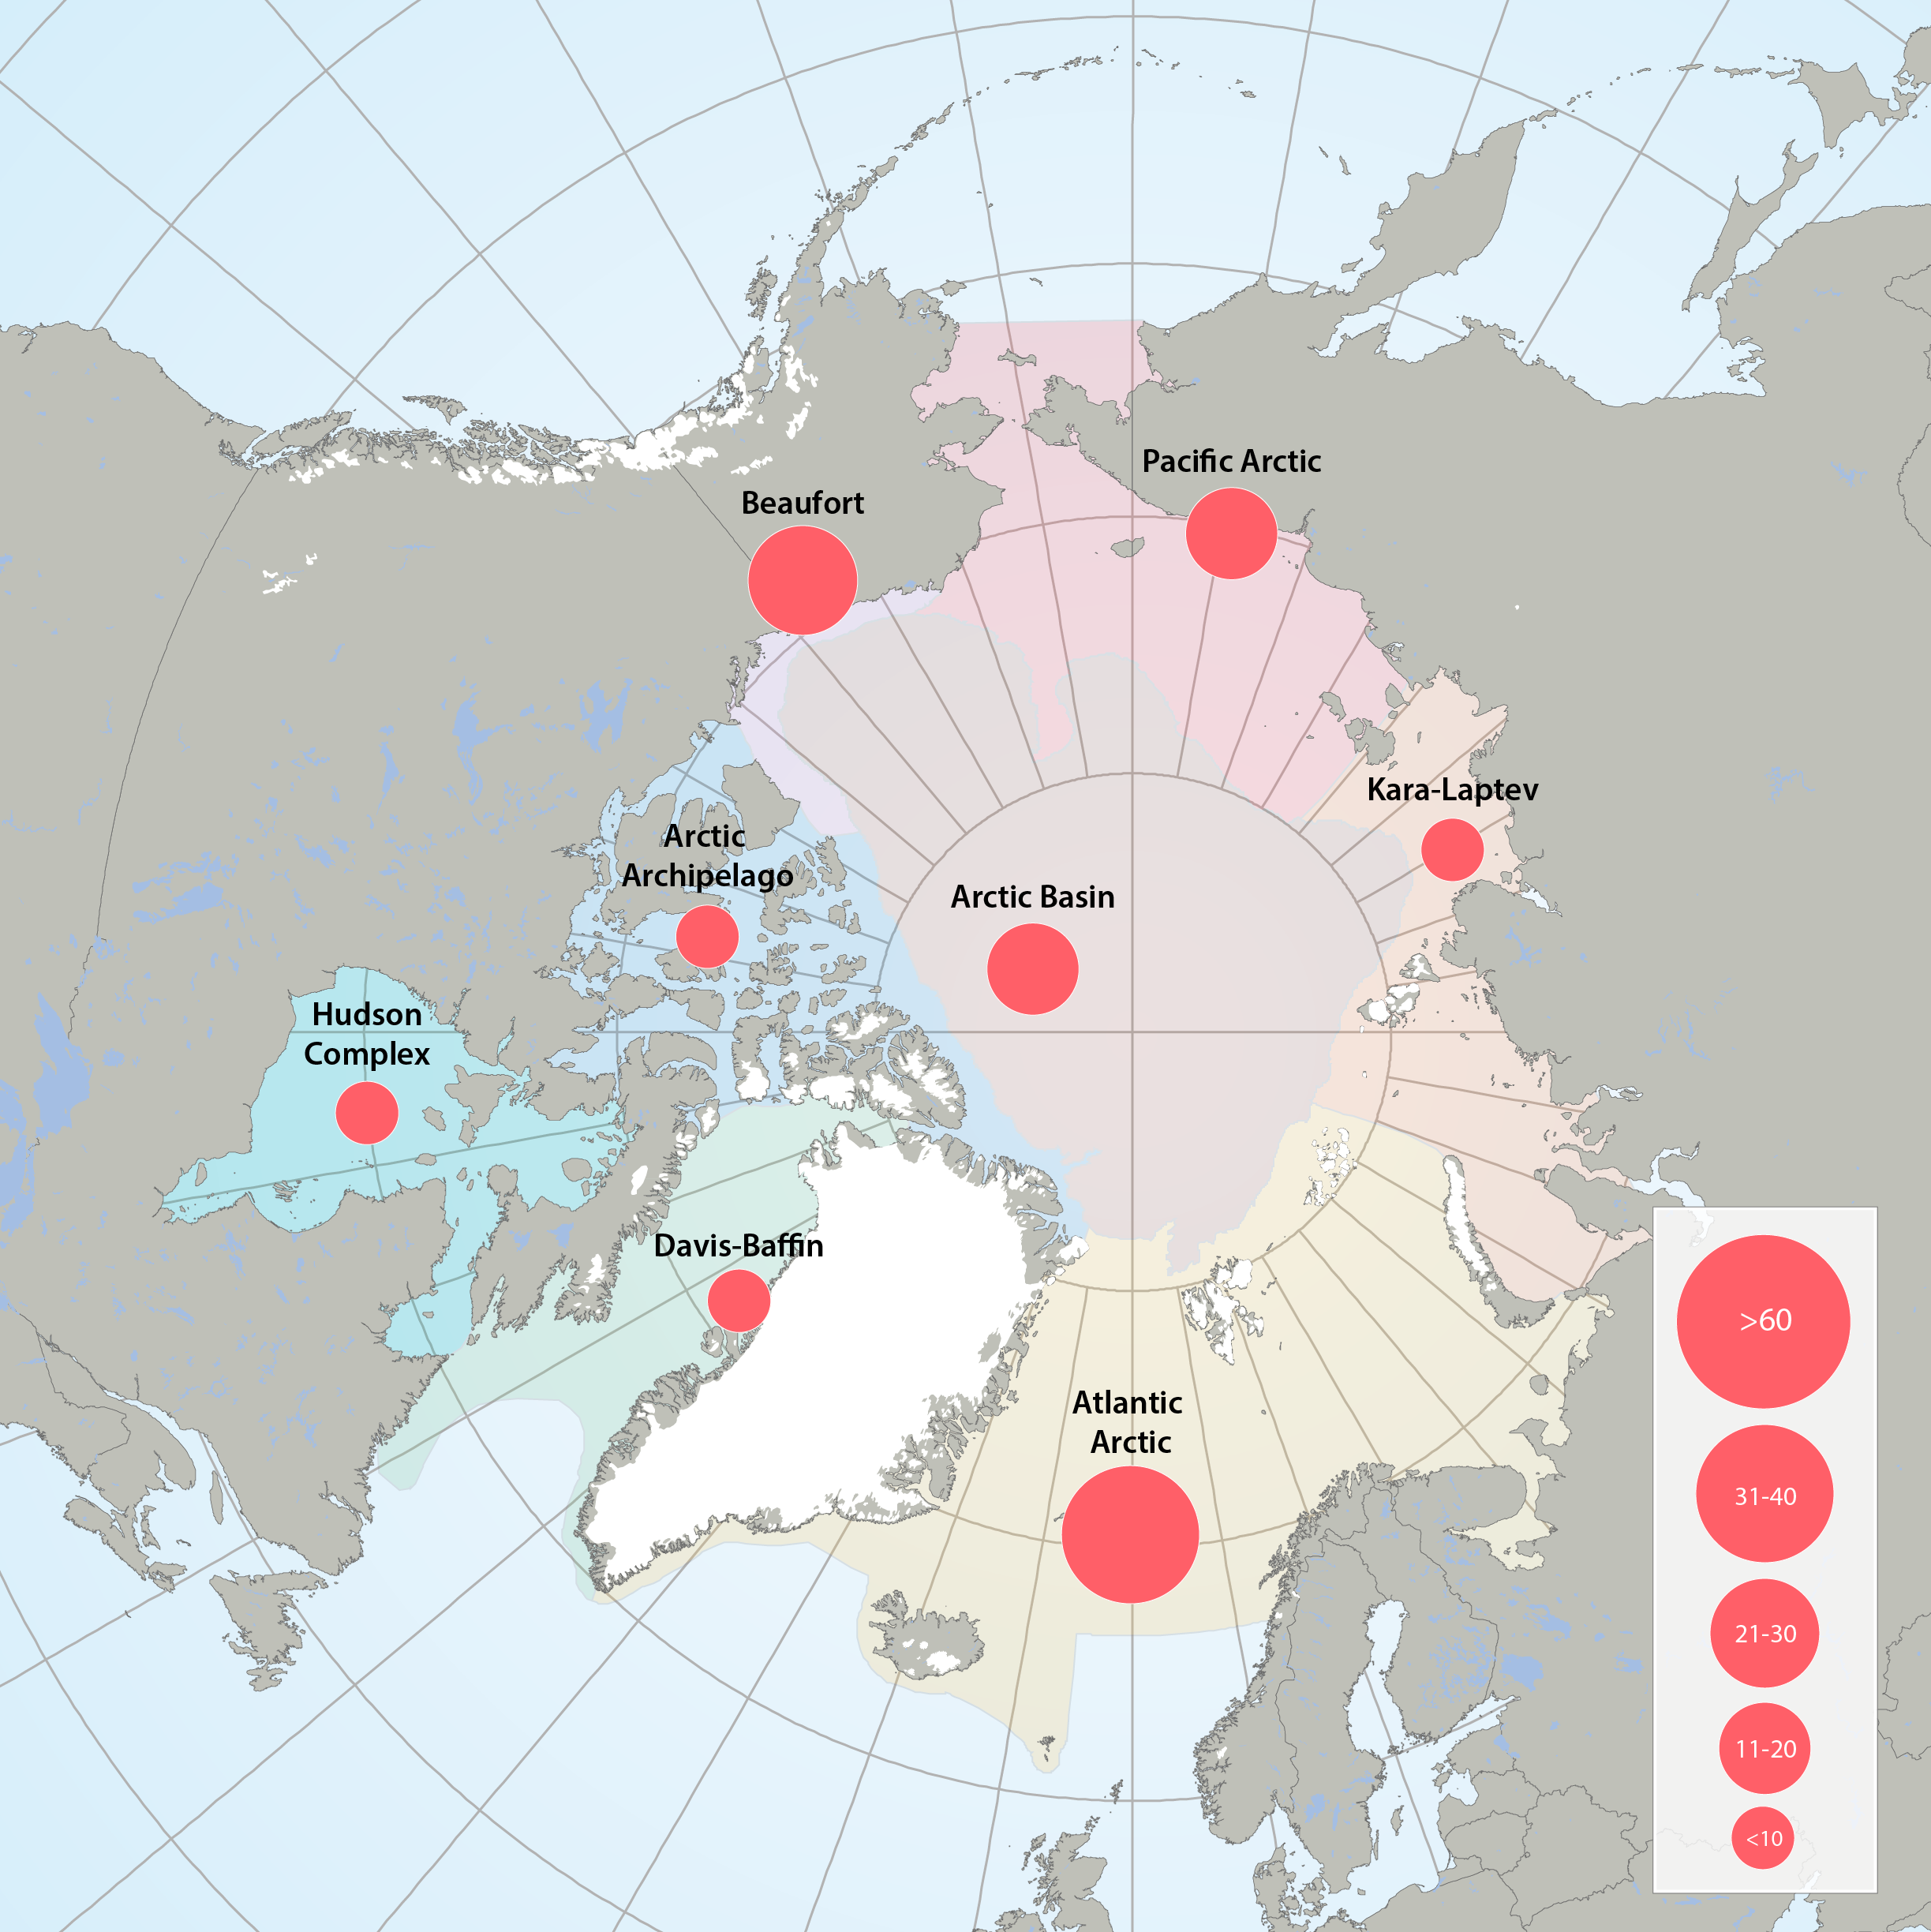
Figure 3.2.1a: Map of high throughput sequencing records from the Arctic Marine Areas. Figure 3.2.1b: Map of records of phytoplankton taxa using microscopy from the Arctic Marine Areas. STATE OF THE ARCTIC MARINE BIODIVERSITY REPORT - <a href="https://arcticbiodiversity.is/findings/plankton" target="_blank">Chapter 3</a> - Page 35 - Figure 3.2.1a and Figure 3.2.1b In terms of stations sampled, the greatest sampling effort of high-throughput sequencing in Arctic marine water columns, by far, has been in the Beaufort Sea/Amundsen Gulf region and around Svalbard. High through-put sequencing has also been used on samples from the Chukchi Sea, Canadian Arctic Archipelago, Baffin Bay, Hudson Bay, the Greenland Sea and Laptev Sea.
-

Interannual differences in taxonomic composition of phytoplankton during summer in a) Kongsfjorden and b) Rijpfjorden (Source: MOSJ, Norwegian Polar Institute). STATE OF THE ARCTIC MARINE BIODIVERSITY REPORT - <a href="https://arcticbiodiversity.is/findings/plankton" target="_blank">Chapter 3</a> - Page 74 - Figure 3.2.5