 Arctic Biodiversity Data Service - ABDS Catalog
lake
Type of resources
Available actions
Topics
Keywords
Contact for the resource
Provided by
Formats
Representation types
Update frequencies
status
-
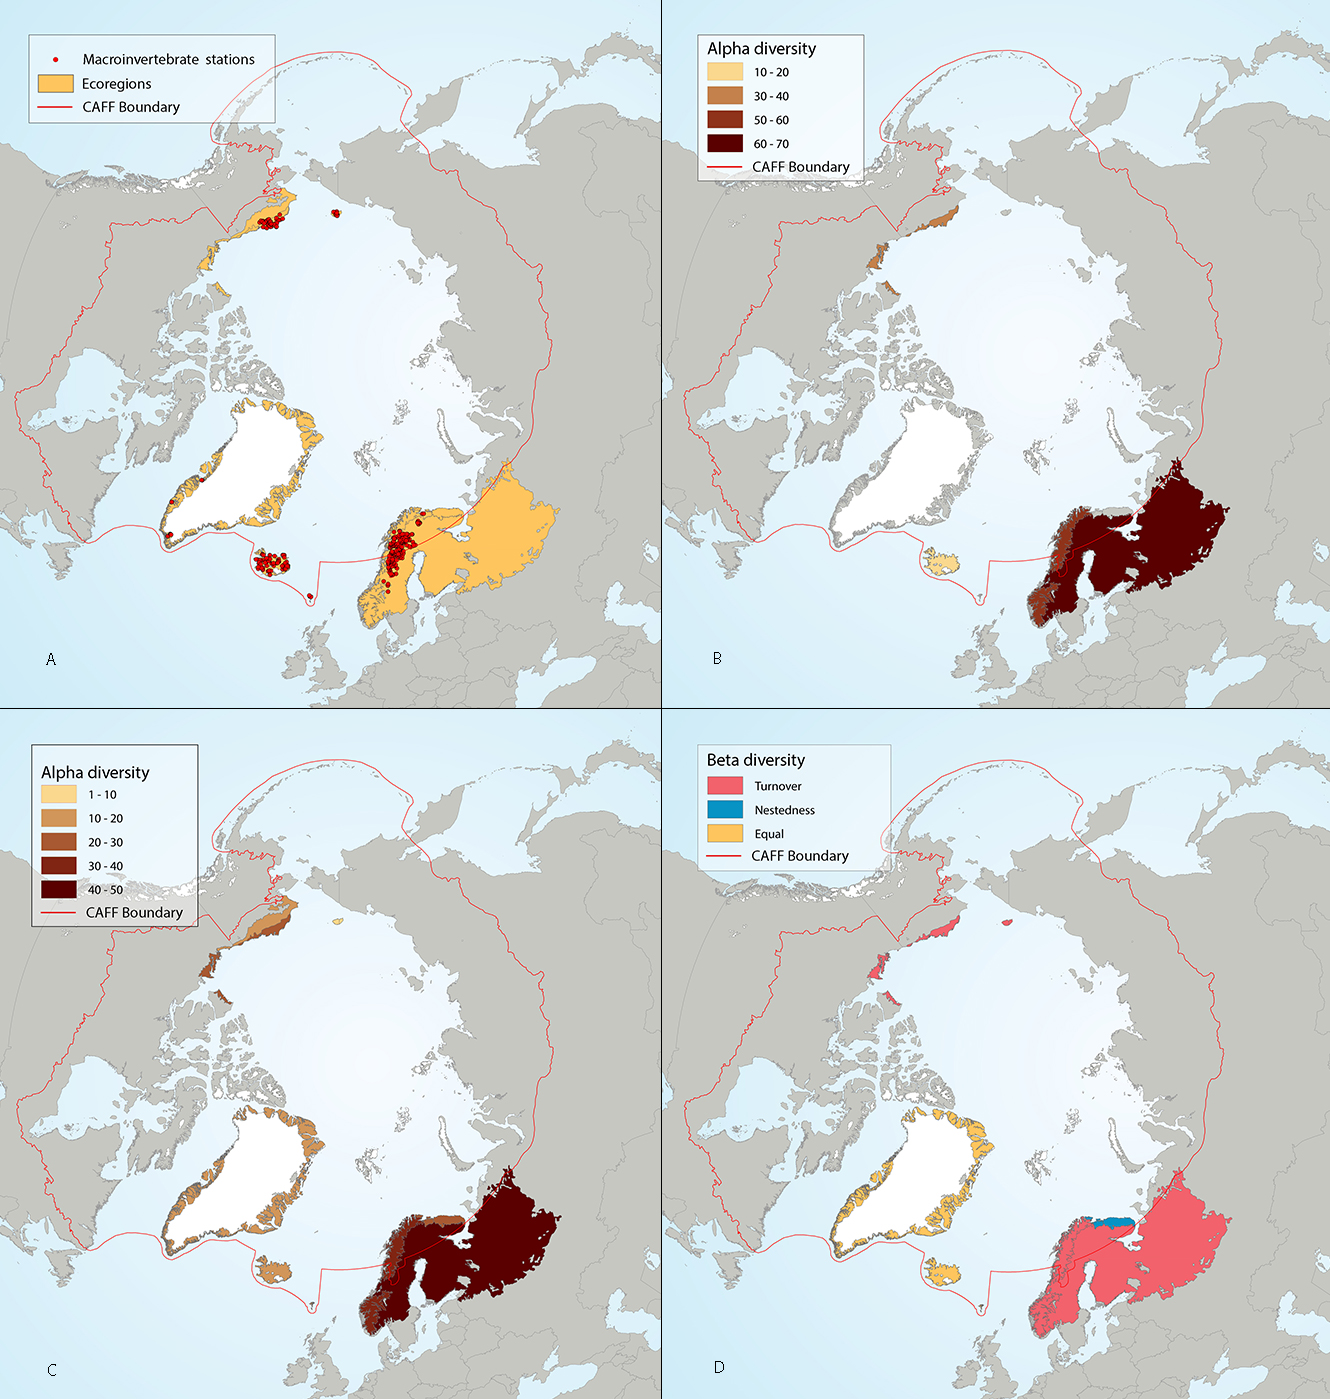
Results of circumpolar assessment of lake littoral benthic macroinvertebrates, indicating (a) the location of littoral benthic macroinvertebrate stations, underlain by circumpolar ecoregions; (b) ecoregions with many littoral benthic macroinvertebrate stations, colored on the basis of alpha diversity rarefied to 80 stations; (c) all ecoregions with littoral benthic macroinvertebrate stations, colored on the basis of alpha diversity rarefied to 10 stations; (d) ecoregions with at least two stations in a hydrobasin, colored on the basis of the dominant component of beta diversity (species turnover, nestedness, approximately equal contribution, or no diversity) when averaged across hydrobasins in each ecoregion. State of the Arctic Freshwater Biodiversity Report - Chapter 4 - Page 65 - Figure 4-29
-
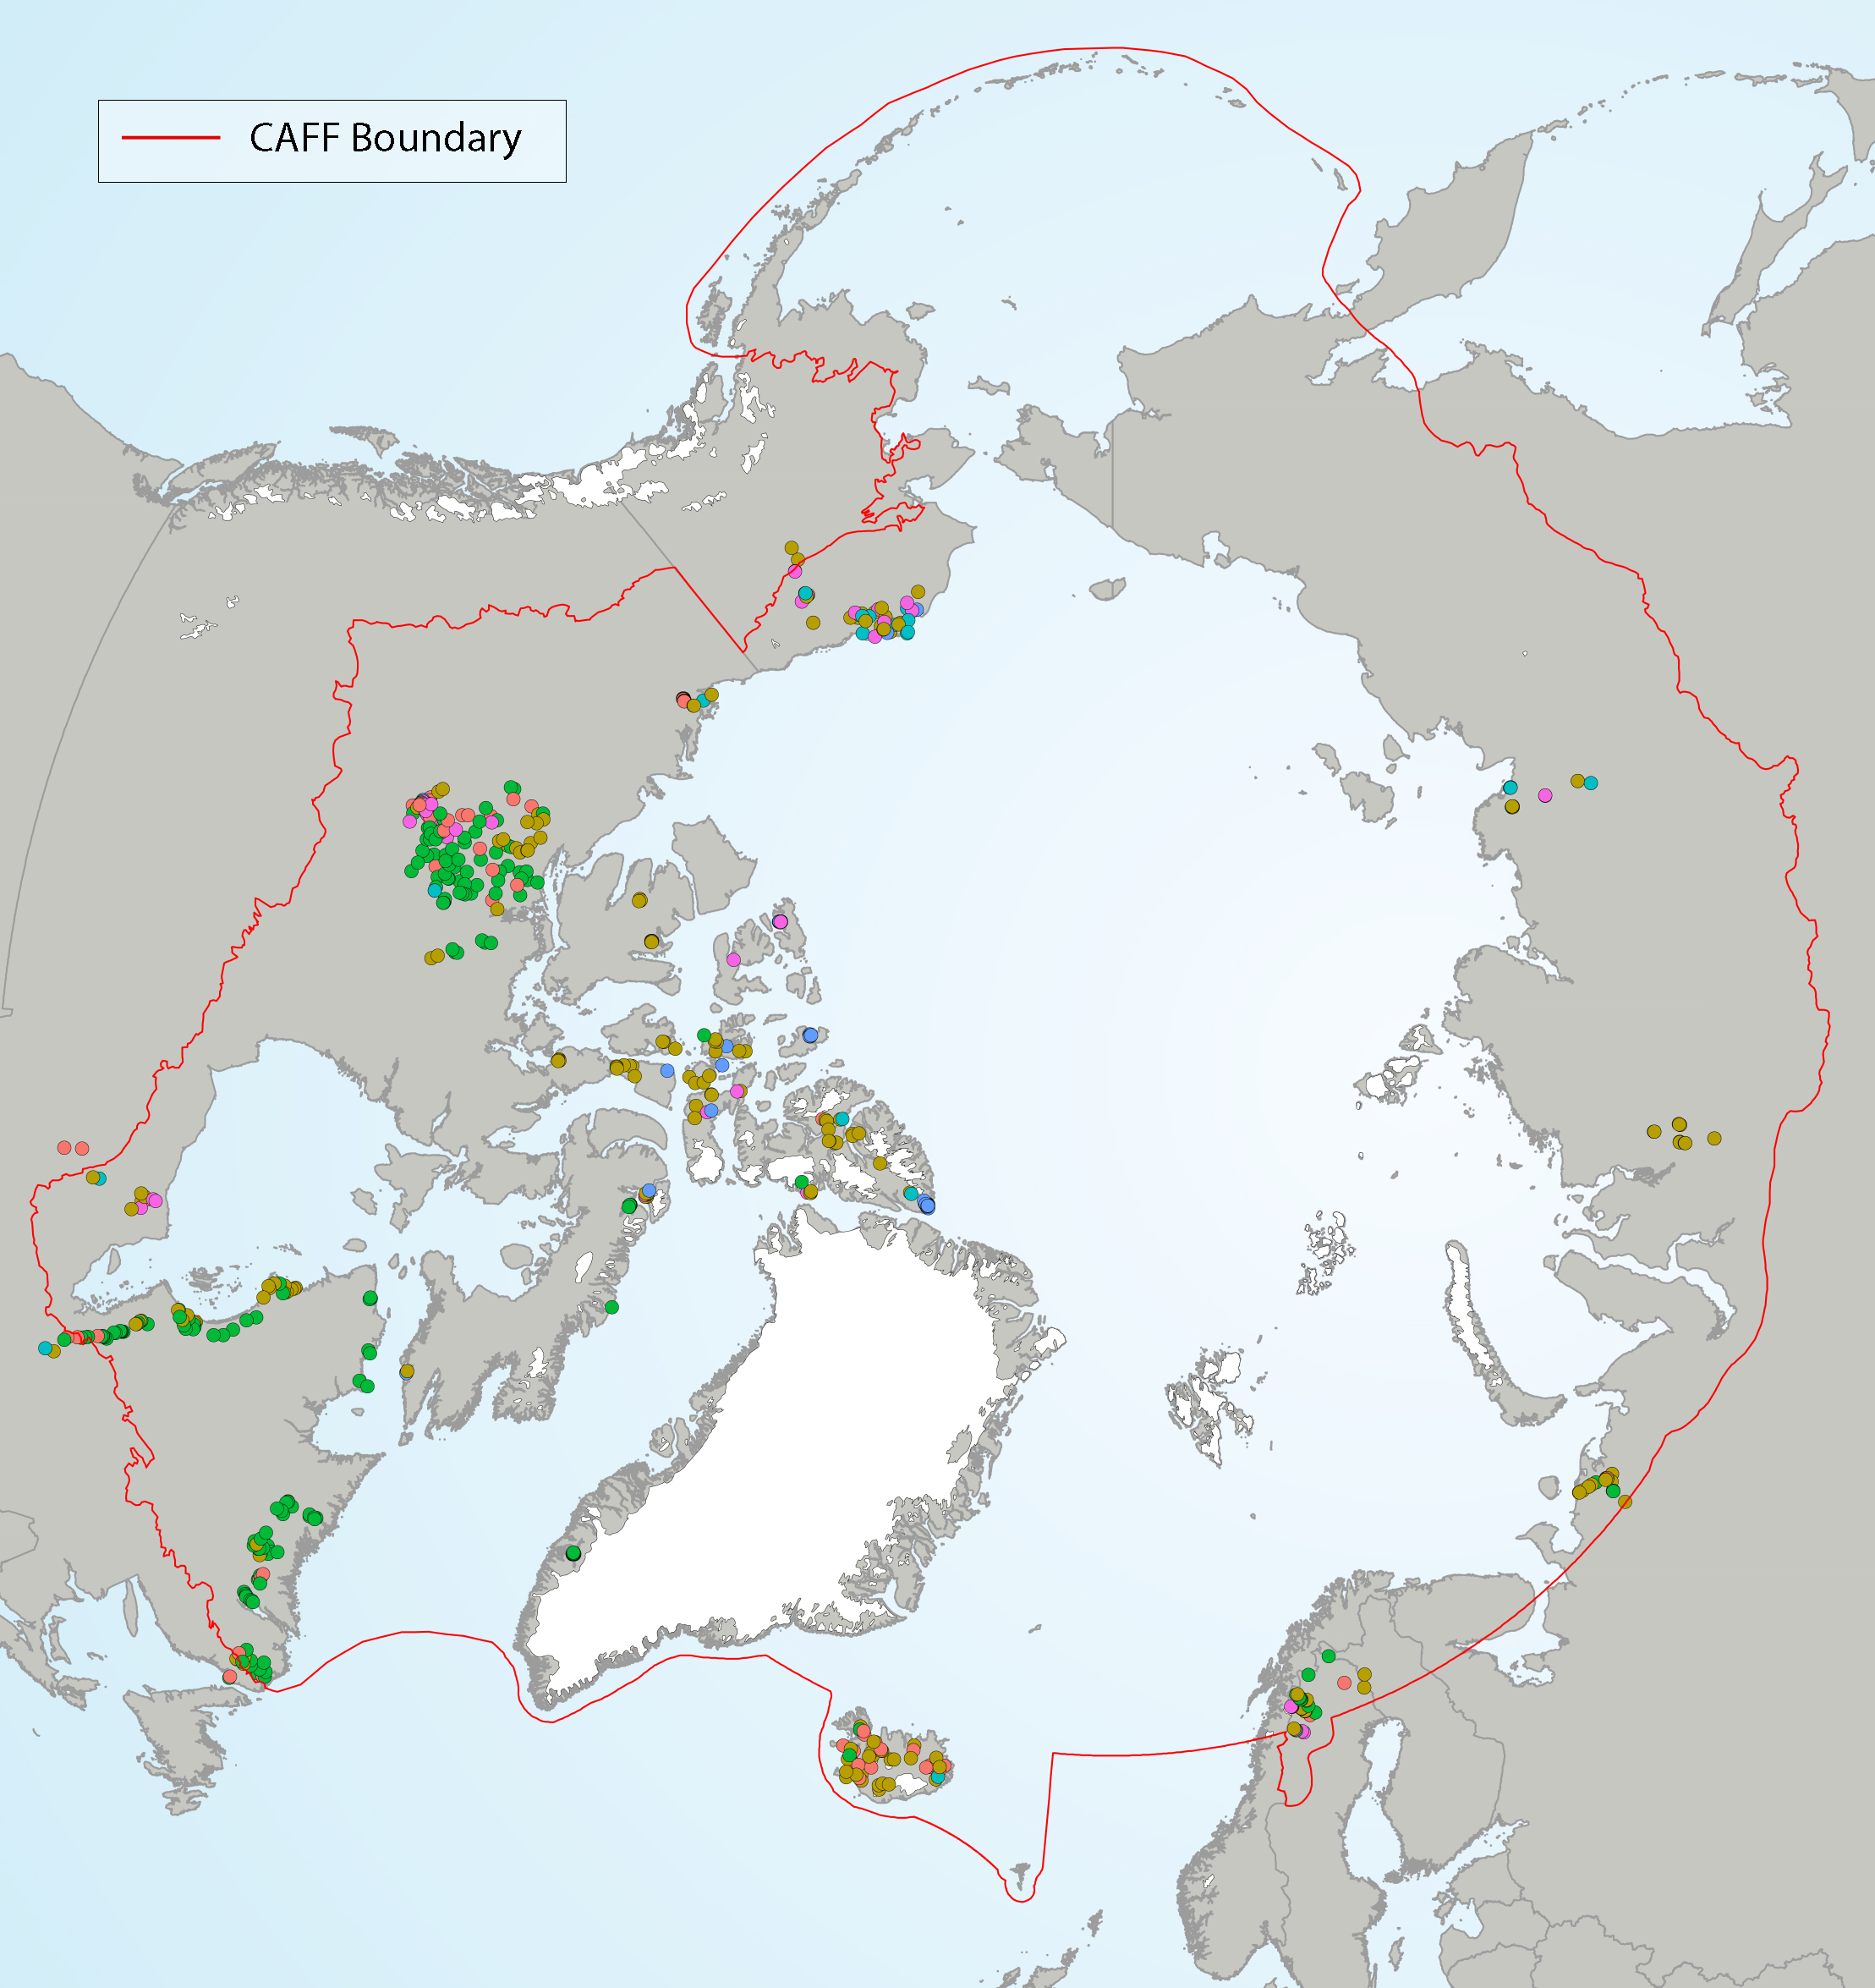
Figure 4 12 Diatom groups from Self Organizing Maps (SOMs) in lake top sediments, showing the geographical distribution of each group (with colors representing different SOM groups). State of the Arctic Freshwater Biodiversity Report - Chapter 4 - Page 39 - Figure 4-12
-
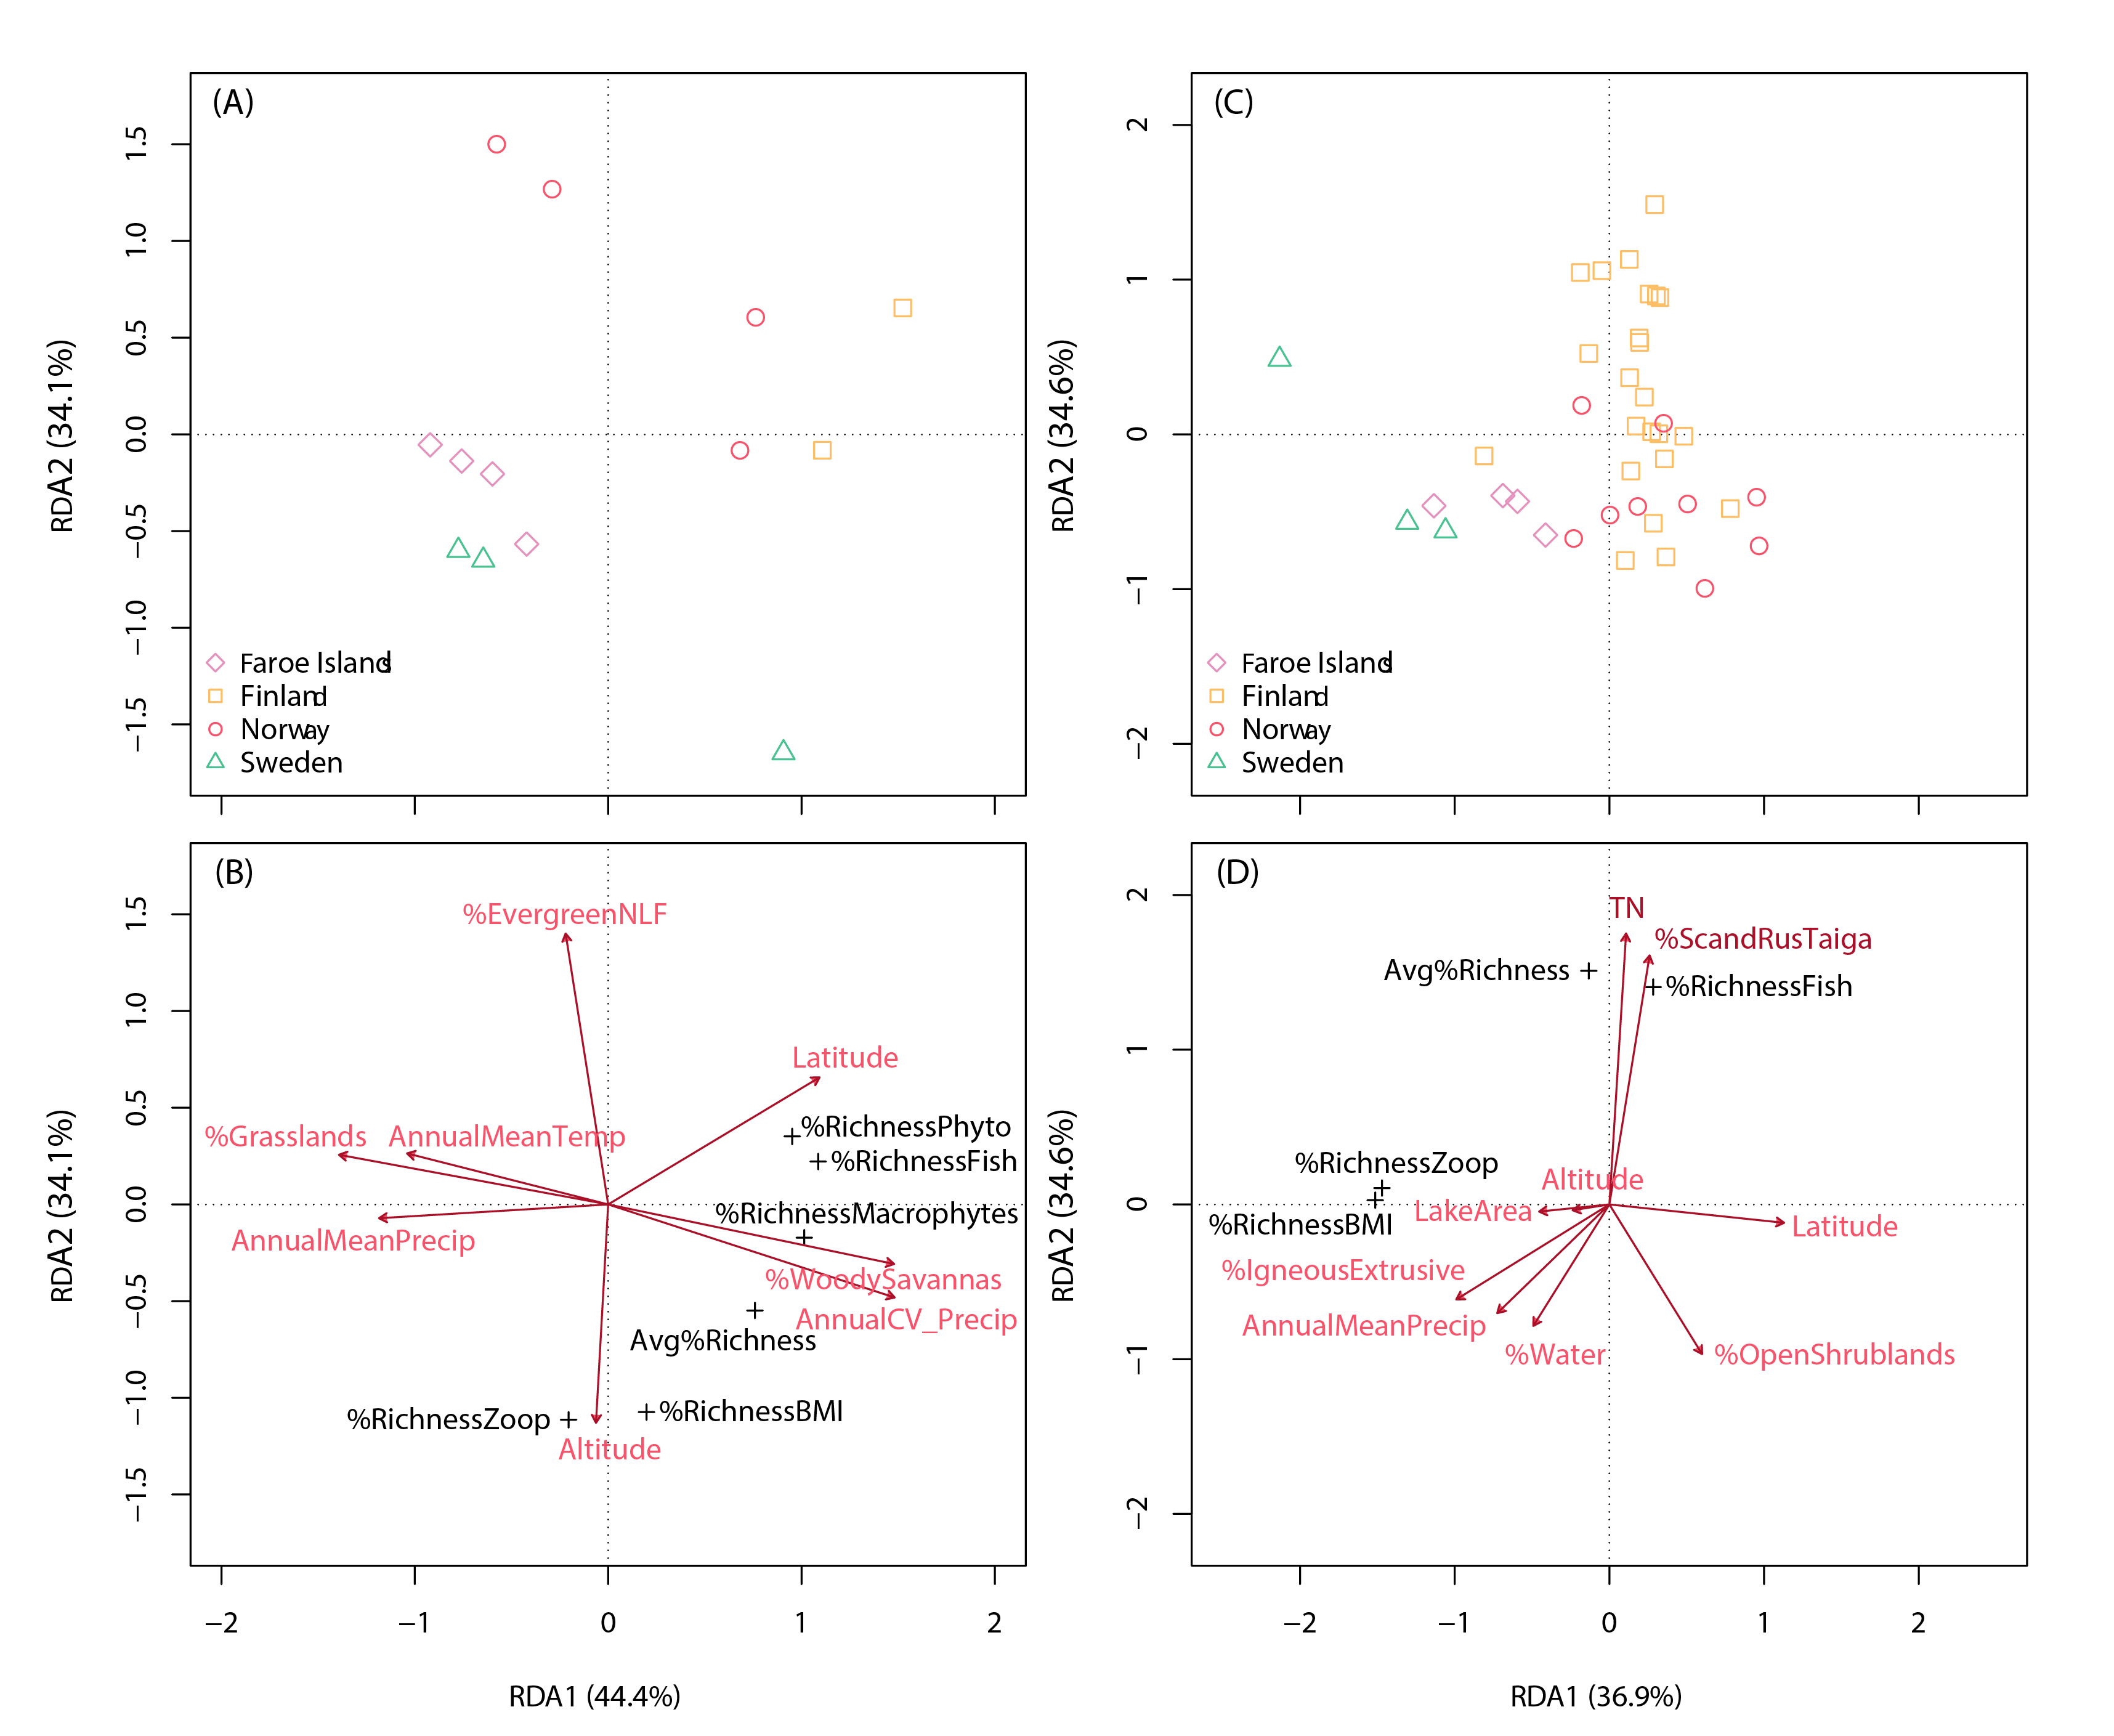
Redundancy analysis of percentage species taxa share (taxa richness relative to richness of all taxa) among 5 FECs (phytoplankton, macrophytes, zooplankton, benthic macroinvertebrates and fish) in 13 Fennoscandian lakes (panels A and B) and among 3 FECs in 39 Fennoscandian lakes (panels C and D).The upper panels show lake ordinations, while the bottom panels show explanatory environmental variables (red arrows), as indicated by permutation tests (p < 0.05). Avg%Richness: average species taxa richness as a percentage of richness of all FECs (i.e., including benthic algae if present); %Richness BMI: relative taxa share in benthic macroinvertebrates; %EvergreenNLF: percentage cover of evergreen needle-leaf forests. State of the Arctic Freshwater Biodiversity Report - Chapter 5 - Page 87 - Figure 5-4
-
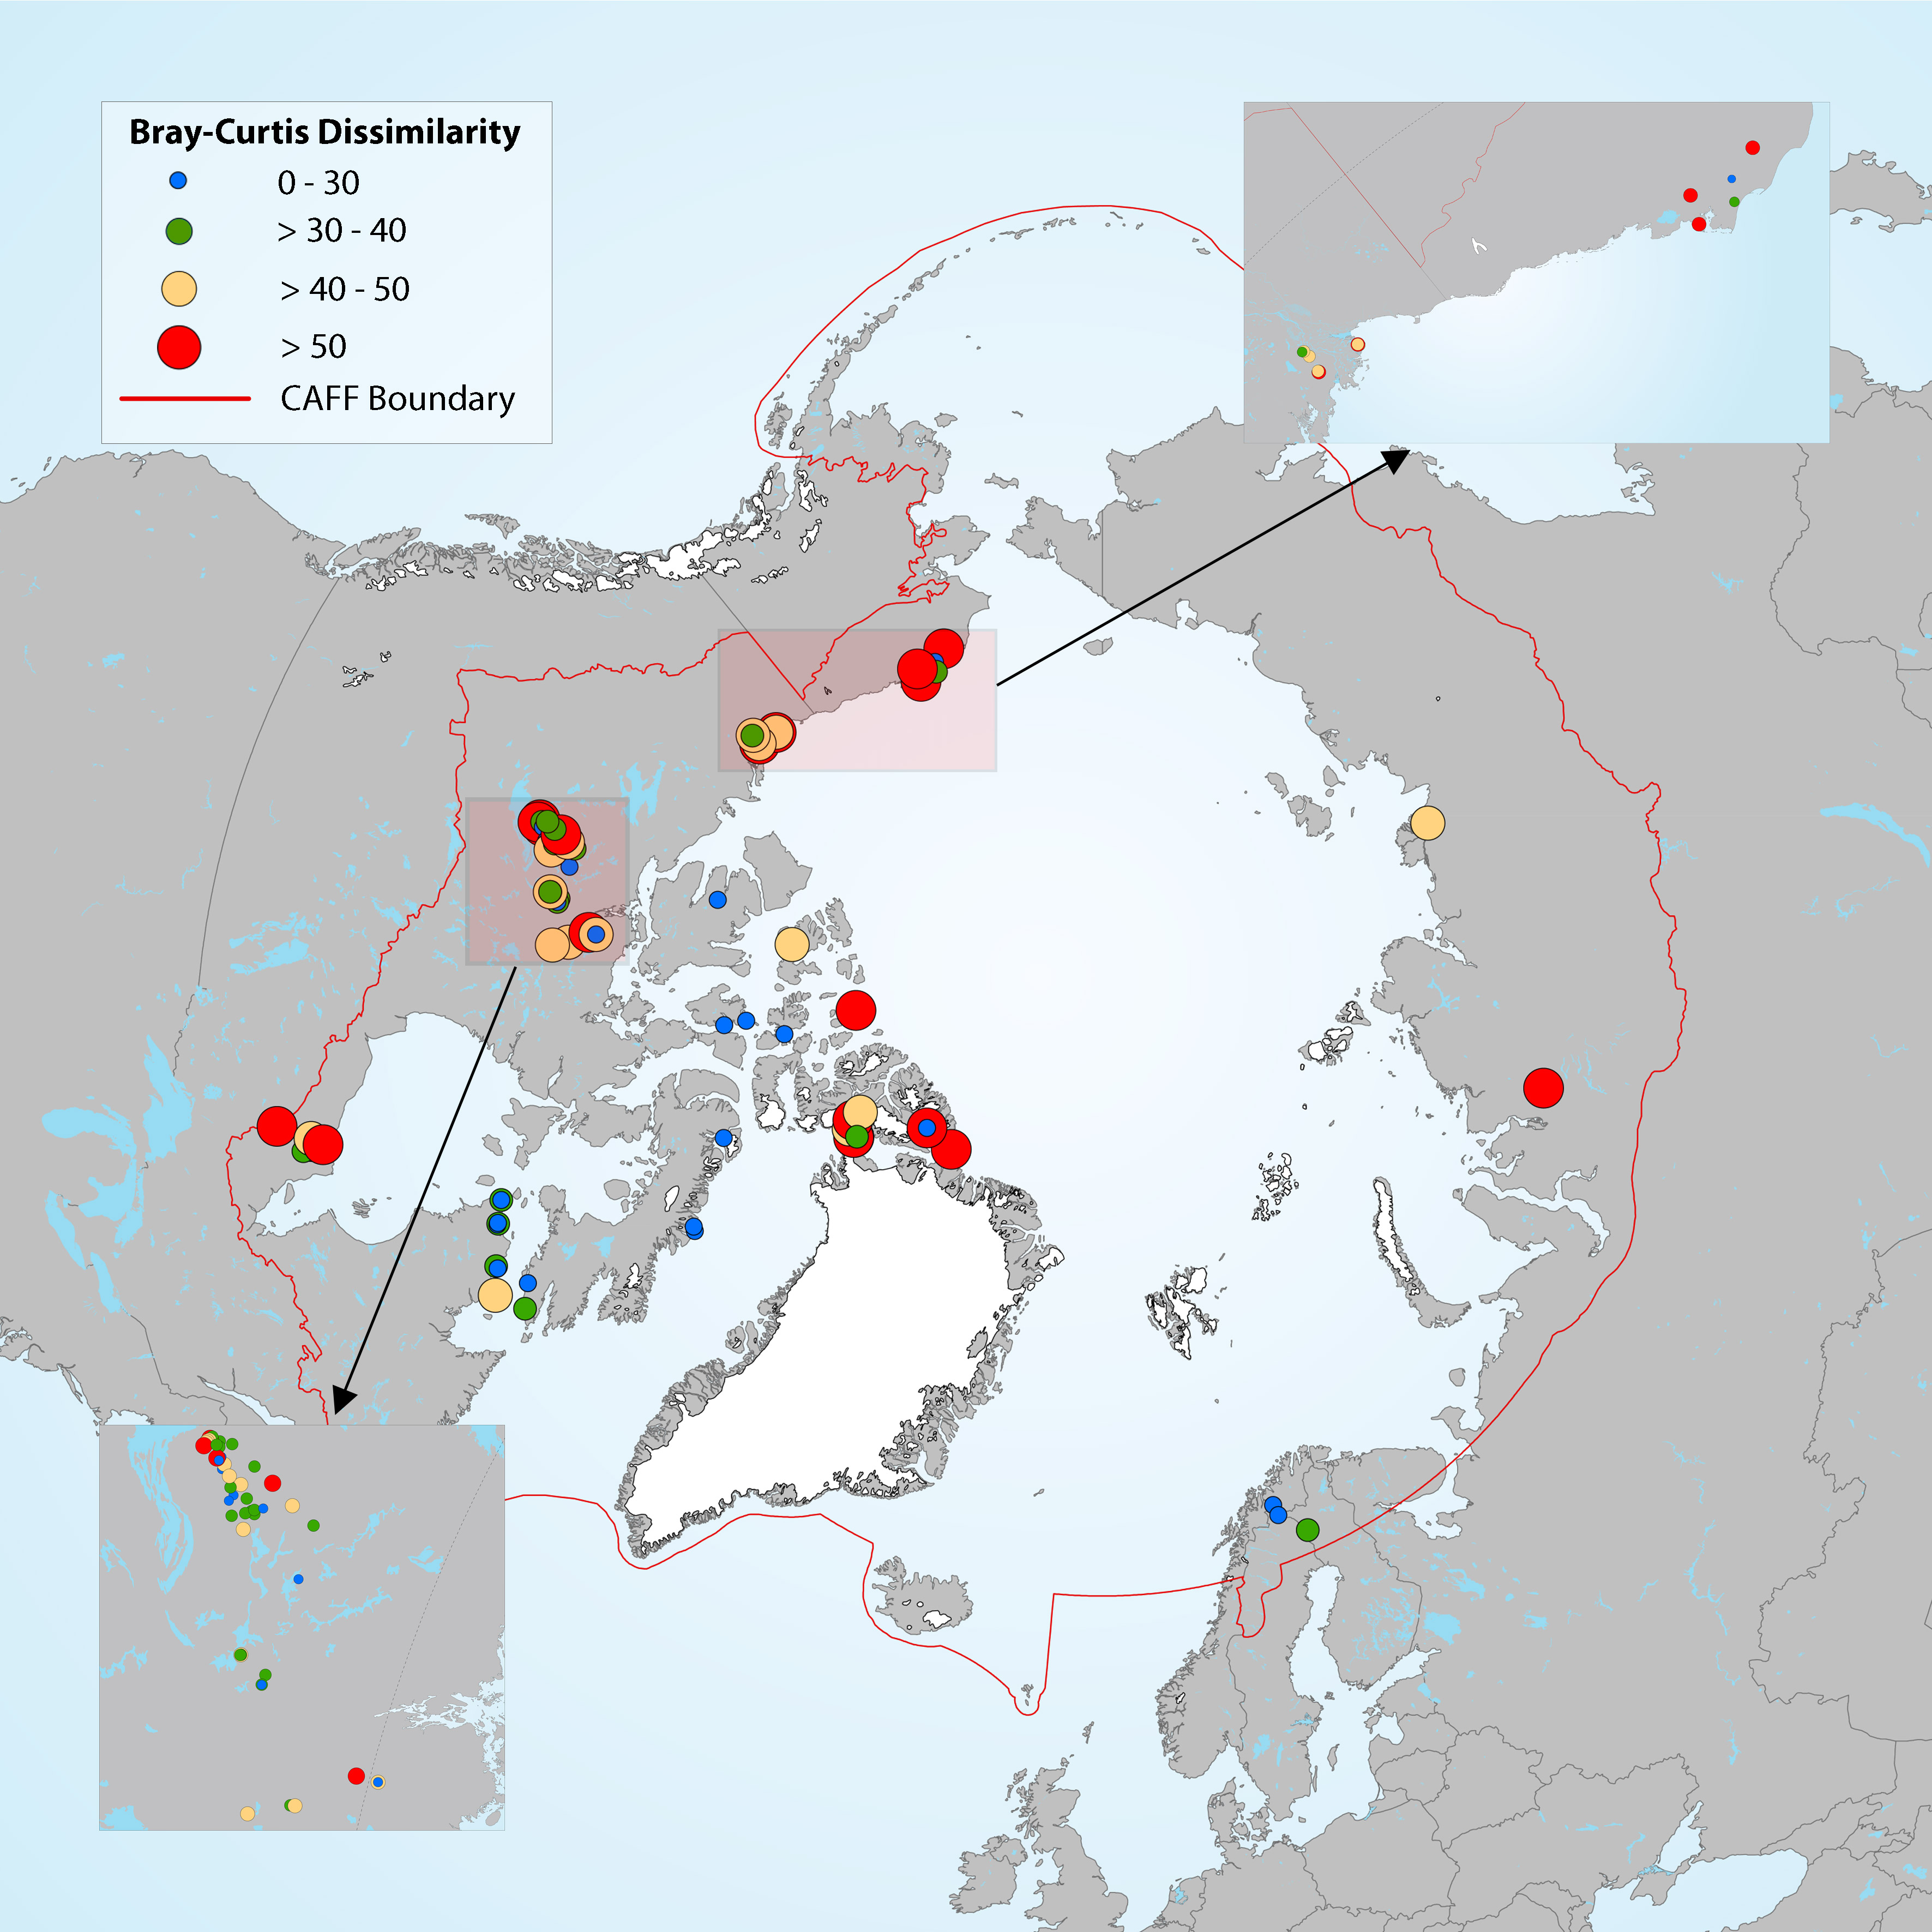
Estimation of diatom assemblage changes over a period of about 200 years (top versus bottom sediment cores). State of the Arctic Freshwater Biodiversity Report - Chapter 4 - Page 41 - Figure 4-14
-
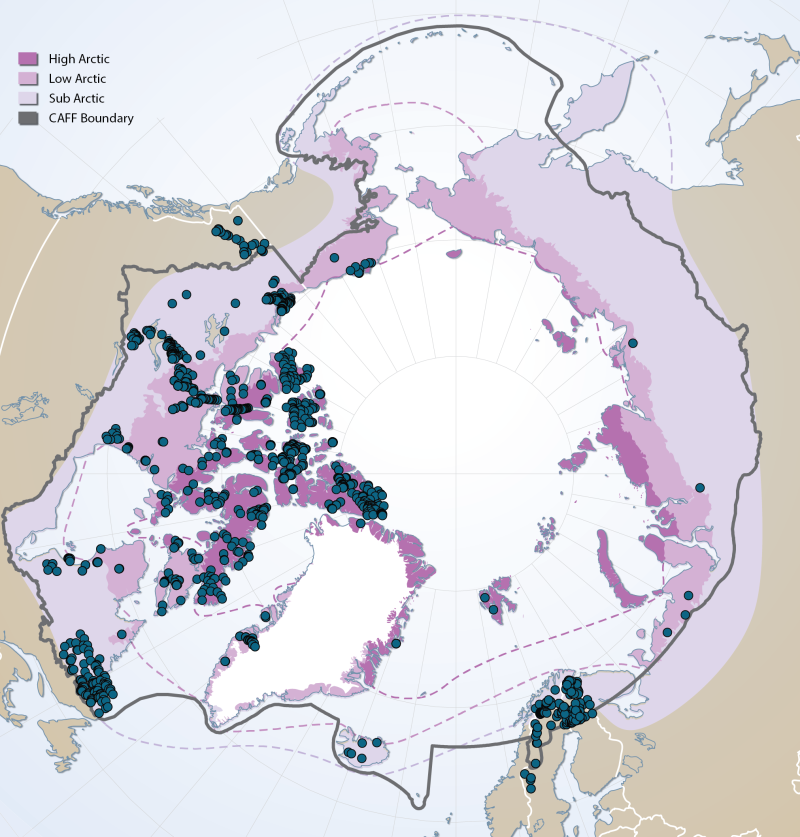
Sites of existing lake biotic and abiotic data as compiled by the Freshwater Expert Monitoring Group (FEMG) of the Circumpolar Biodiversity Monitoring Group (CBMP) Published in the CBMP Freshwater Brochure 2013 http://www.caff.is/monitoring-series/view_document/277-arctic-freshwater-biodiversity-monitoring-plan-brochure