 Arctic Biodiversity Data Service - ABDS Catalog
temperature
Type of resources
Available actions
Topics
Keywords
Contact for the resource
Provided by
Years
Representation types
Update frequencies
status
-
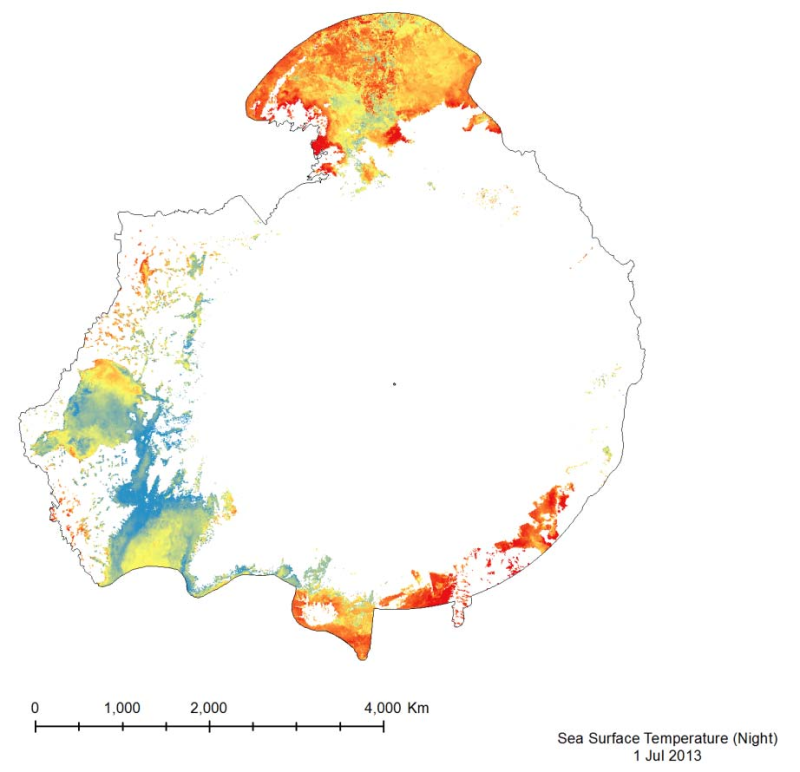
The MODIS Sea Surface Temperature (SST) product provided is a 4km spatialresolution monthly composite made from nighttime measurements from the Aqua Satellite.The nighttime measurements are used to collect a consistent temperature measurement that isunaffected by the warming of the top layer of water by the sun.
-
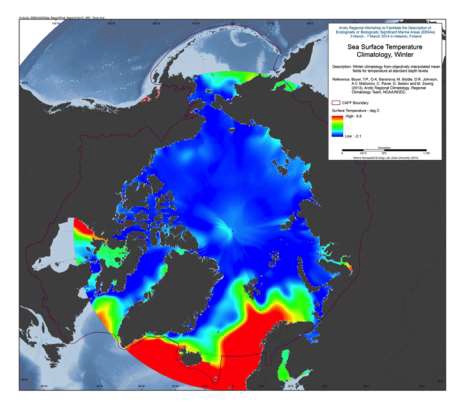
A set of mean fields for temperature and salinity for the Arctic Seas and environs are available for viewing and downloading. Area: The area encompassed is all longitudes from 60°N to 90°N latitudes. Horizontal resolution: Temperature and salinity are available on a 1°x1° and a 1/4°x1/4° latitude/longitude grid. Time resolution: All climatologies for all variables use all available data regardless of year of measurement. Climatologies were calculated for annual (all-data), seasonal, and monthly time periods. Seasons are as follows: Winter (Jan.-Mar.), Spring (Apr.-Jun.), Summer (Jul.-Aug.), Fall (Oct.-Dec.). Vertical resolution: Temperature and salinity are available on 87 standard levels with higher vertical resolution than the World Ocean Atlas 2009 (WOA09), but levels extend from the surface to 4000 m. Units: Temperature units are °C. Salinity is unitless on the Practical Salinity Scale-1978 [PSS]. Data used: All data from the area found in the World Ocean Database (WOD) as of the end of 2011. For a description of this dataset, please see World Ocean Database 2009 IntroductionMethod: The method followed for calculation of the mean climatological fields is detailed in the following publications: Temperature: Locarnini et al., 2010, Salinity: Antonov et al., 2010. Additional details on the 1/4° climatological calculation are found in Boyer et al., 2005, from: <a href="http://www.nodc.noaa.gov/OC5/regional_climate/arctic/" target="_blank">NOAA</a> Reference: Boyer, T.P., O.K. Baranova, M. Biddle, D.R. Johnson, A.V. Mishonov, C. Paver, D. Seidov and M. Zweng (2012), Arctic Regional Climatology, Regional Climatology Team, NOAA/NODC, source: <a href="www.nodc.noaa.gov/OC5/regional_climate/arctic" target="_blank">NOAA</a>
-
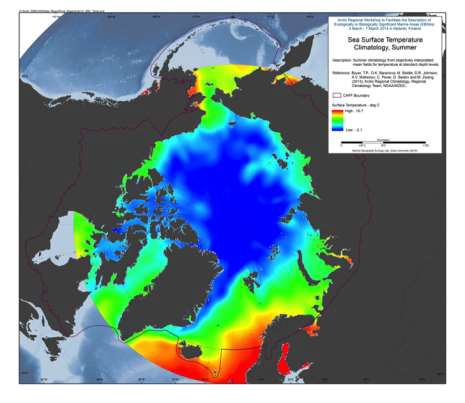
A set of mean fields for temperature and salinity for the Arctic Seas and environs are available for viewing and downloading. Area: The area encompassed is all longitudes from 60°N to 90°N latitudes. Horizontal resolution: Temperature and salinity are available on a 1°x1° and a 1/4°x1/4° latitude/longitude grid. Time resolution: All climatologies for all variables use all available data regardless of year of measurement. Climatologies were calculated for annual (all-data), seasonal, and monthly time periods. Seasons are as follows: Winter (Jan.-Mar.), Spring (Apr.-Jun.), Summer (Jul.-Aug.), Fall (Oct.-Dec.). Vertical resolution: Temperature and salinity are available on 87 standard levels with higher vertical resolution than the World Ocean Atlas 2009 (WOA09), but levels extend from the surface to 4000 m. Units: Temperature units are °C. Salinity is unitless on the Practical Salinity Scale-1978 [PSS]. Data used: All data from the area found in the World Ocean Database (WOD) as of the end of 2011. For a description of this dataset, please see World Ocean Database 2009 Introduction Method: The method followed for calculation of the mean climatological fields is detailed in the following publications: Temperature: Locarnini et al., 2010, Salinity: Antonov et al., 2010. Additional details on the 1/4° climatological calculation are found in Boyer et al., 2005, from: <a href="http://www.nodc.noaa.gov/OC5/regional_climate/arctic/" target="_blank">NOAA</a> Reference: Boyer, T.P., O.K. Baranova, M. Biddle, D.R. Johnson, A.V. Mishonov, C. Paver, D. Seidov and M. Zweng (2012), Arctic Regional Climatology, Regional Climatology Team, NOAA/NODC, source: <a href="www.nodc.noaa.gov/OC5/regional_climate/arctic" target="_blank">NOAA</a>
-
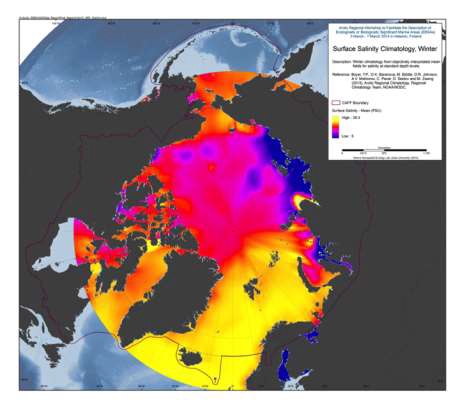
A set of mean fields for temperature and salinity for the Arctic Seas and environs are available for viewing and downloading. Area: The area encompassed is all longitudes from 60°N to 90°N latitudes. Horizontal resolution: Temperature and salinity are available on a 1°x1° and a 1/4°x1/4° latitude/longitude grid. Time resolution: All climatologies for all variables use all available data regardless of year of measurement. Climatologies were calculated for annual (all-data), seasonal, and monthly time periods. Seasons are as follows: Winter (Jan.-Mar.), Spring (Apr.-Jun.), Summer (Jul.-Aug.), Fall (Oct.-Dec.). Vertical resolution: Temperature and salinity are available on 87 standard levels with higher vertical resolution than the World Ocean Atlas 2009 (WOA09), but levels extend from the surface to 4000 m. Units: Temperature units are °C. Salinity is unitless on the Practical Salinity Scale-1978 [PSS]. Data used: All data from the area found in the World Ocean Database (WOD) as of the end of 2011. For a description of this dataset, please see World Ocean Database 2009 IntroductionMethod: The method followed for calculation of the mean climatological fields is detailed in the following publications: Temperature: Locarnini et al., 2010, Salinity: Antonov et al., 2010. Additional details on the 1/4° climatological calculation are found in Boyer et al., 2005, from: <a href="http://www.nodc.noaa.gov/OC5/regional_climate/arctic/" target="_blank">NOAA</a> Reference: Boyer, T.P., O.K. Baranova, M. Biddle, D.R. Johnson, A.V. Mishonov, C. Paver, D. Seidov and M. Zweng (2012), Arctic Regional Climatology, Regional Climatology Team, NOAA/NODC, source: <a href="www.nodc.noaa.gov/OC5/regional_climate/arctic" target="_blank">NOAA</a>
-
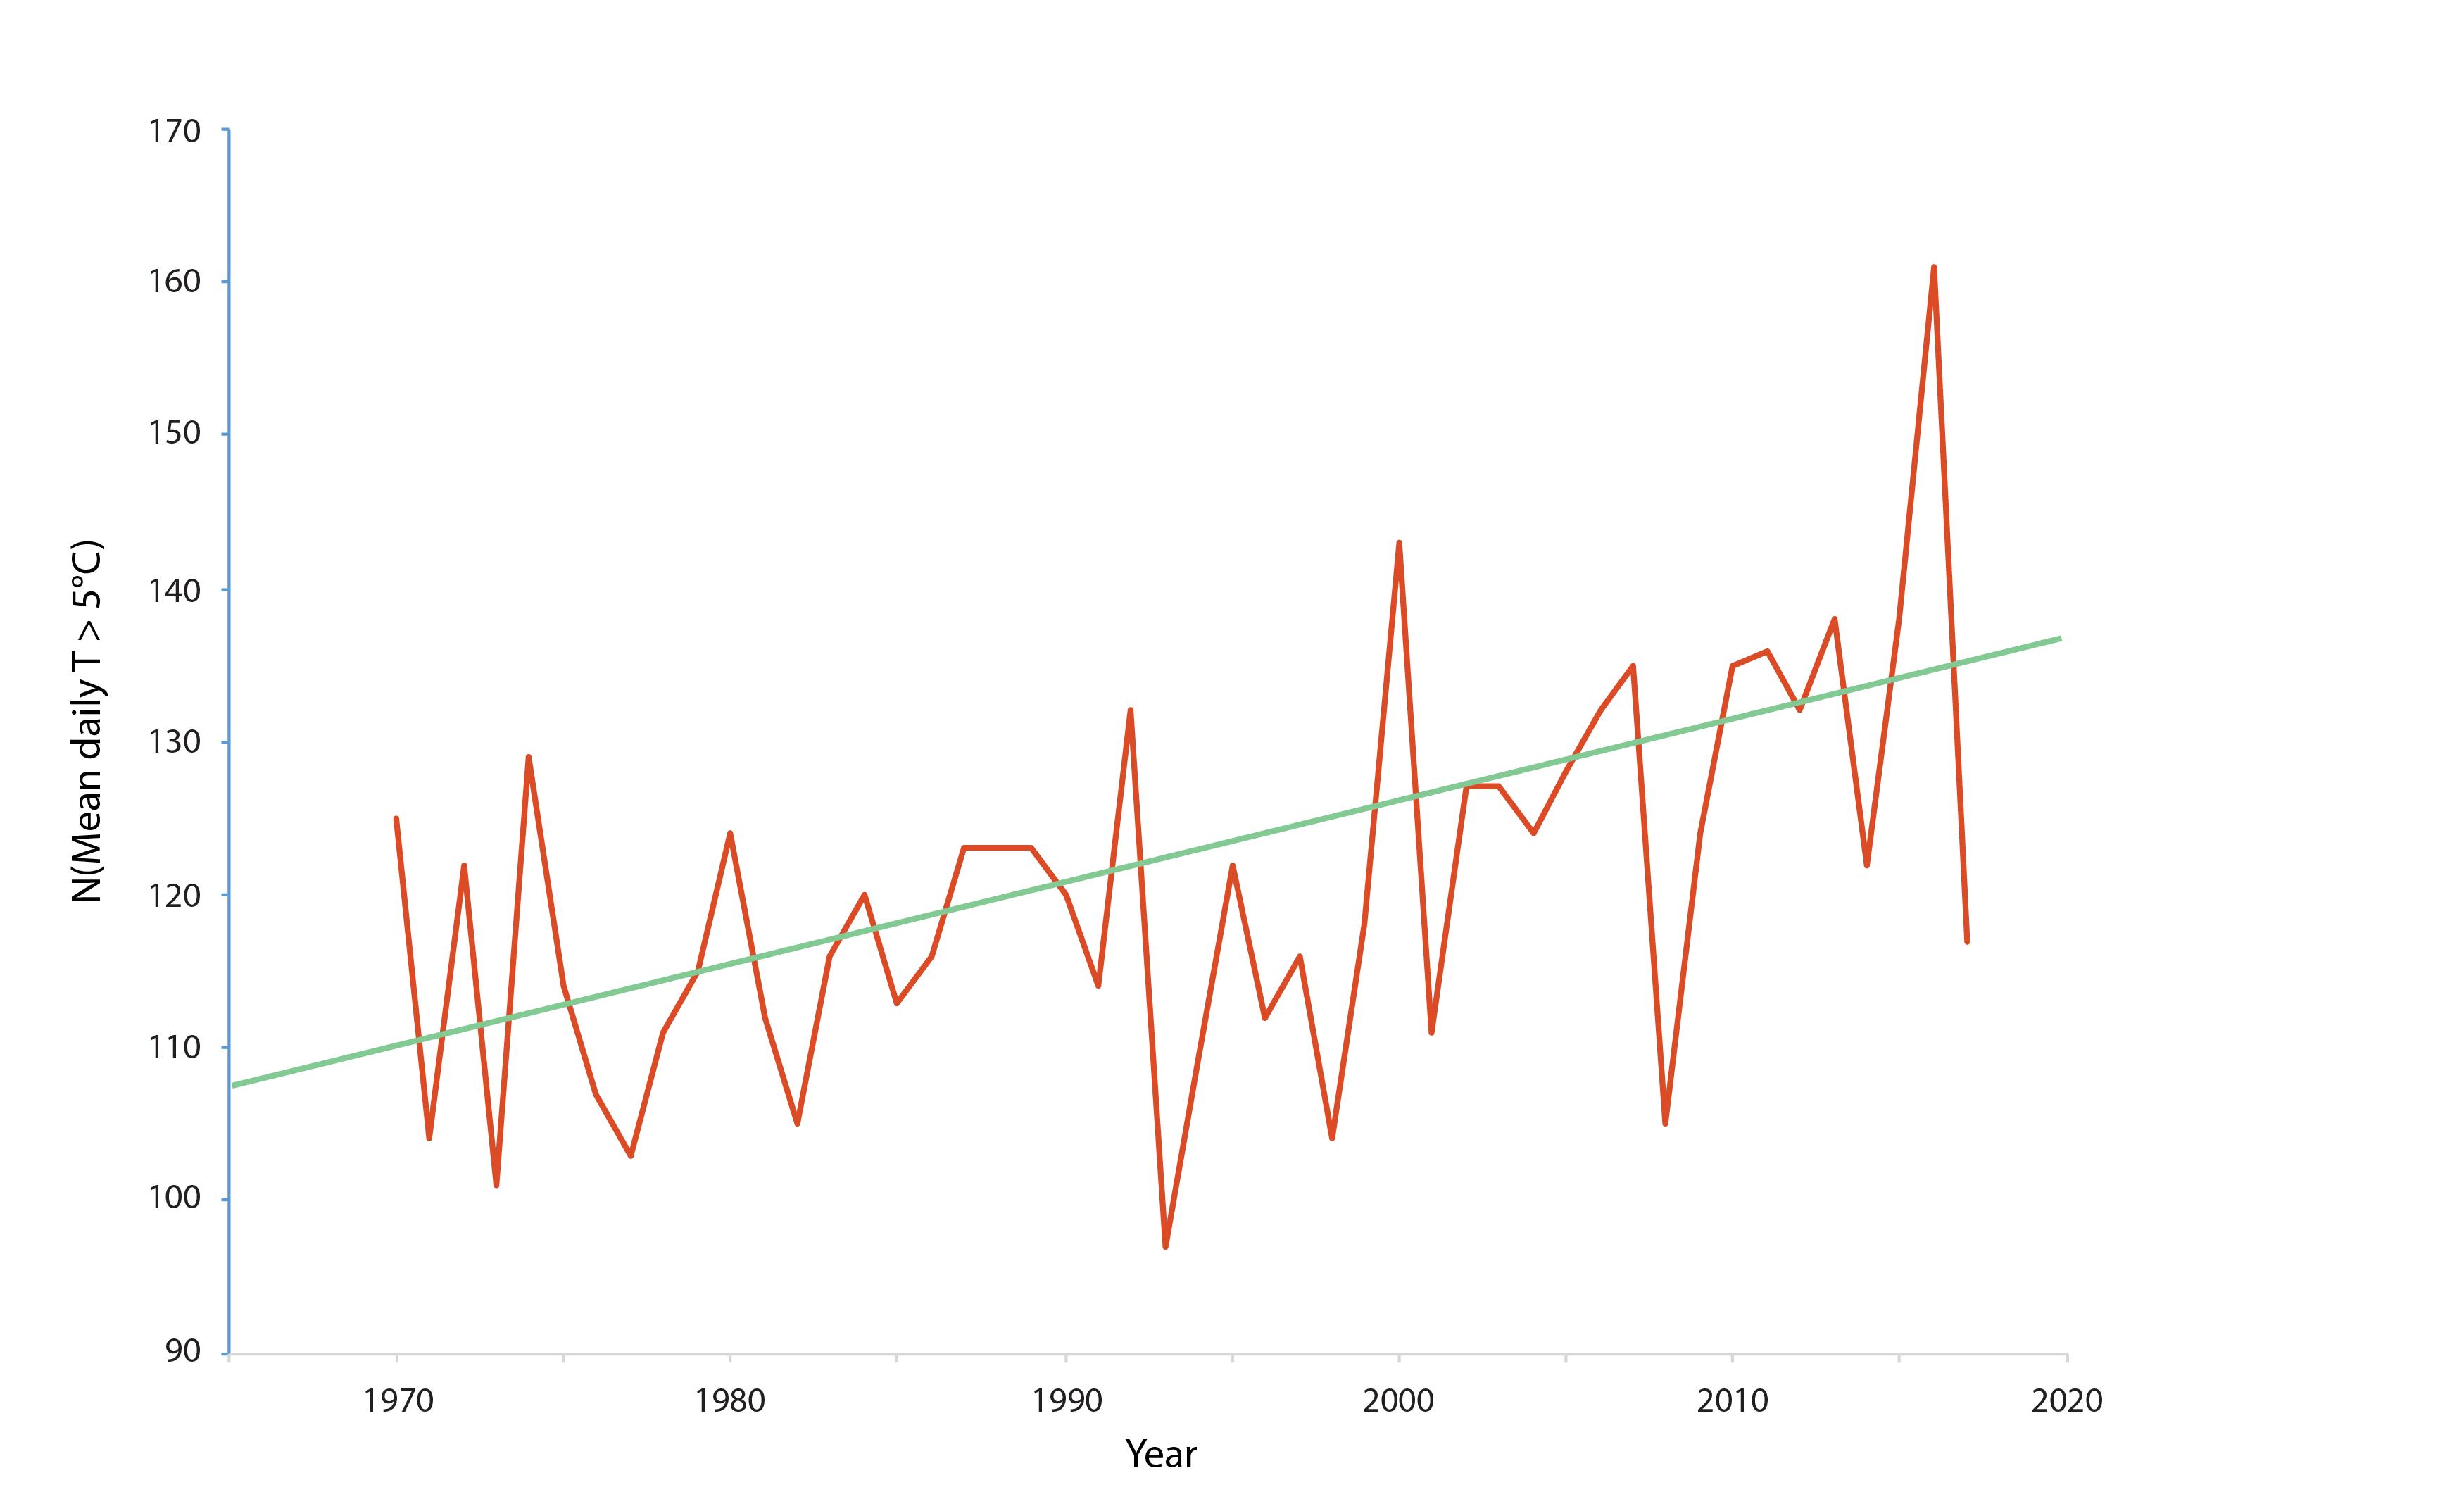
Figure 3-2 Long-term water temperature trends (1970–2017) for the Utsjoki Nuorgam station in the River Tana (69°N in Finland). The diagram shows the number of days per year with a mean temperature exceeding 5°C. The data show that from 1995 to 2017, this indicator increased by over 0.5 days per year. Data source: Finnish Meteorological Institute. State of the Arctic Freshwater Biodiversity Report - Chapter 3 - Page 15 - Figure 2-1
-
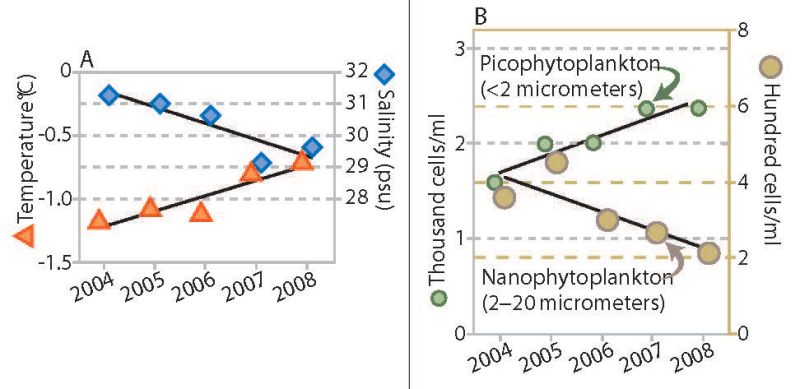
Trends in water temperature and salinity (A) and density of phytoplankton of two size ranges (B), Canada Basin, 2004 to 2008. Stratification of the water column increased throughout the Canada Basin over a recent five-year period, accompanied by a change in phytoplankton communities. The upper ocean layer showed trends of increased temperature and decreased salinity (Figure 18A), which combine to make this layer progressively less dense. The layer of water below this did not change in density over this period (not shown). The larger size class of phytoplankton (which would include diatoms) decreased in abundance, while the smaller types of plankton increased (Figure 18B). In addition to the trends shown, nutrient content in the upper ocean water layer decreased. Abundance of microbes (bacteria and similar organisms) that subsist on organic matter increased. Total phytoplankton biomass, however, remained unchanged. If this trend towards smaller species of phytoplankton and microbes is sustained, it may lead to reduced production of zooplankton, an impact that would be transmitted through the food web to birds, fish and mammals. Published in the Life Linked to Ice released in 2013, page 30. Life Linked to Ice: A guide to sea-ice-associated biodiversity in this time of rapid change. CAFF Assessment Series No. 10. Conservation of Arctic Flora and Fauna, Iceland. ISBN: 978-9935-431-25-7.
-
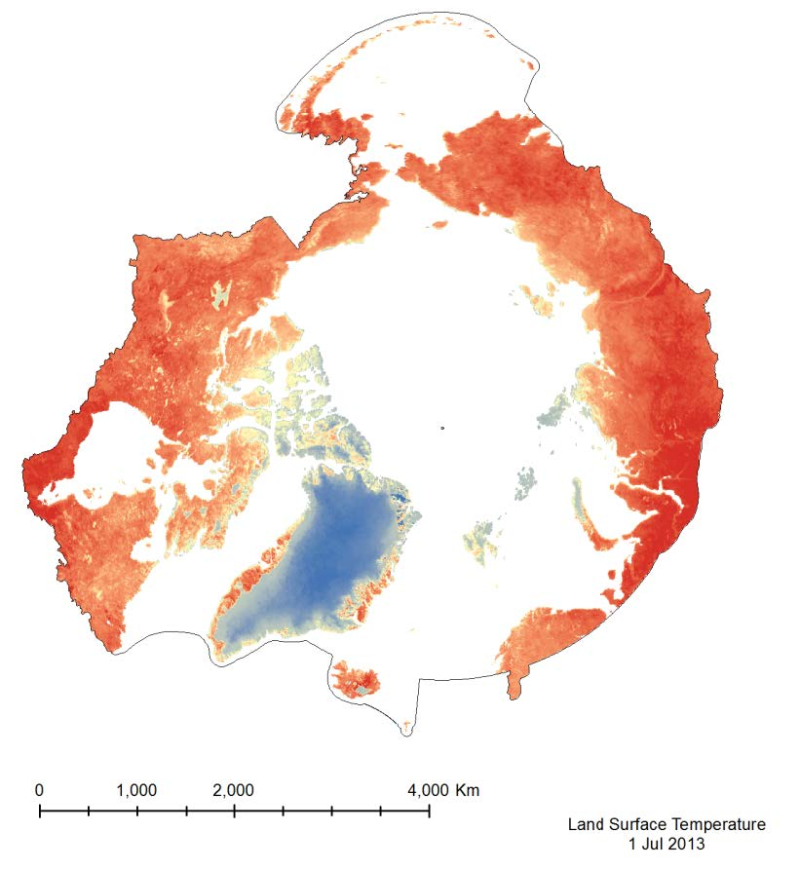
The MODIS Land Surface Temperature (LST) product provided is a monthlycomposite configured on a 0.05° Climate Model Grid (CMG). It includes both daytime andnighttime surface temperatures, taken at 11 um and 4 um (night). This product has beenscaled. To convert the raster values to a Kelvin temperature scale, multiply by a factor of 0.02.
-
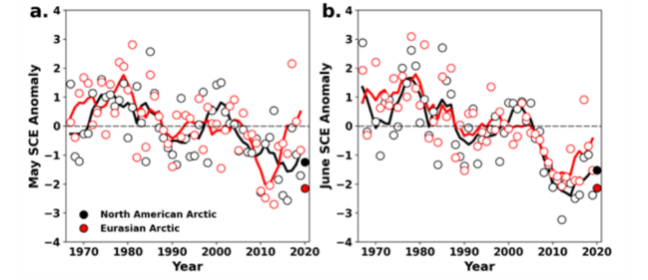
Monthly snow cover extent (SCE) for Arctic land areas (>60° N) for (a) May and (b) June 1967–2020, a 54-year record. Anomalies are relative to the 1981–2010 average and standardised (each observation was differenced from the mean and divided by the standard deviation, and thus unitless). Solid black and red lines depict 5-year running means for North America and Eurasia, respectively. Filled circles are used to highlight 2020 anomalies. (Mudryk et al. 2020). STATE OF THE ARCTIC TERRESTRIAL BIODIVERSITY REPORT - Chapter 2 - Page 23 - Figure 2.3