 Arctic Biodiversity Data Service - ABDS Catalog
zooplankton
Type of resources
Available actions
Topics
Keywords
Contact for the resource
Provided by
Representation types
Update frequencies
status
-
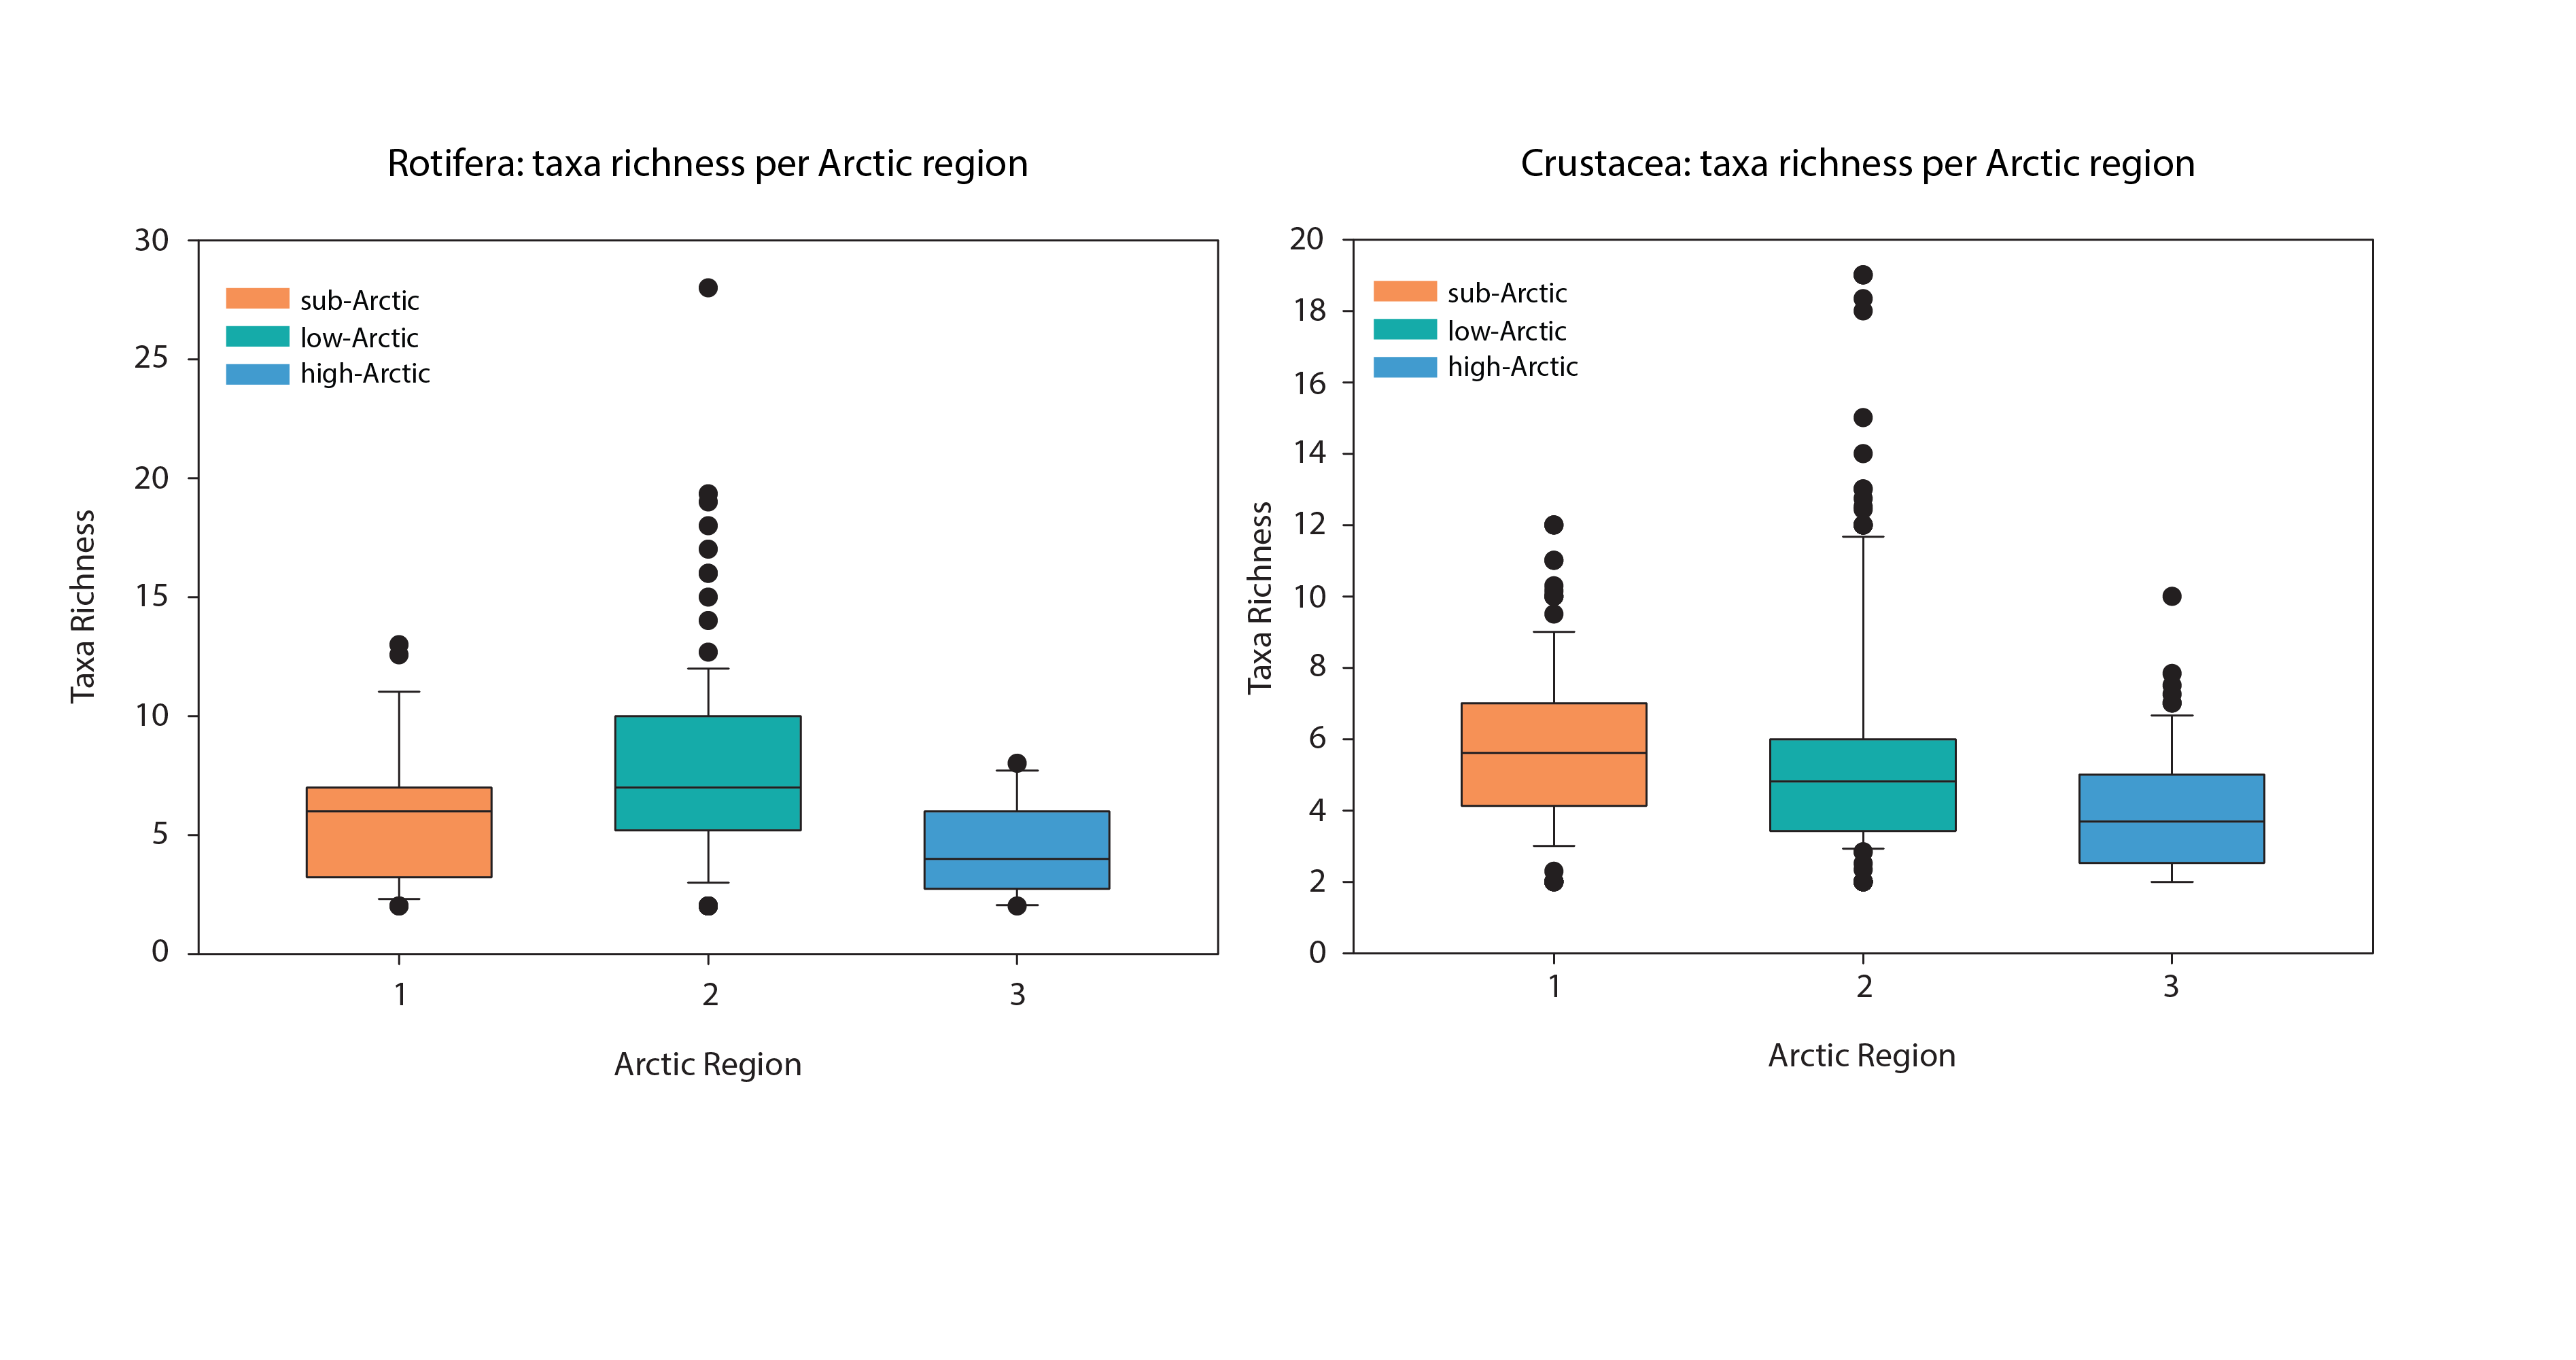
Box-plots of taxa richness (average per lake) by Arctic regions for rotifers (left) and crustaceans (right). Crustacean taxa are restricted to taxa within Calanoida, Cyclopoida and Cladocera. Samples with only a single taxon have been excluded. Boxes represent median and interquartile range. State of the Arctic Freshwater Biodiversity Report - Chapter 4 - Page 60 - Figure 4-27
-
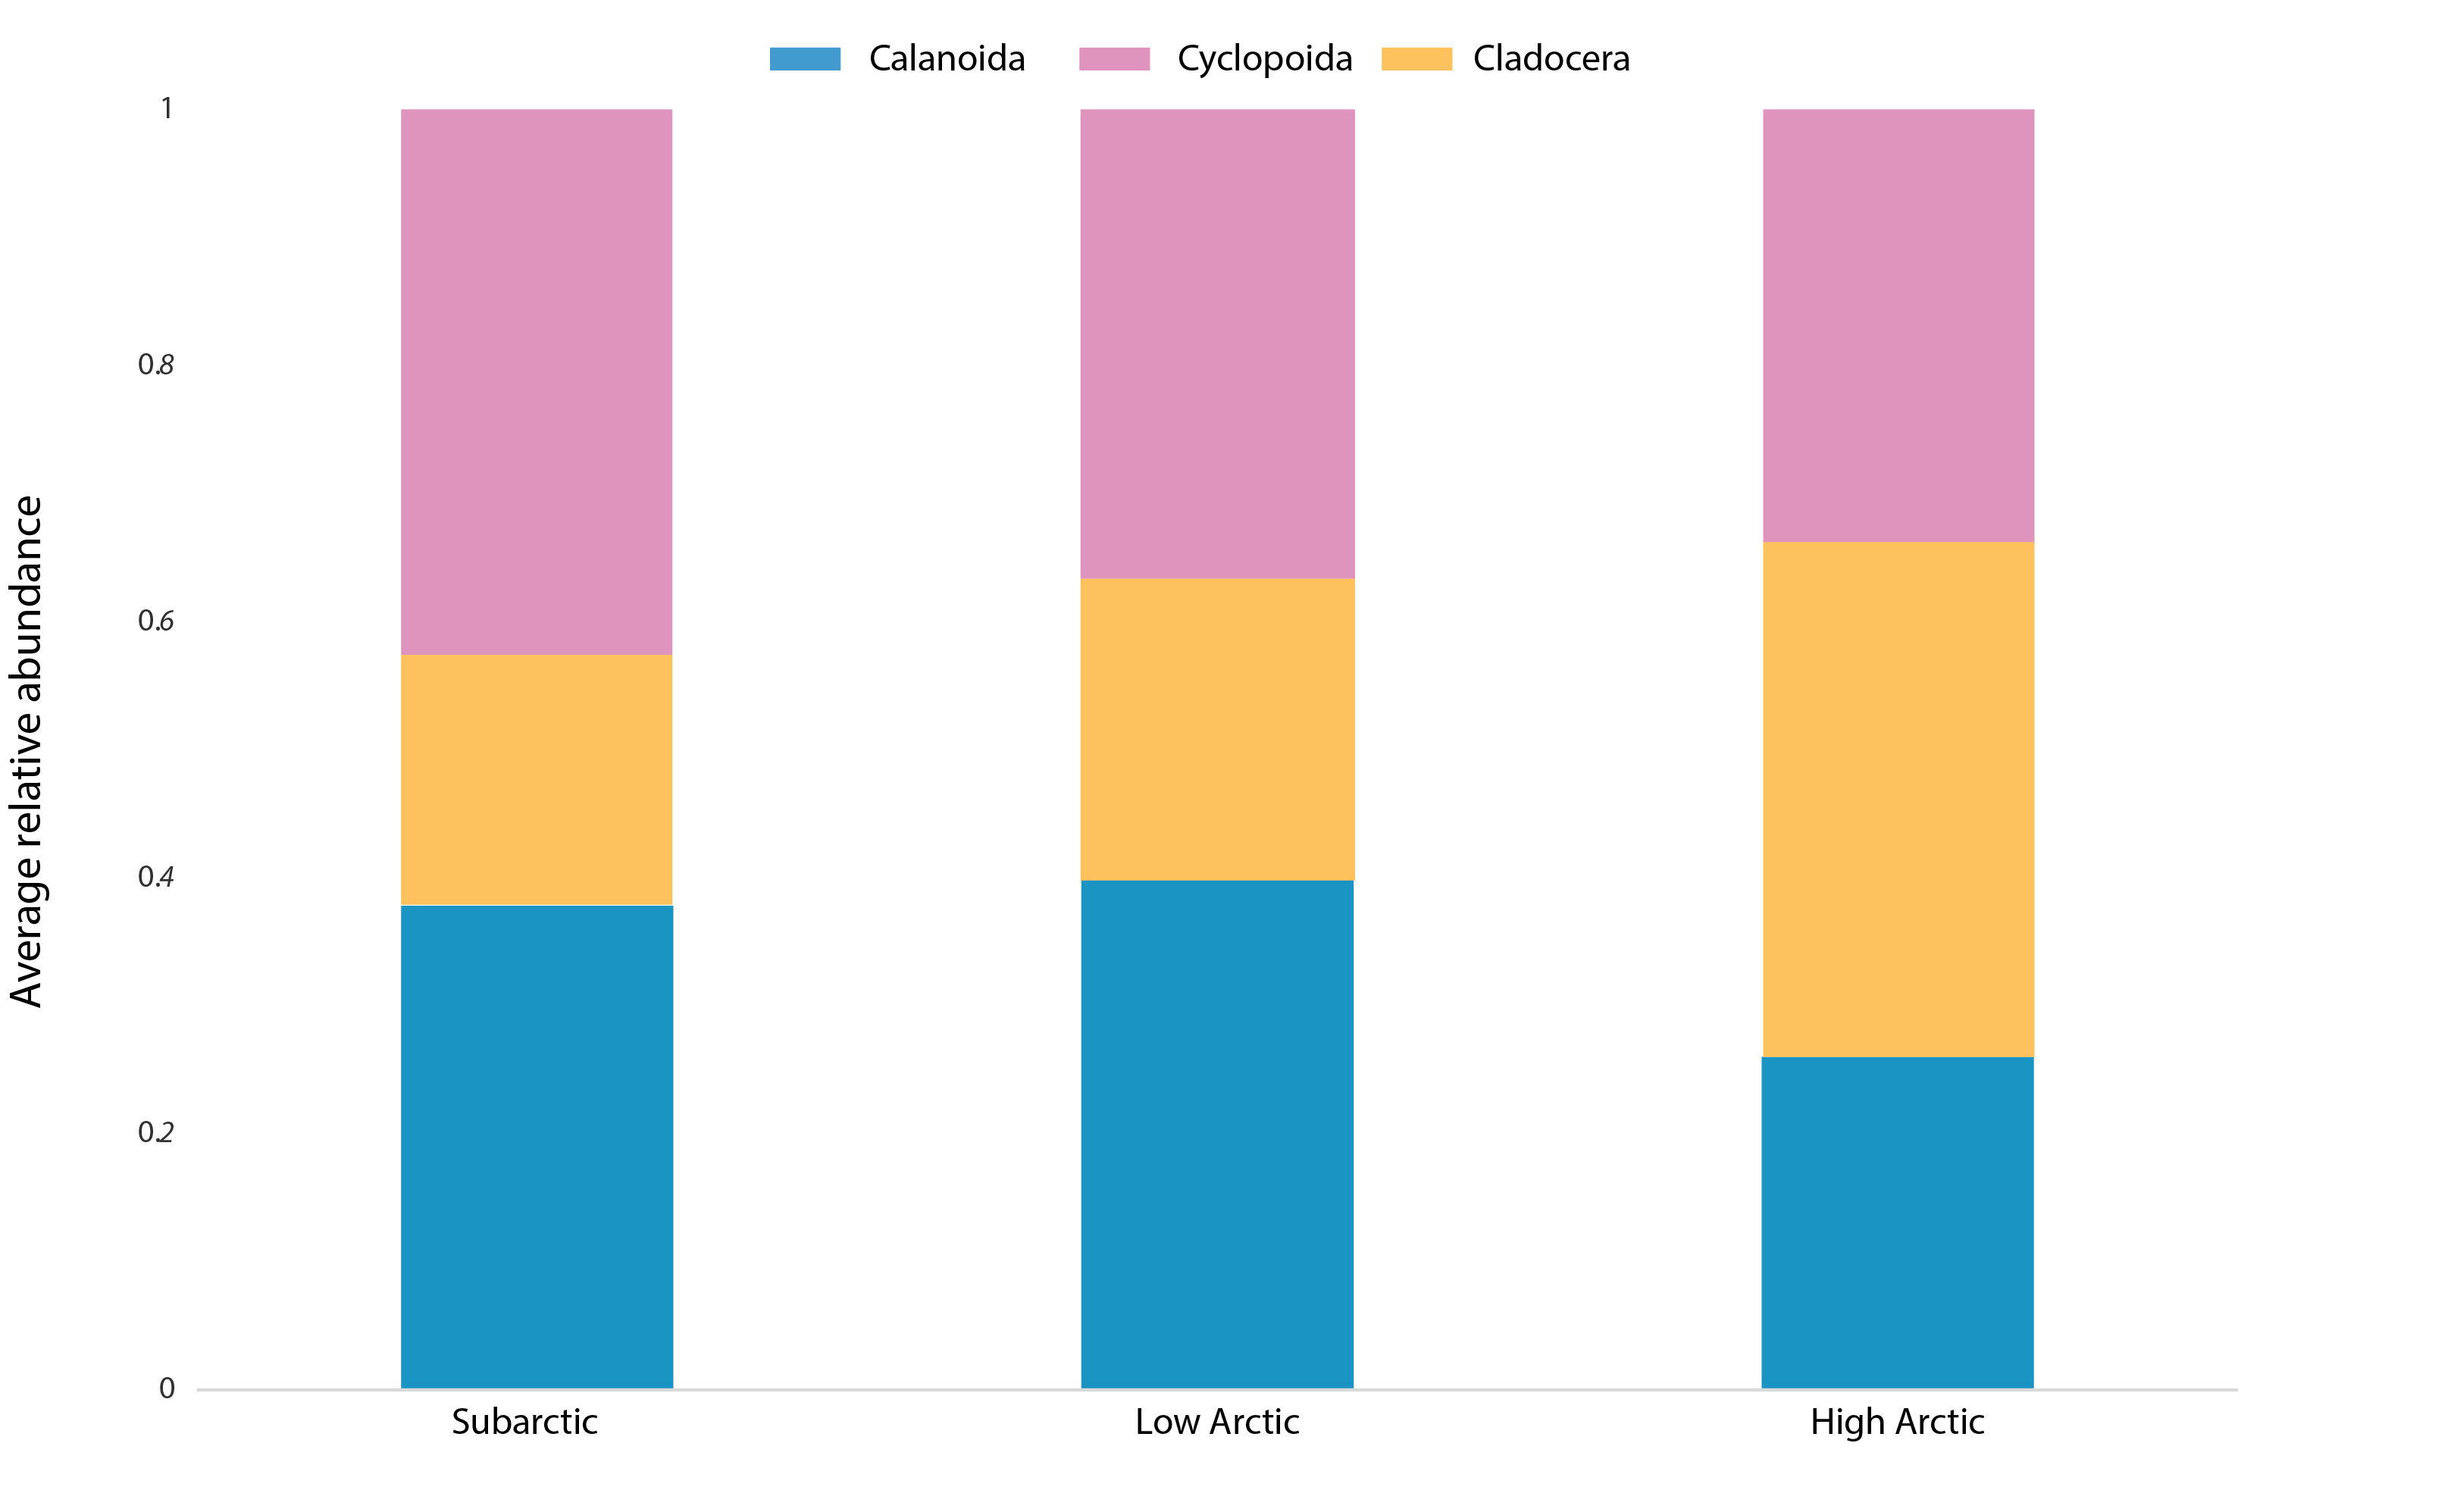
Average relative abundance of the main zooplankton groups (calanoid copepods, cyclopoid copepods, cladocerans) for the sub-Arctic (n=150), low- Arctic (n=154), and high-Arctic (n=55) regions. Samples with a single taxon have been excluded. State of the Arctic Freshwater Biodiversity Report - Chapter 4 - Page 61 - Figure 4-28
-
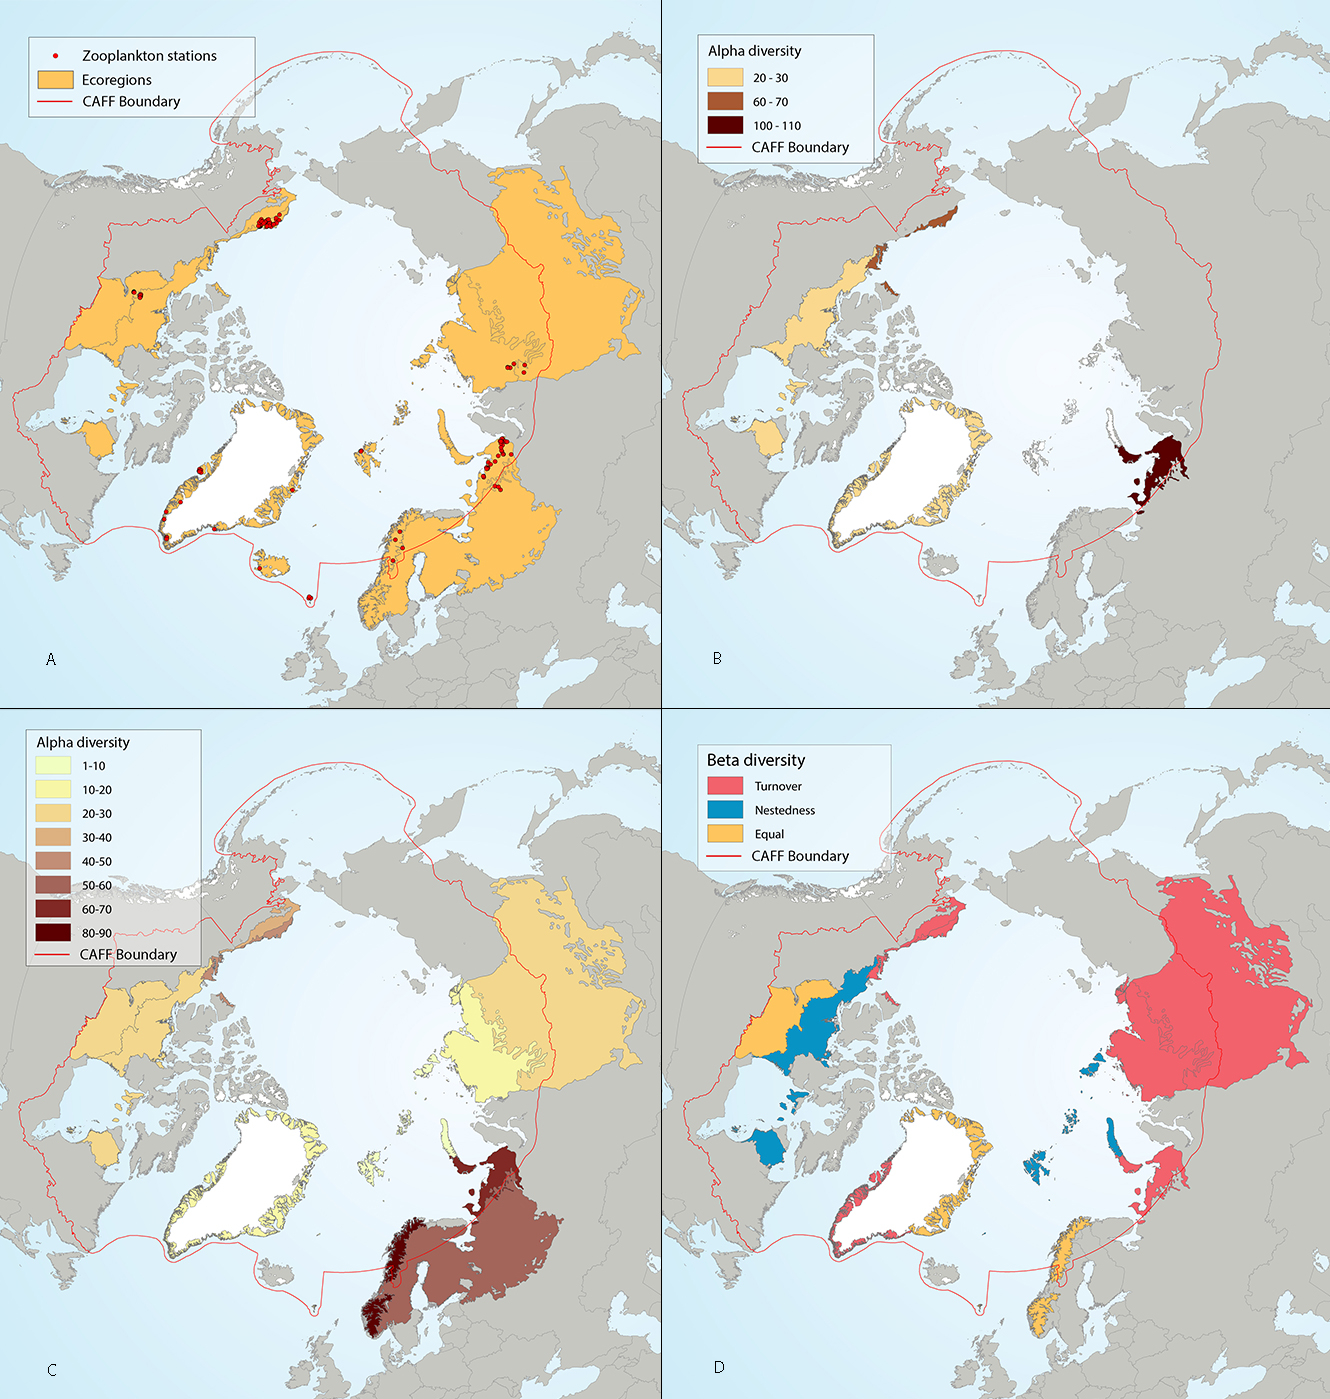
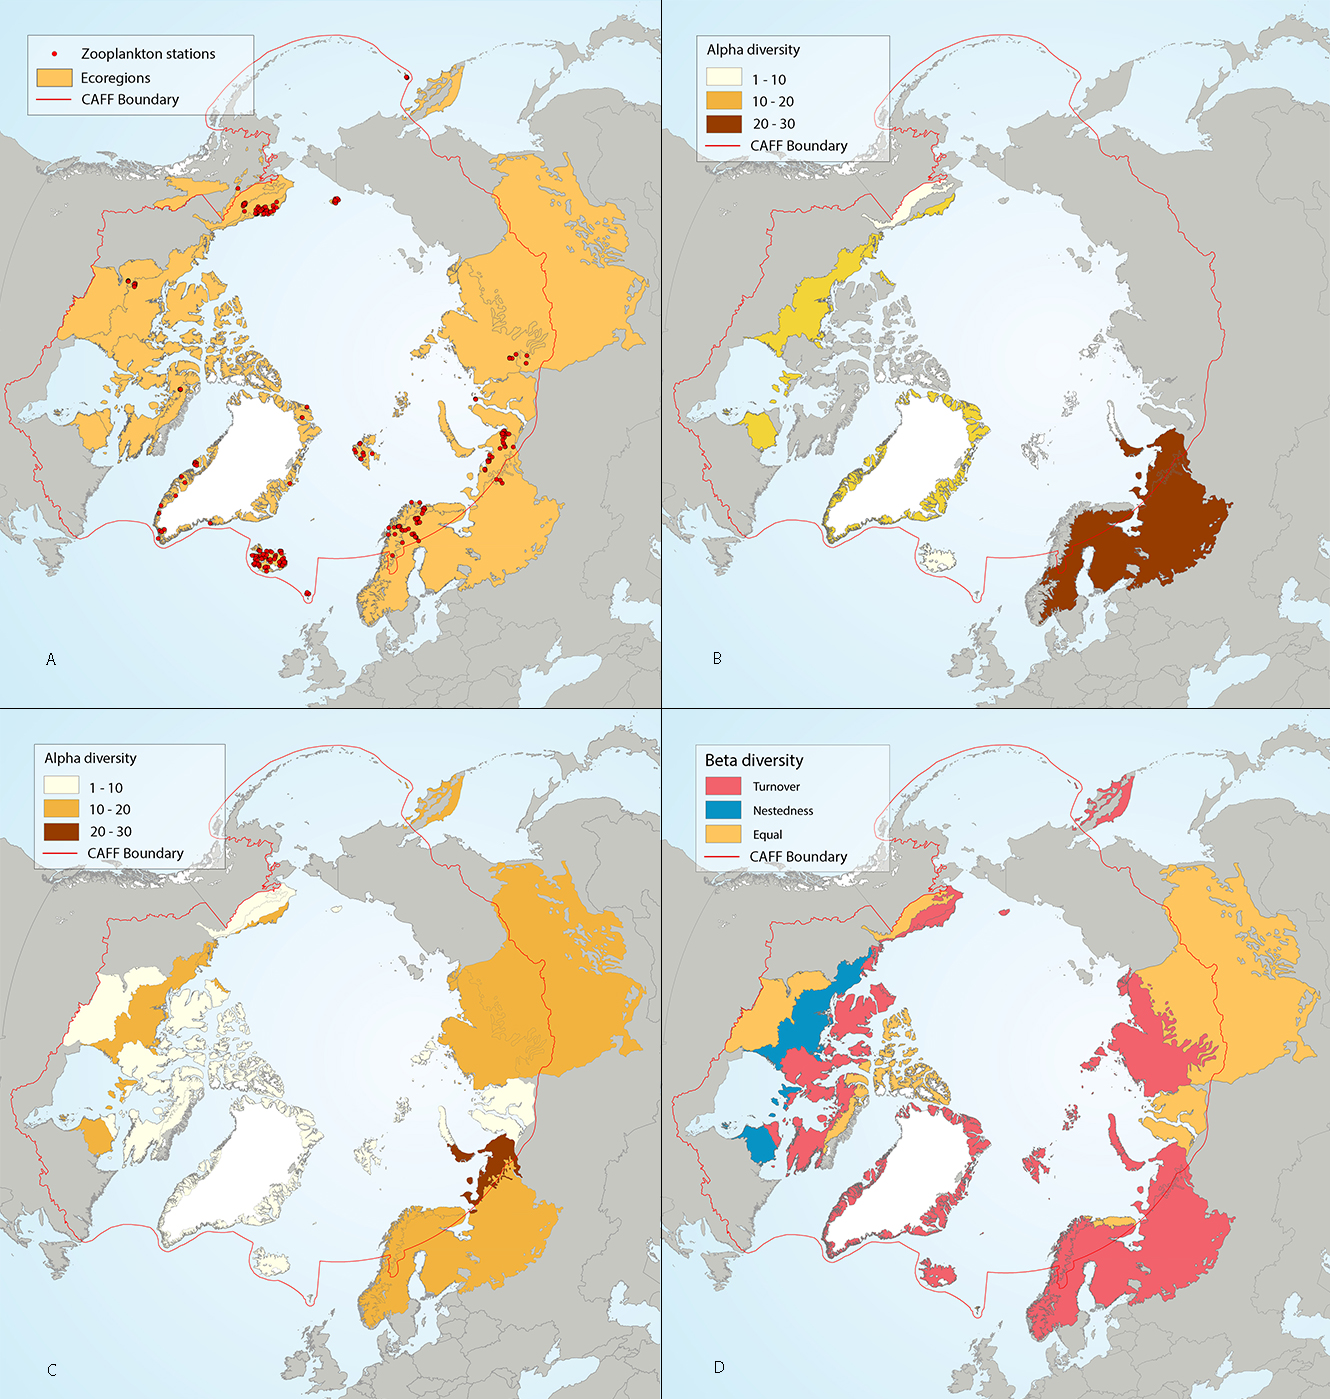
Results of circumpolar assessment of lake zooplankton, including crustaceans and rotifers, and indicating (a) the location of zooplankton stations, underlain by circumpolar ecoregions; (b) ecoregions with many zooplankton stations, colored on the basis of alpha diversity rarefied to 25 stations; (c) all ecoregions with zooplankton stations, colored on the basis of alpha diversity rarefied to 10 stations; (d) ecoregions with at least two stations in a hydrobasin, colored on the basis of the dominant component of beta diversity (species turnover, nestedness, approximately equal contribution, or no diversity) when averaged across hydrobasins in each ecoregion. State of the Arctic Freshwater Biodiversity Report - Chapter 4- Page 59 - Figure 4-26
-
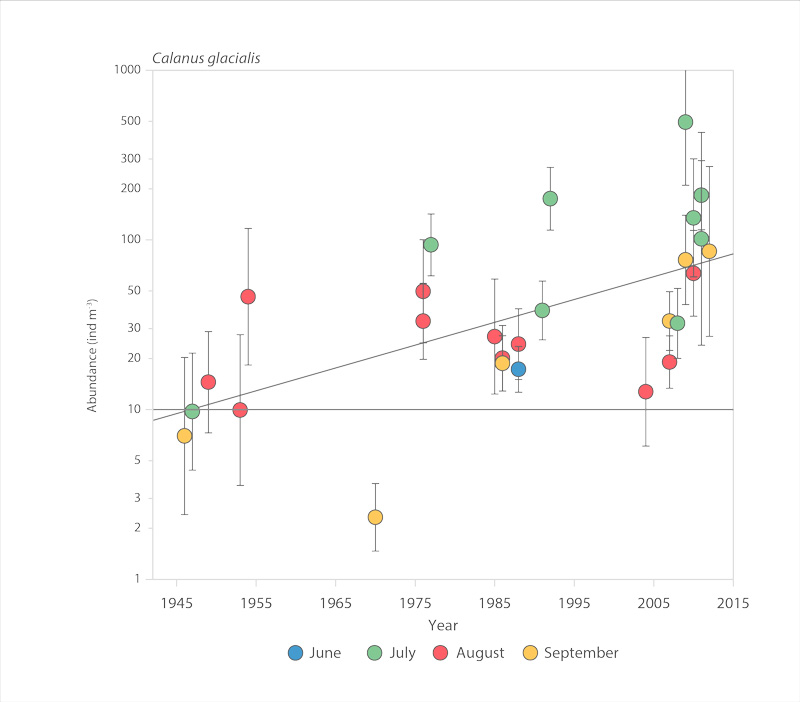
Abundance of the copepod Calanus glacialis in the Chukchi Sea, 1945-2012 (after Ershova et al. 2015b). STATE OF THE ARCTIC MARINE BIODIVERSITY REPORT - <a href="https://arcticbiodiversity.is/findings/plankton" target="_blank">Chapter 3</a> - Page 75 - Figure 3.2.6
-
Results of circumpolar assessment of lake zooplankton, focused just on crustaceans, and indicating (a) the location of crustacean zooplankton stations, underlain by circumpolar ecoregions; (b) ecoregions with many crustacean zooplankton stations, colored on the basis of alpha diversity rarefied to 25 stations; (c) all ecoregions with crustacean zooplankton stations, colored on the basis of alpha diversity rarefied to 10 stations; (d) ecoregions with at least two stations in a hydrobasin, colored on the basis of the dominant component of beta diversity (species turnover, nestedness, approximately equal contribution, or no diversity) when averaged across hydrobasins in each ecoregion. State of the Arctic Freshwater Biodiversity Report - Chapter 4 - Page 58 - Figure 4-25