 Arctic Biodiversity Data Service - ABDS Catalog
unknown
Type of resources
Available actions
Topics
Keywords
Contact for the resource
Provided by
Years
Formats
Representation types
Update frequencies
status
Scale
-
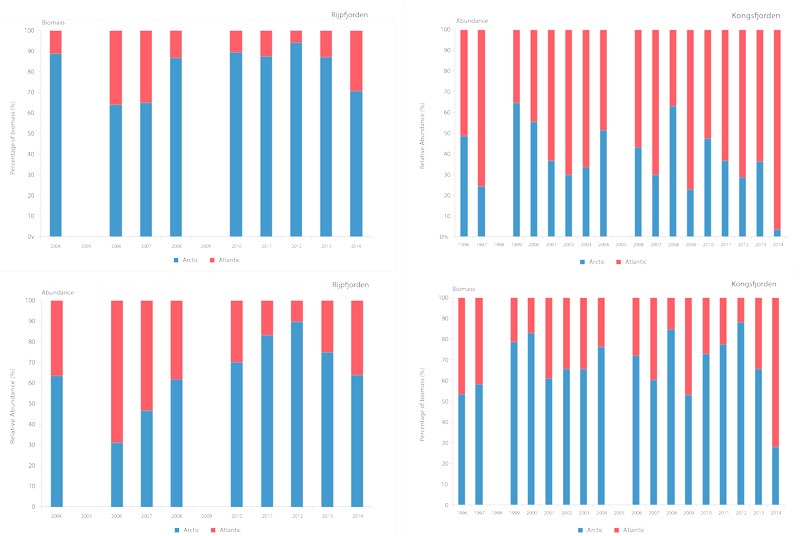
Time series of relative proportions of Arctic and Atlantic Calanus species in Kongsfjorden (top) and Rijpfjorden (bottom) (Source: MOSJ, Norwegian Polar Institute). STATE OF THE ARCTIC MARINE BIODIVERSITY REPORT - <a href="https://arcticbiodiversity.is/findings/plankton" target="_blank">Chapter 3</a> - Page 77 - Figure 3.2.8
-
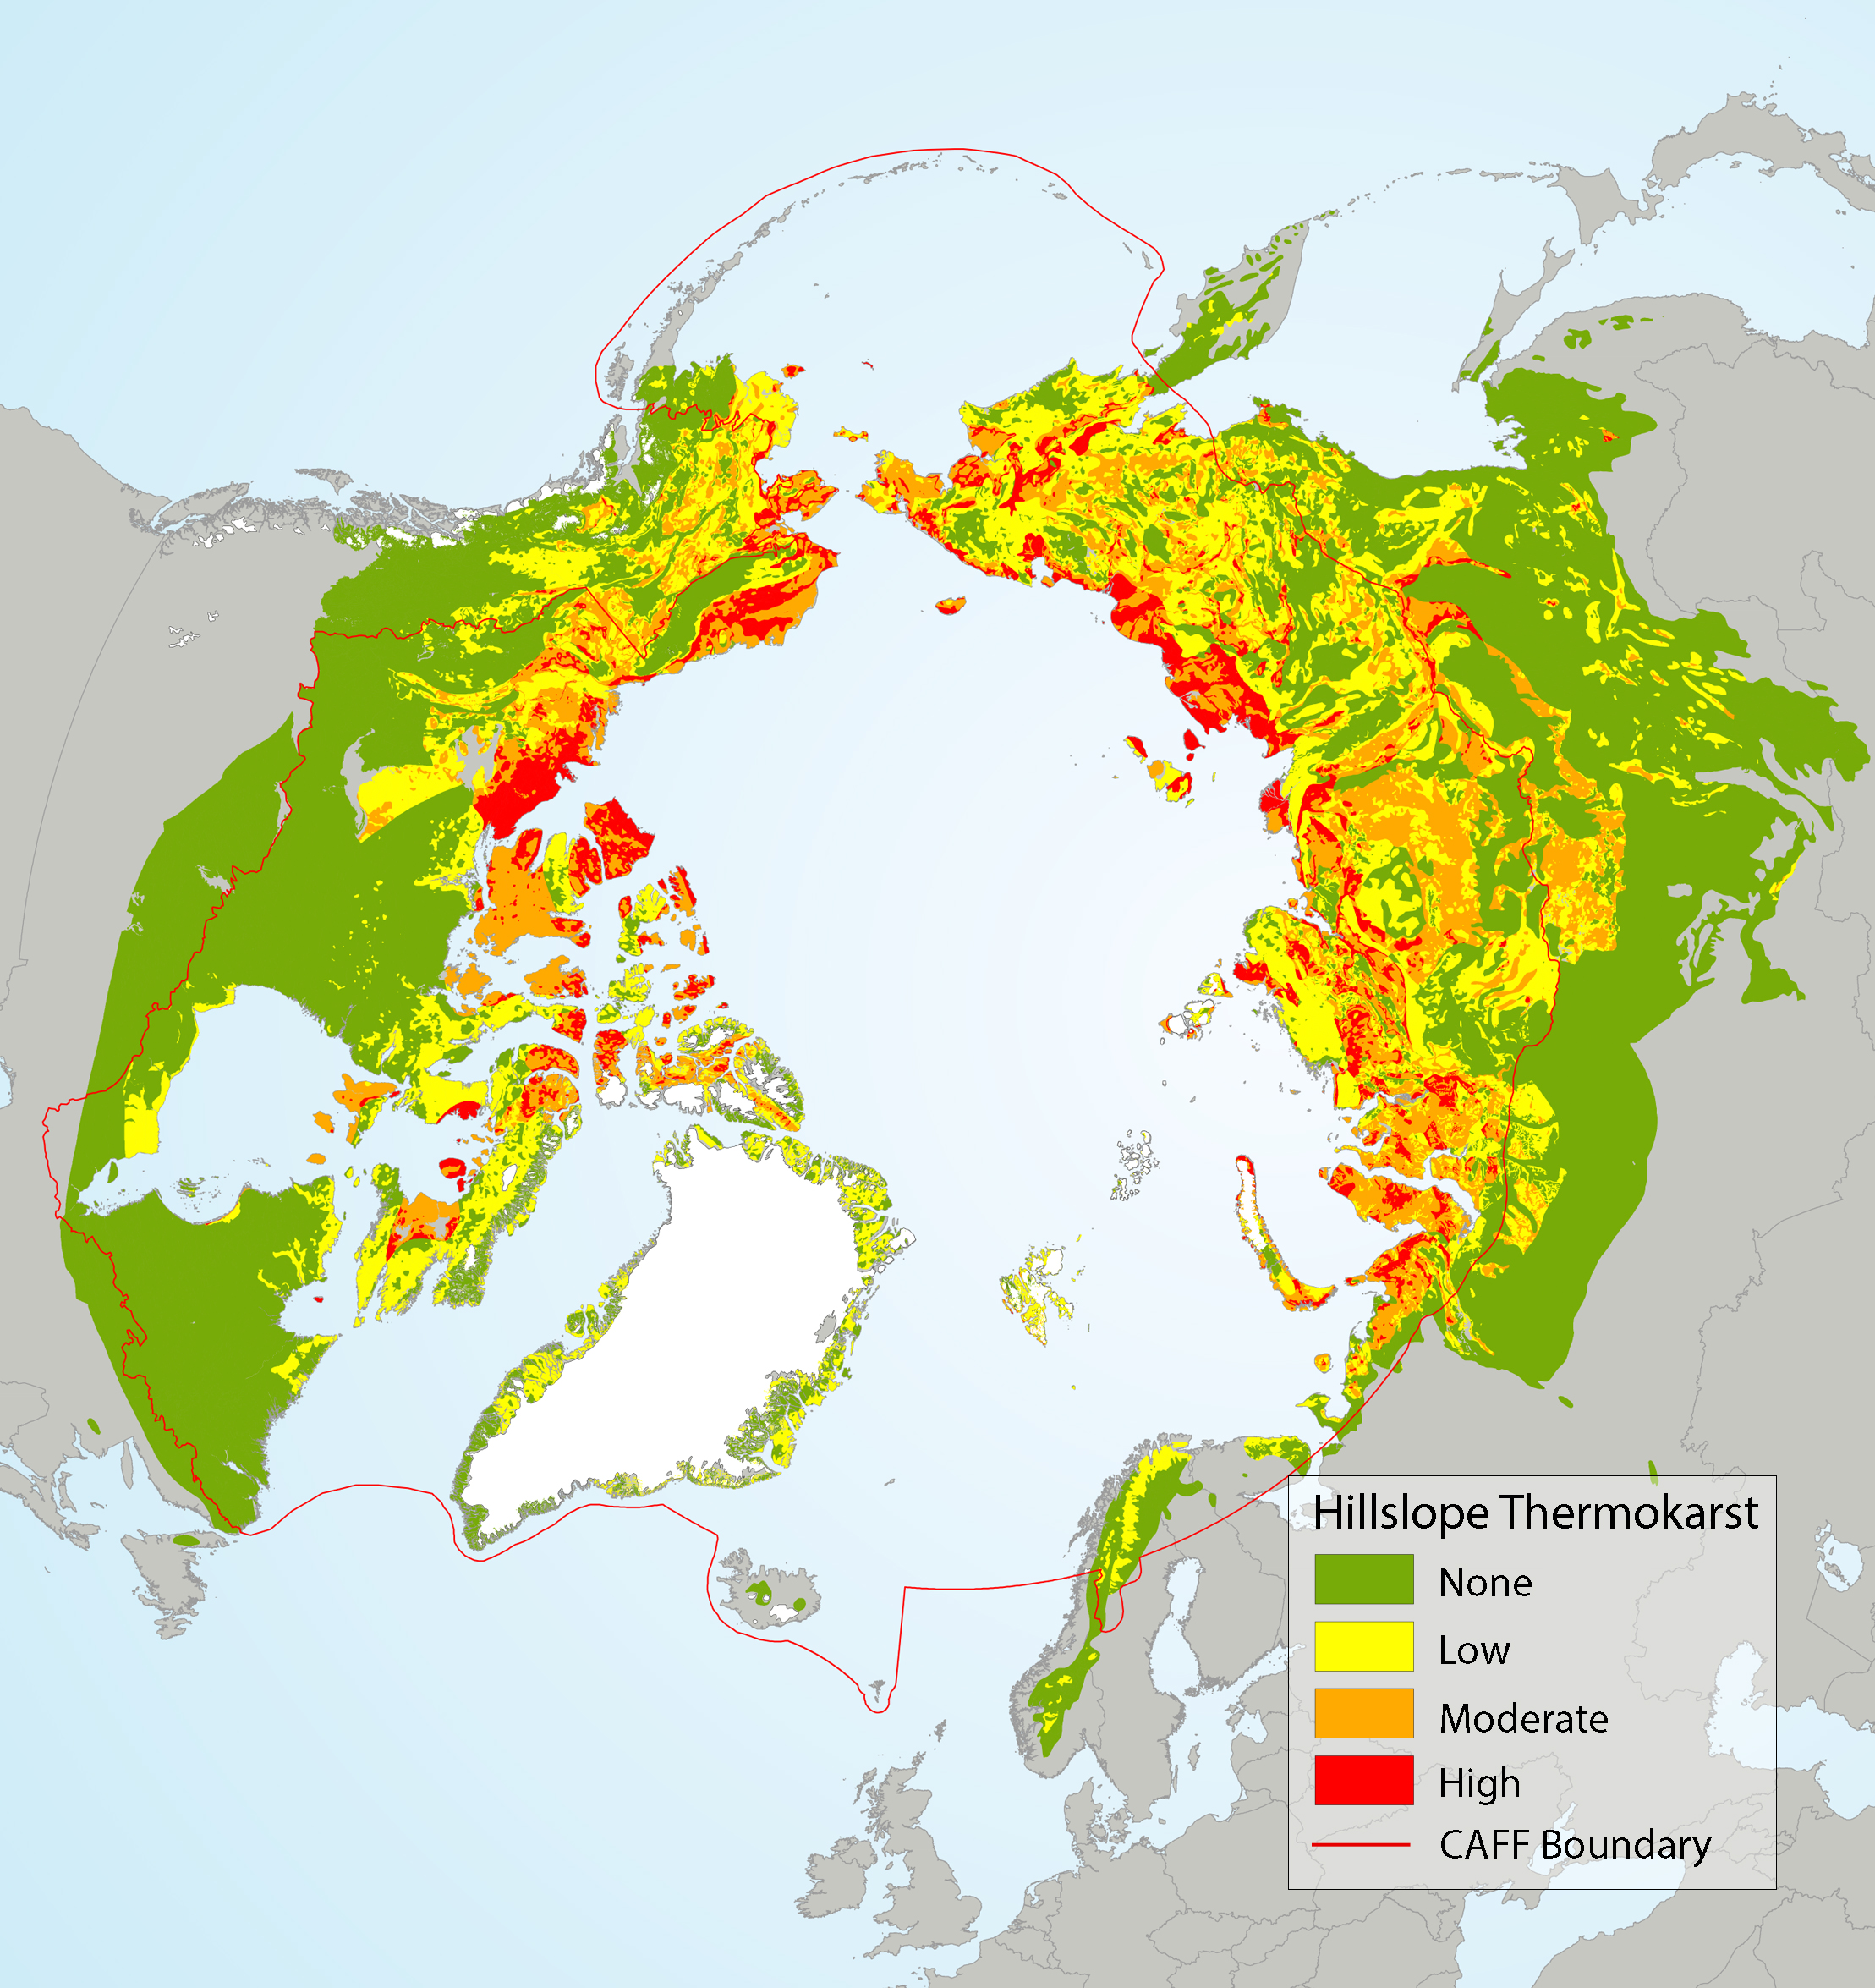
Spatial distribution of hillslope thermokarst across the circumpolar area, overlain with ecoregions used in the SAFBR analysis, showing no, low, moderate, and high thermokarst. Source for thermokarst layer: Olefeldt et al. (2016) State of the Arctic Freshwater Biodiversity Report - Chapter 4 - Page 90 - Figure 5-7
-
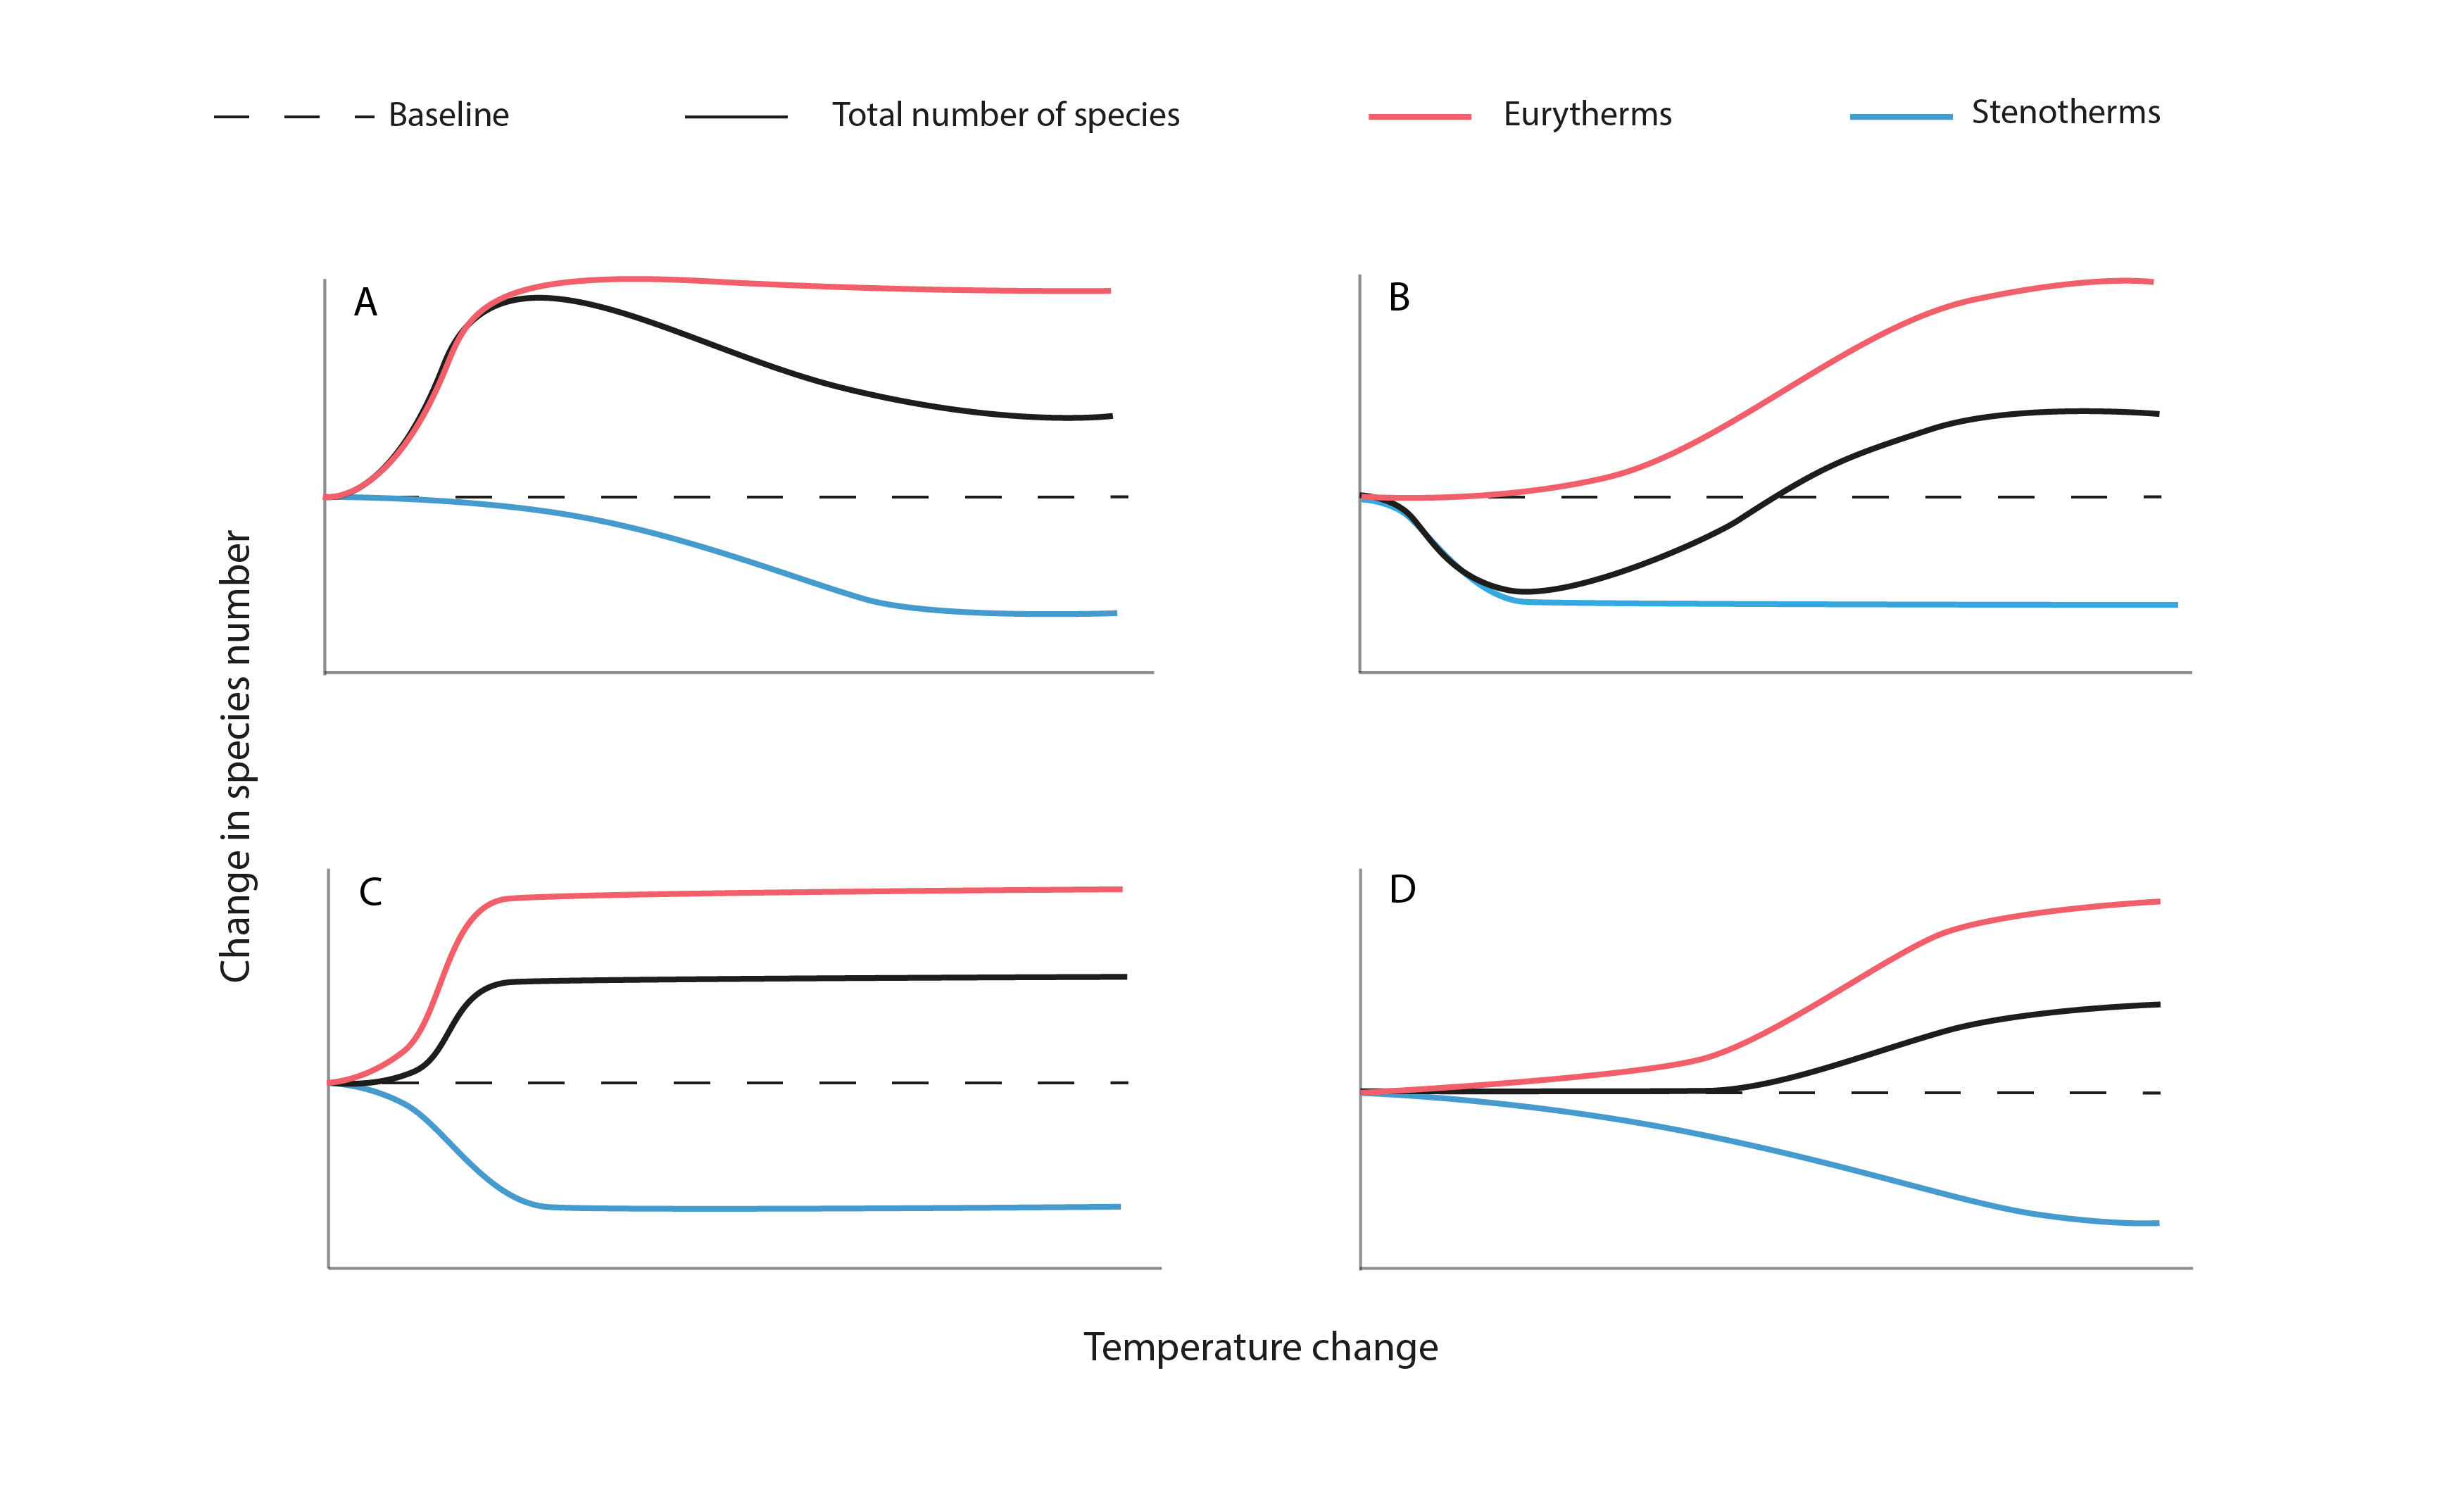
Figure 3-6. The hypothesized effects of rising mean water temperature on biodiversity (as total species number) of Arctic freshwater ecosystems. A pulsed increase in gamma biodiversity (a) results from the combination of high eurythermal invasion and establishment and low stenothermic loss with increasing water temperature. A pulsed decrease in gamma biodiversity (b) results from the combination of low eurythermal invasion and establishment and high stenothermic loss. Rapid increases (c) and slow increases (d) in species diversity occur, respectively, with high eurythermal invasion and establishment coupled with high stenothermic loss or low eurythermal invasion and establishment and low stenothermic loss as temperatures increase. For simplification, barriers to dispersal have been assumed to be limited in these models. State of the Arctic Freshwater Biodiversity Report - Chapter 3 - Page 23 - Figure 3-6
-

Trends in total abundance of moths and species richness, from two locations in Iceland, 1995–2016. Trends differ between locations. The solid and dashed straight lines represent linear regression lines which are significant or non-significant, respectively. Modified from Gillespie et al. 2020a. STATE OF THE ARCTIC TERRESTRIAL BIODIVERSITY REPORT - Chapter 3 - Page 41 - Figure 3.14
-
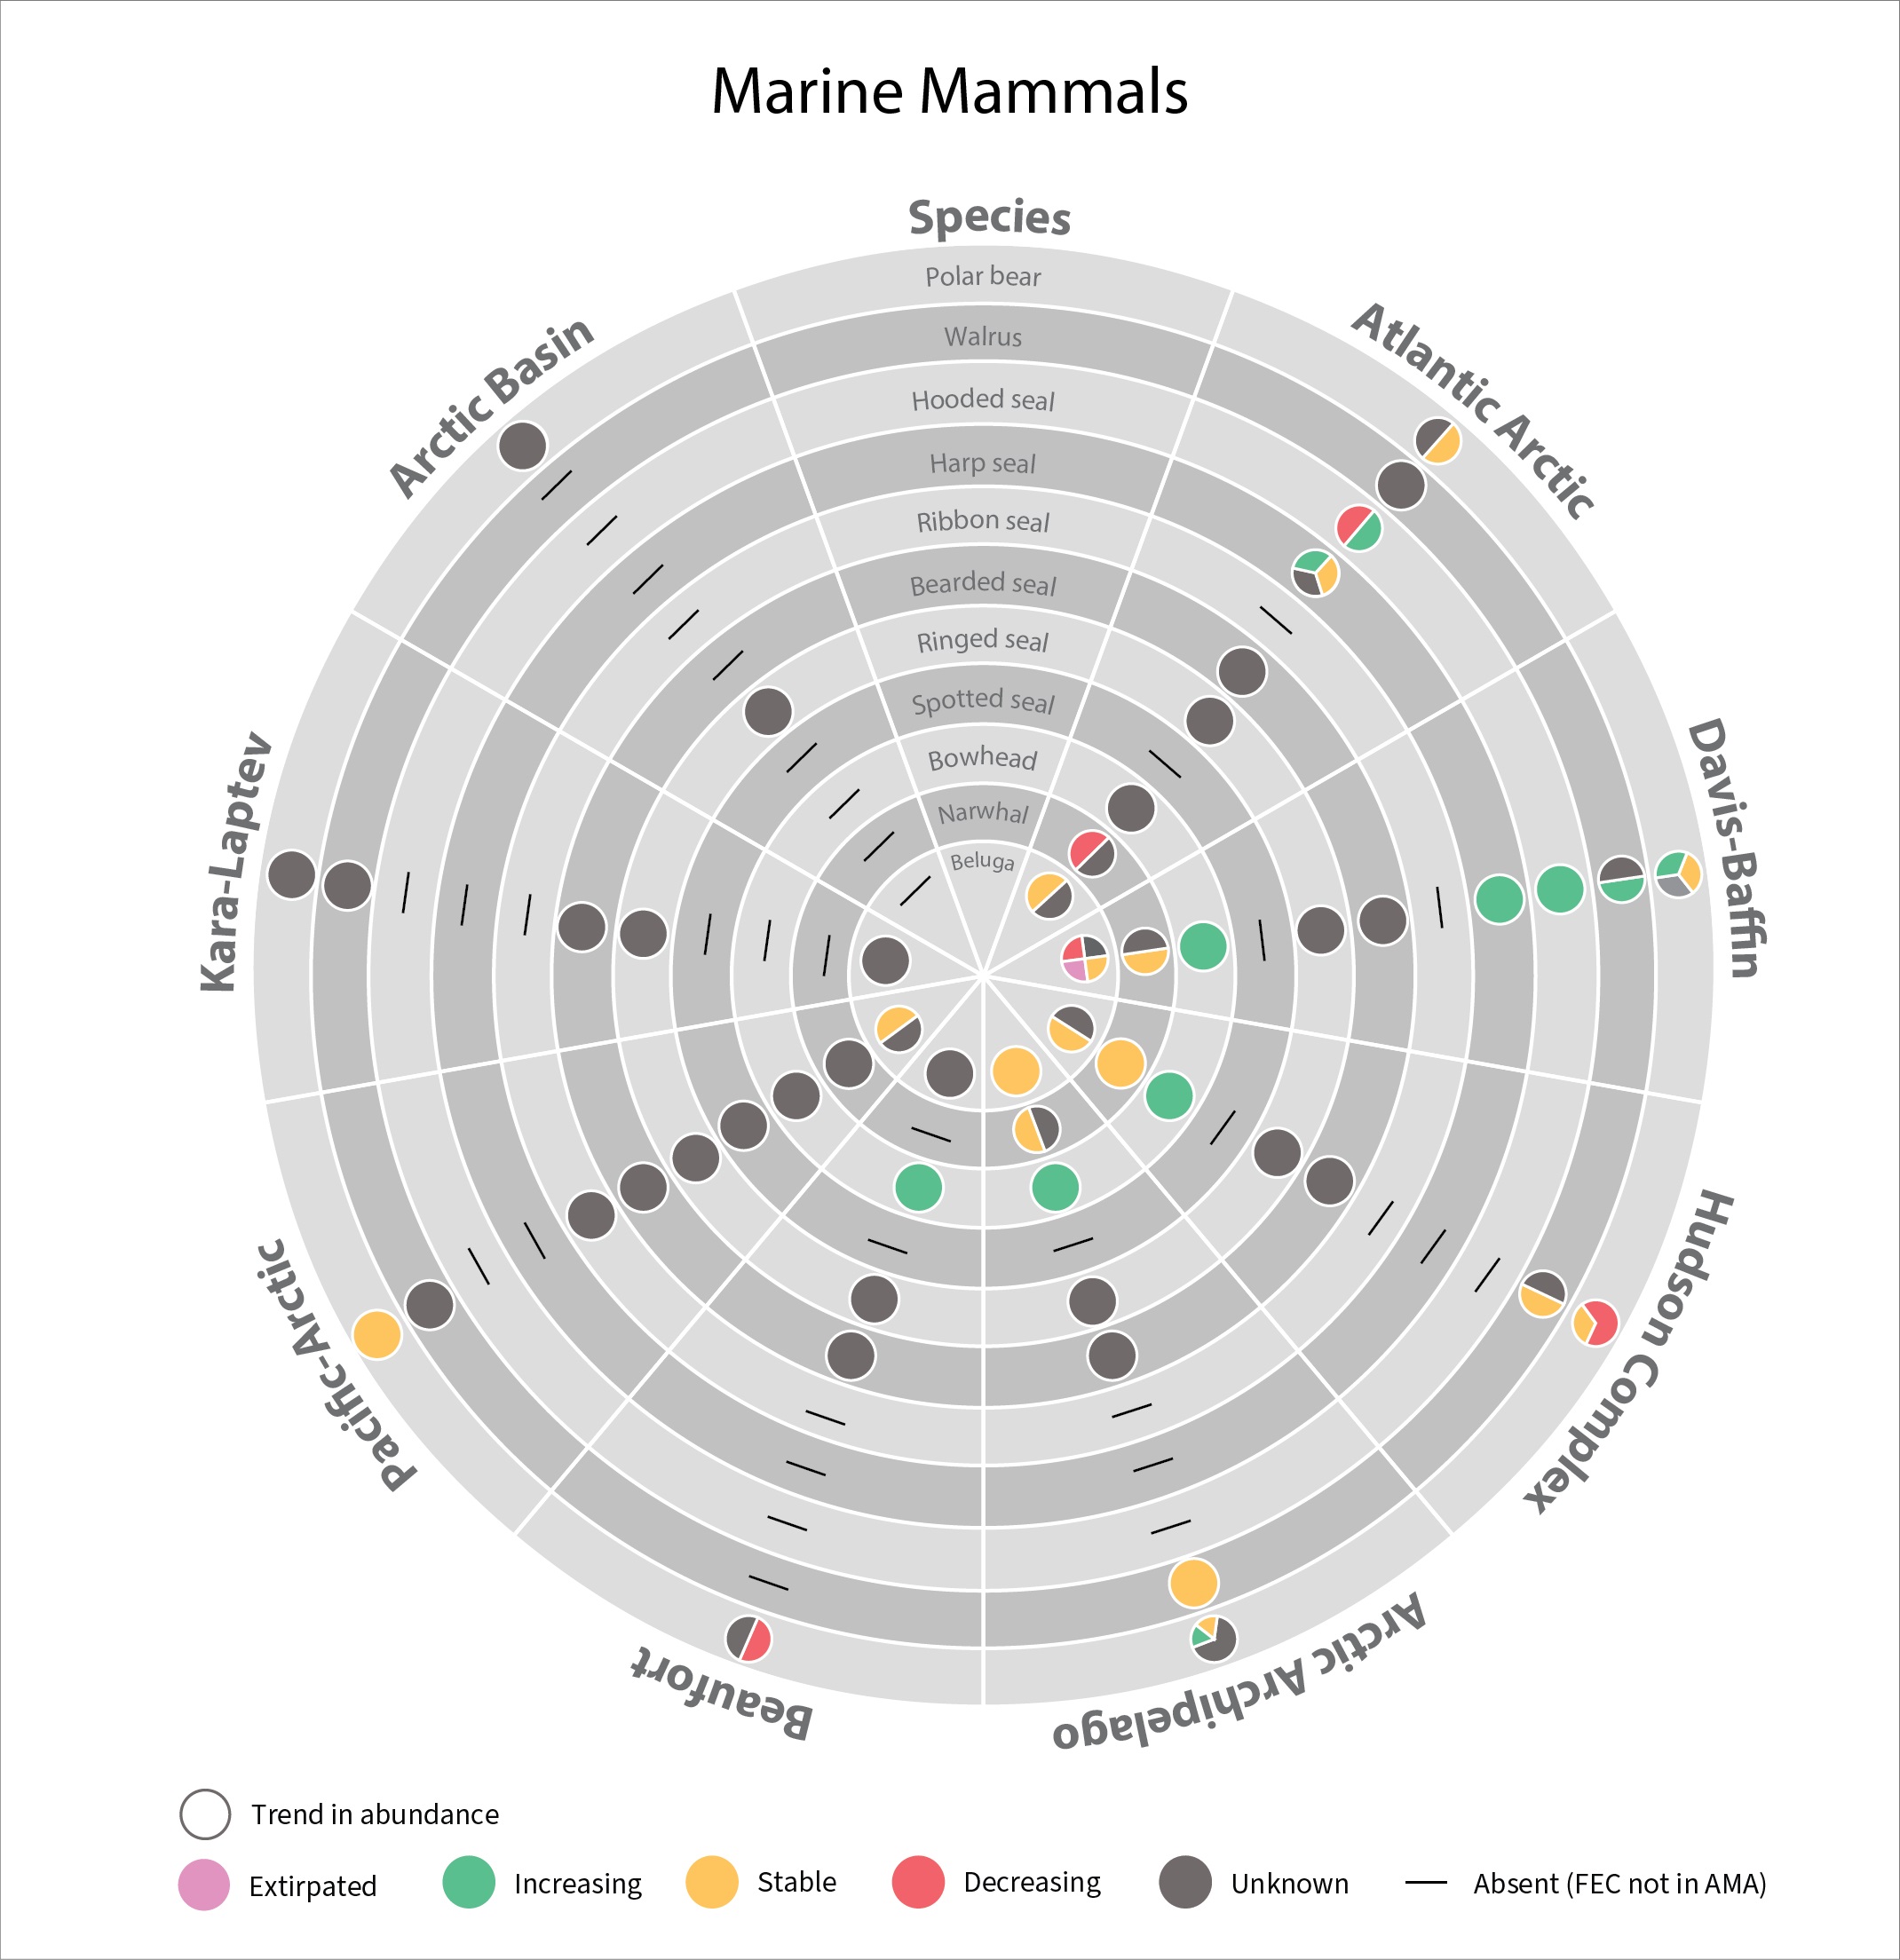
In 2017 the SAMBR synthesized data about biodiversity in Arctic marine ecosystems around the circumpolar Arctic.. SAMBR highlighted observed changes and relevant monitoring gaps. This 2021 update provides information on the status of marine mammals in the Arctic from 2015–2020: More detail can be found in the Marine Mammals 2021 Technical report. STATE OF THE ARCTIC MARINE BIODIVERSITY REPORT
-
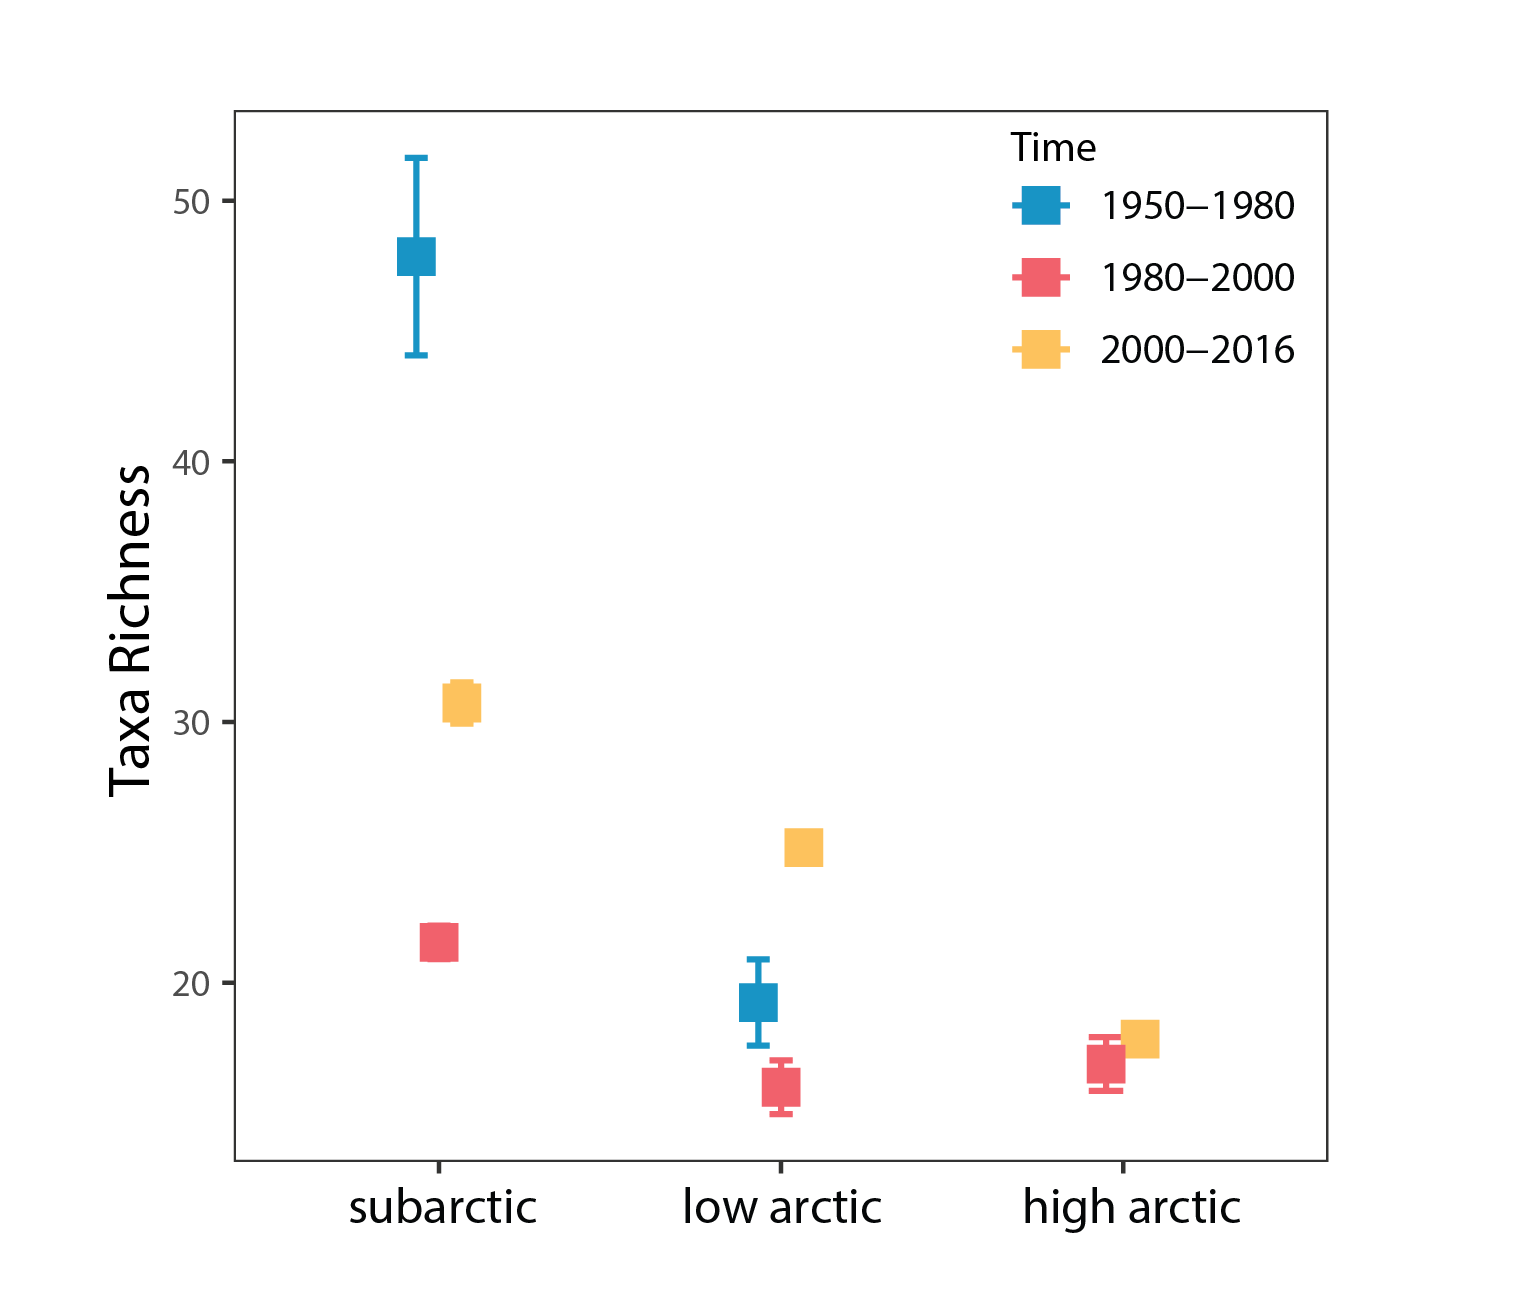
Phytoplankton species richness averaged by time periods ±SE in each Arctic region. State of the Arctic Freshwater Biodiversity Report - Chapter 4 - Page 49 - Figure 4-20
-
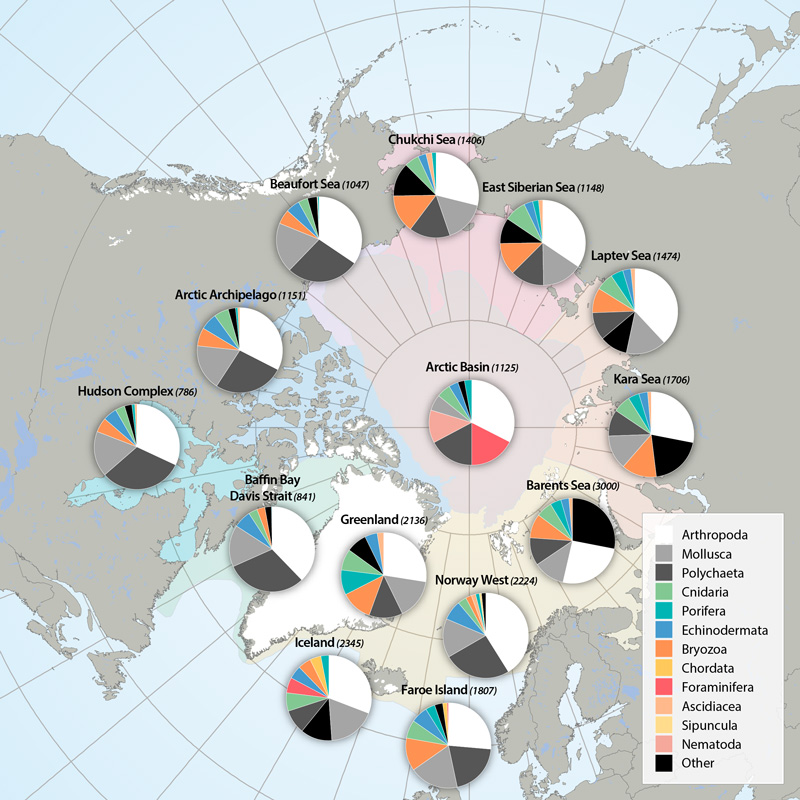
Arthropods (e.g., shrimps, crabs, sea spiders, amphipods, isopods) dominate taxon numbers in all Arctic regions, followed by polychaetes (e.g., bristle worms) and mollusks (e.g., gastropods, bivalves). Other taxon groups are diverse in some regions, such as bryozoans in the Kara Sea, cnidarians in the Atlantic Arctic, and foraminiferans in the Arctic deep-sea basins. This pattern is biased, however, by the meiofauna inclusion for the Arctic Basin (macro- and meiofauna size ranges overlap substantially in deep-sea fauna, so nematodes and foraminiferans are included) and the influence of a lack of specialists for some difficult taxonomic groups. STATE OF THE ARCTIC MARINE BIODIVERSITY REPORT - <a href="https://arcticbiodiversity.is/findings/benthos" target="_blank">Chapter 3</a> - Page 89 - Box figure 3.3.1 Each region of the Pan Arctic has been sampled with a set of different sampling gears, including grab, sledge and trawl, while other areas has only been sampled with grab. Here is the complete species/taxa number and the % distribution of species/taxa in main phyla, per region of the Pan Arctic.
-
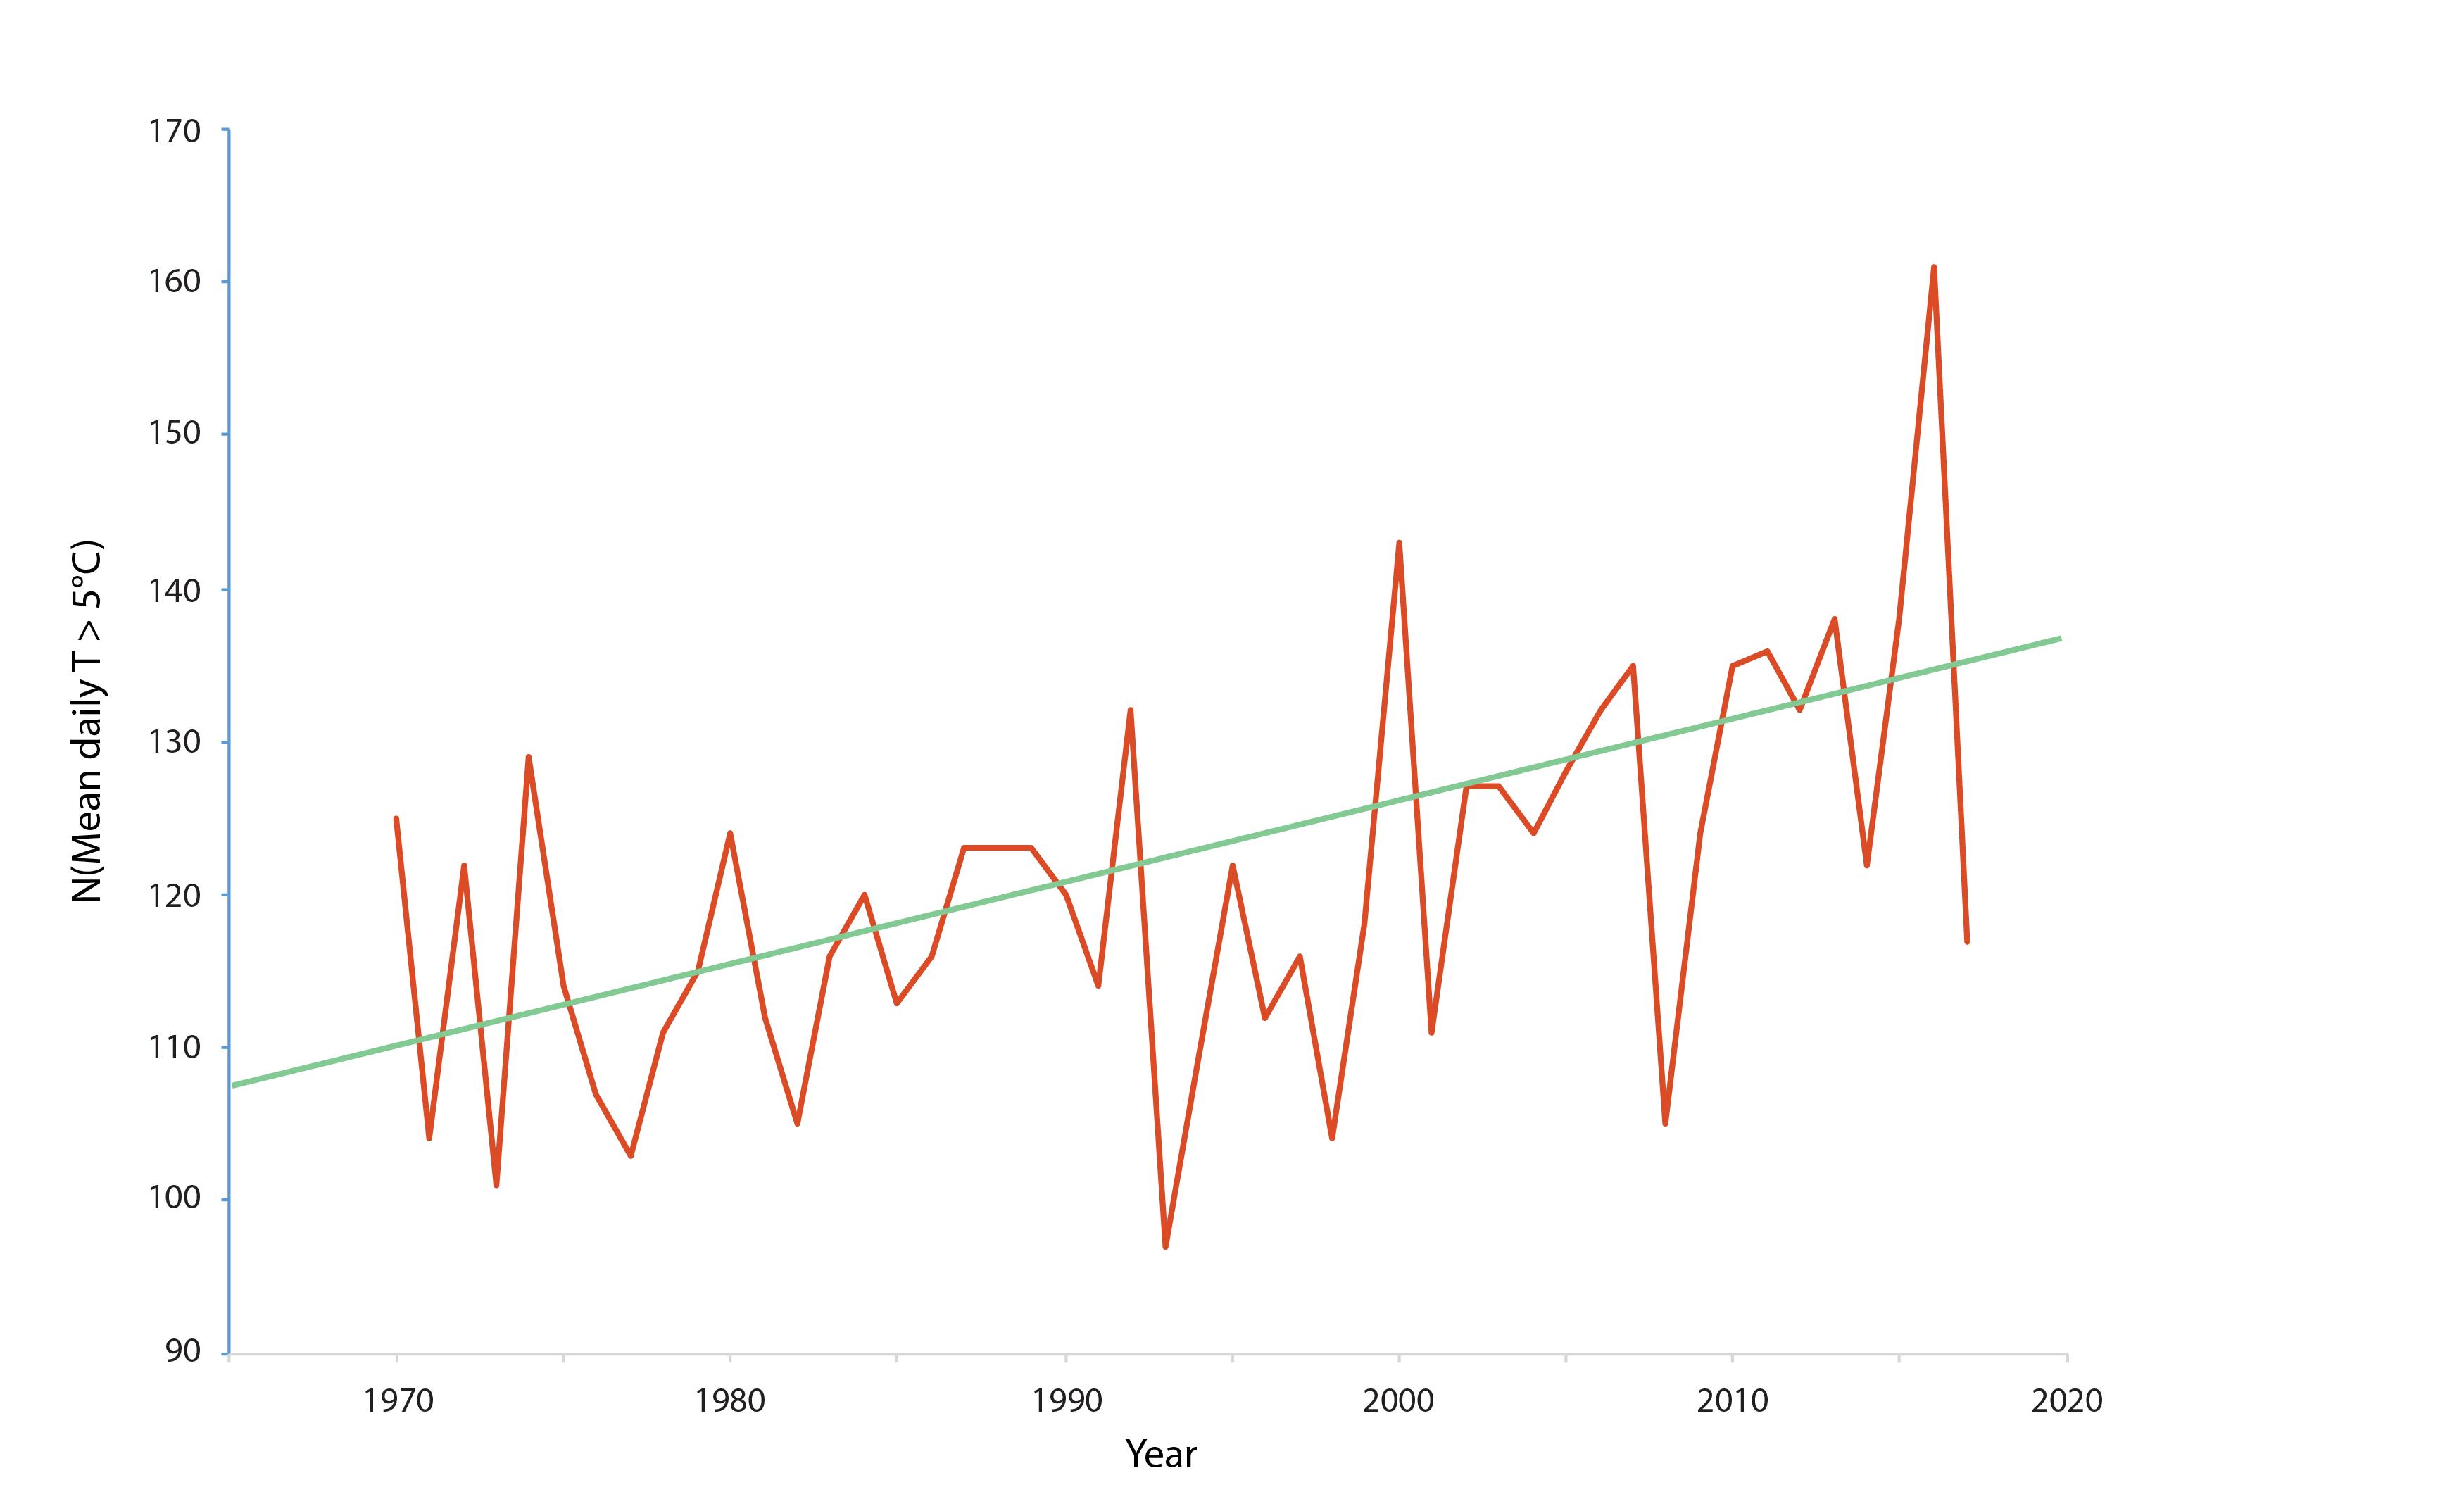
Figure 3-2 Long-term water temperature trends (1970–2017) for the Utsjoki Nuorgam station in the River Tana (69°N in Finland). The diagram shows the number of days per year with a mean temperature exceeding 5°C. The data show that from 1995 to 2017, this indicator increased by over 0.5 days per year. Data source: Finnish Meteorological Institute. State of the Arctic Freshwater Biodiversity Report - Chapter 3 - Page 15 - Figure 2-1
-
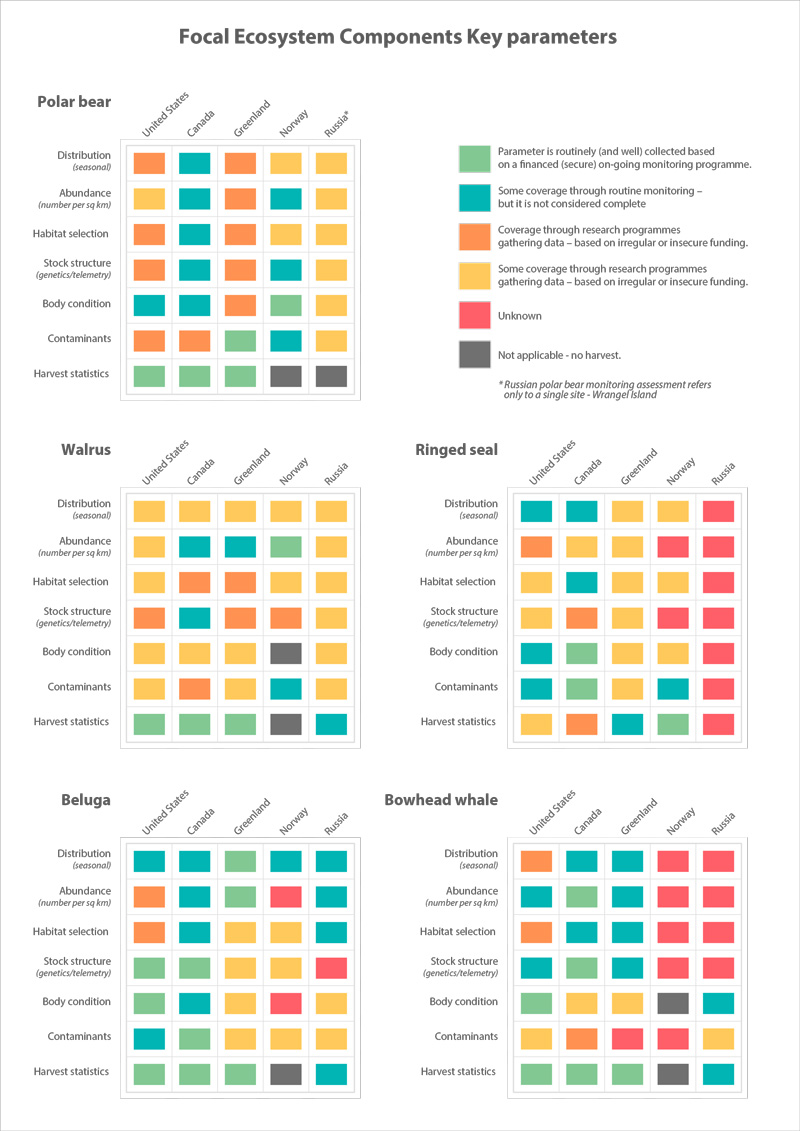
Assessment of monitoring implementation STATE OF THE ARCTIC MARINE BIODIVERSITY REPORT - <a href="https://arcticbiodiversity.is/findings/marine-mammals" target="_blank">Chapter 3</a> - Page 168 - Table 3.6.2
-
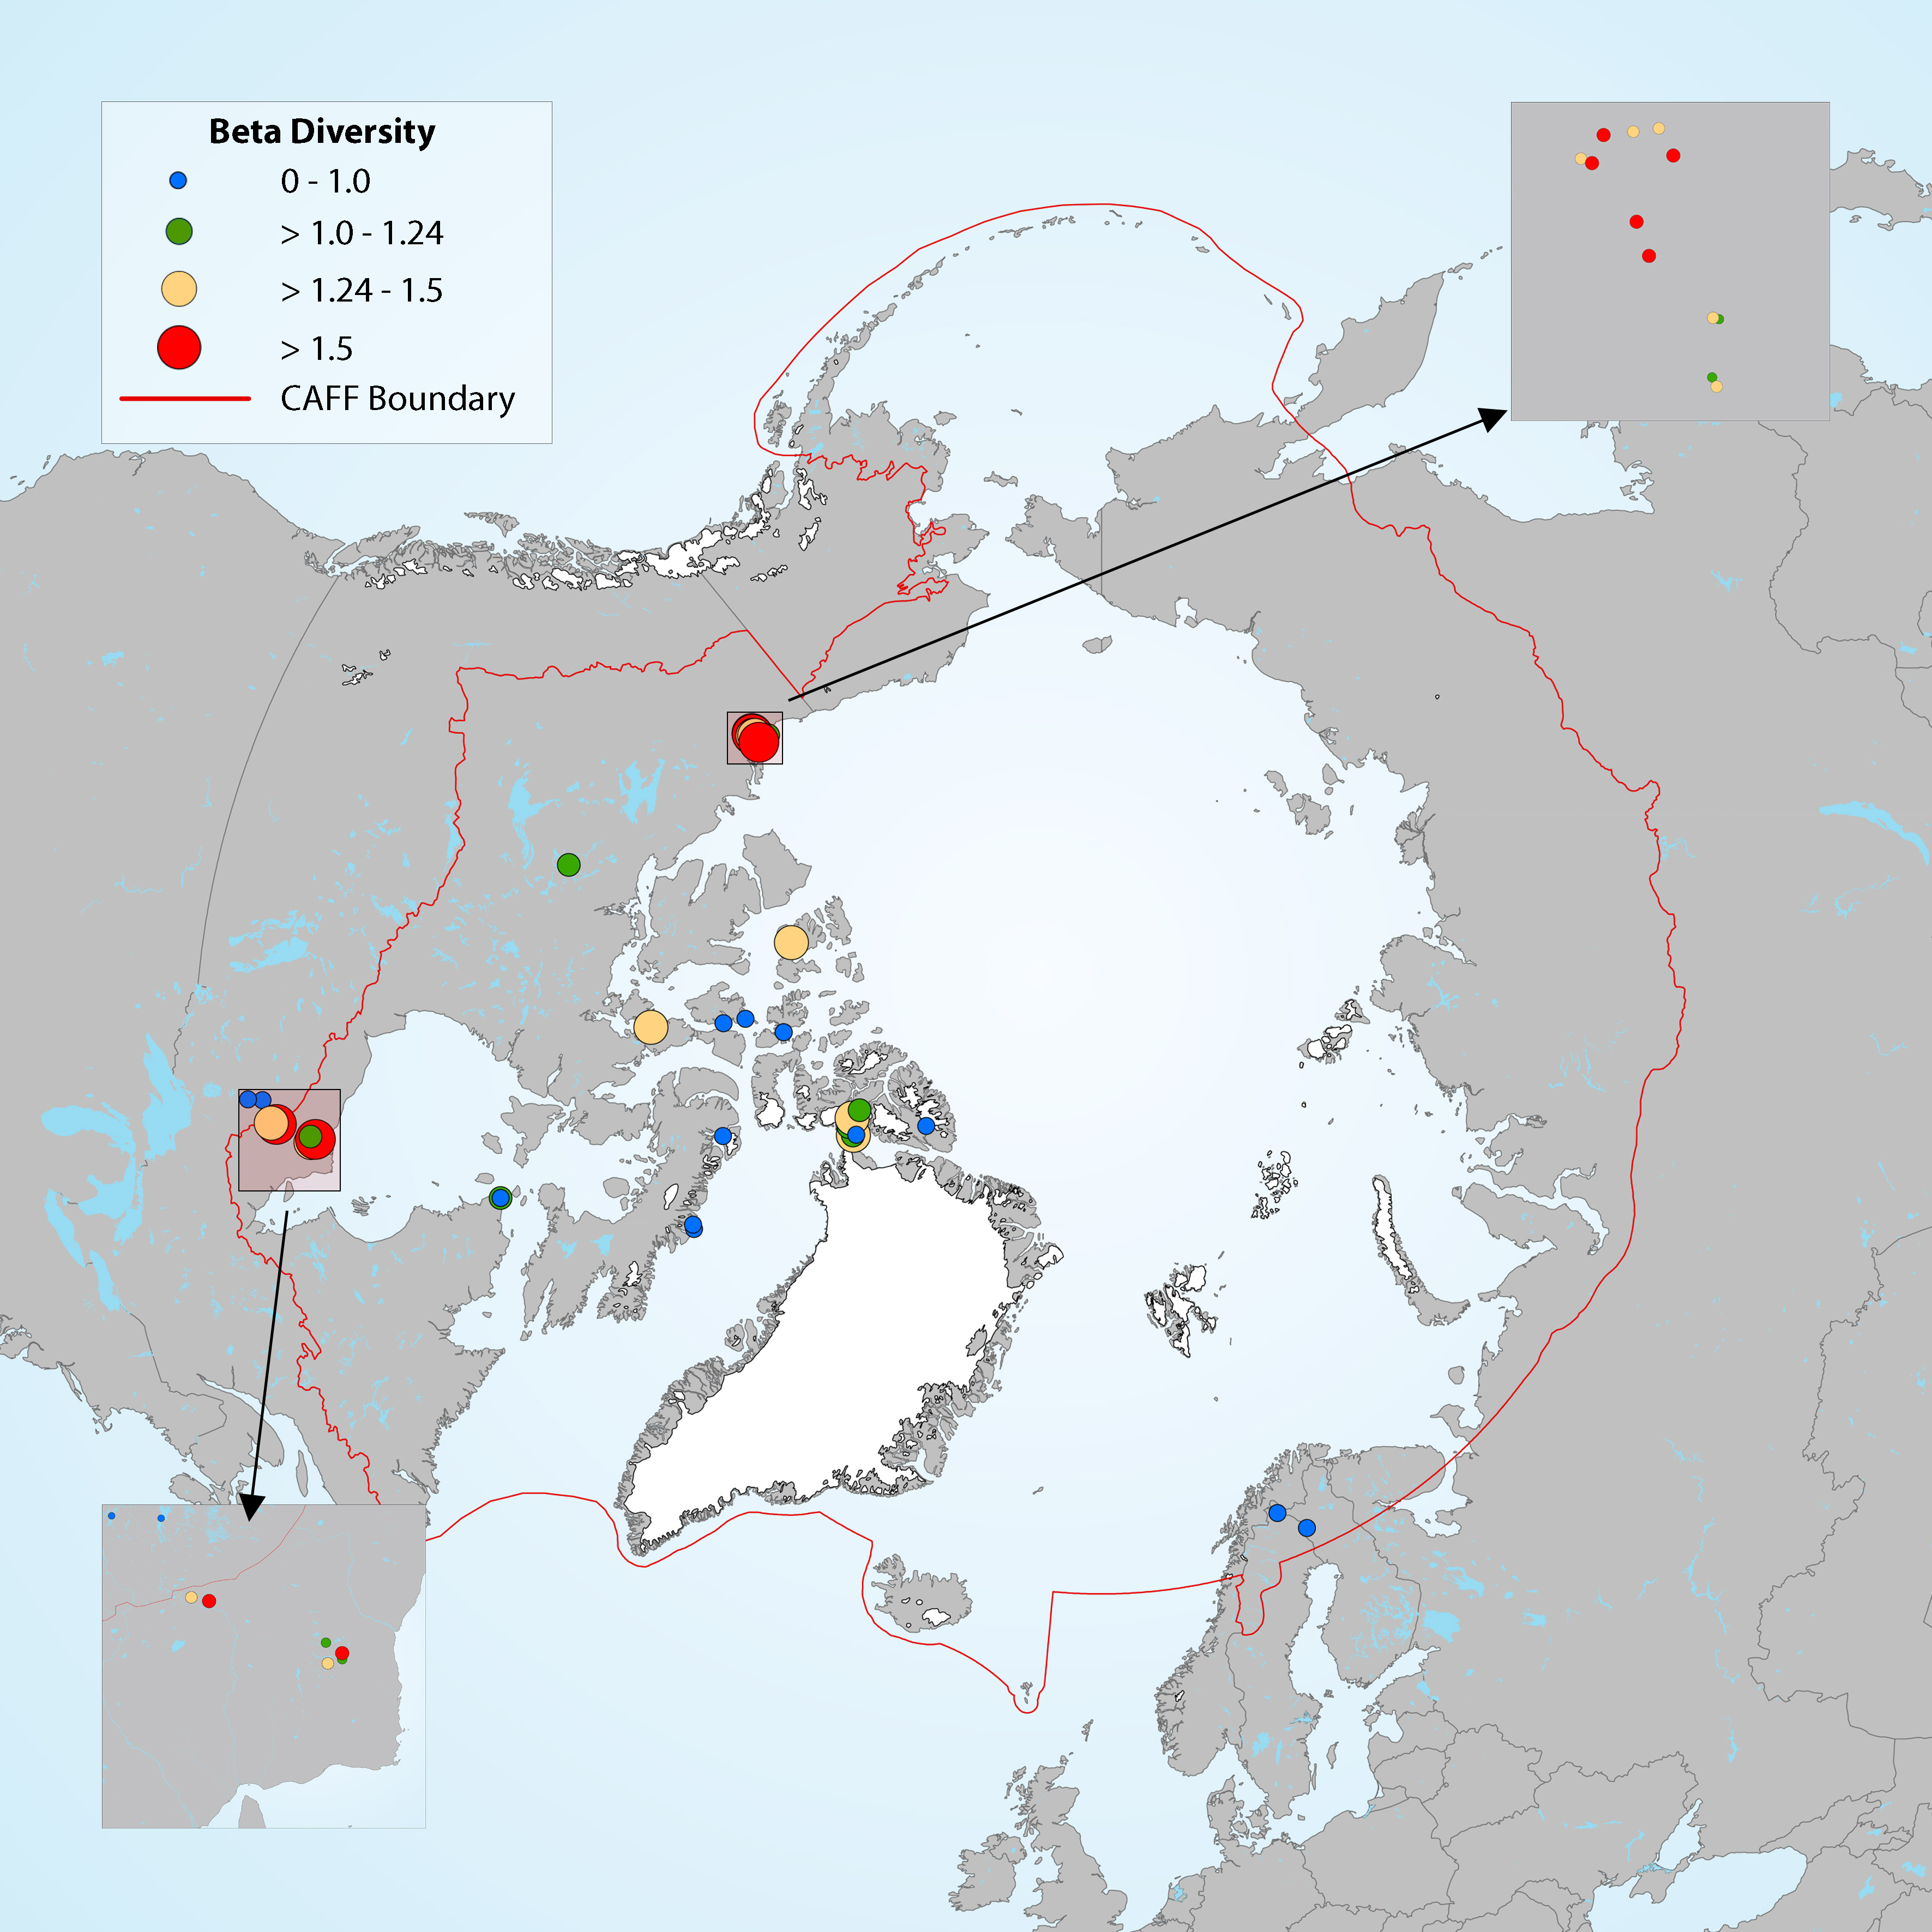
Figure 4-16 Map showing the magnitude of change in diatom assemblages for downcore samples, with beta diversity used as a measure of the compositional differences between samples at different depths along the core. Boundaries for the beta diversity categories are based on distribution quartiles (0-0.1, 0.1-1.24, 1.24-1.5, >1.5), where the lowest values (blue dots) represent the lowest degree of change in diatom assemblage composition along the length of the core in each lake. State of the Arctic Freshwater Biodiversity Report - Chapter 2 - Page 15 - Figure 2-1