 Arctic Biodiversity Data Service - ABDS Catalog
SAFBR
Type of resources
Available actions
Topics
Keywords
Contact for the resource
Provided by
Representation types
Update frequencies
status
-

Results of circumpolar assessment of river diatoms, indicating (a) the location of river diatom stations, underlain by circumpolar ecoregions; (b) ecoregions with many river diatom stations, colored on the basis of alpha diversity rarefied to 40 stations; (c) all ecoregions with river diatom stations, colored on the basis of alpha diversity rarefied to 10 stations; (d) ecoregions with at least two stations in a hydrobasin, colored on the basis of the dominant component of beta diversity (species turnover, nestedness, approximately equal contribution, or no diversity) when averaged across hydrobasins in each ecoregion. State of the Arctic Freshwater Biodiversity Report - Chapter 4 - Page 36 - Figure 4-8
-

Summary of the taxa accounting for 85% of the river benthic macroinvertebrates collected in each of several highly-sampled geographic areas, with taxa grouped by order level or higher in pie charts placed spatially to indicate sampling area. Pie charts correspond to (1) Alaska, (2) western Canada, (3) southern Canada, south of Hudson Bay, (4) northern Labrador, (5) Baffin Island, (6) Ellesmere Island, (7) Greenland high Arctic, (8) Greenland low Arctic, (9) Iceland, (10) Svalbard, and (11) Fennoscandia. State of the Arctic Freshwater Biodiversity Report - Chapter 4 - Page 70 - Figure 4-34
-

Figure 3-5 Changes in alpha diversity (red line), predator body size (blue dashed line), and ecosystem metabolism (blue solid line) with a shift in glacial cover from high (left) to low (right). Redrawn from Milner et al. (2017). State of the Arctic Freshwater Biodiversity Report - Chapter 3 - Page 22 - Figure 3-5
-
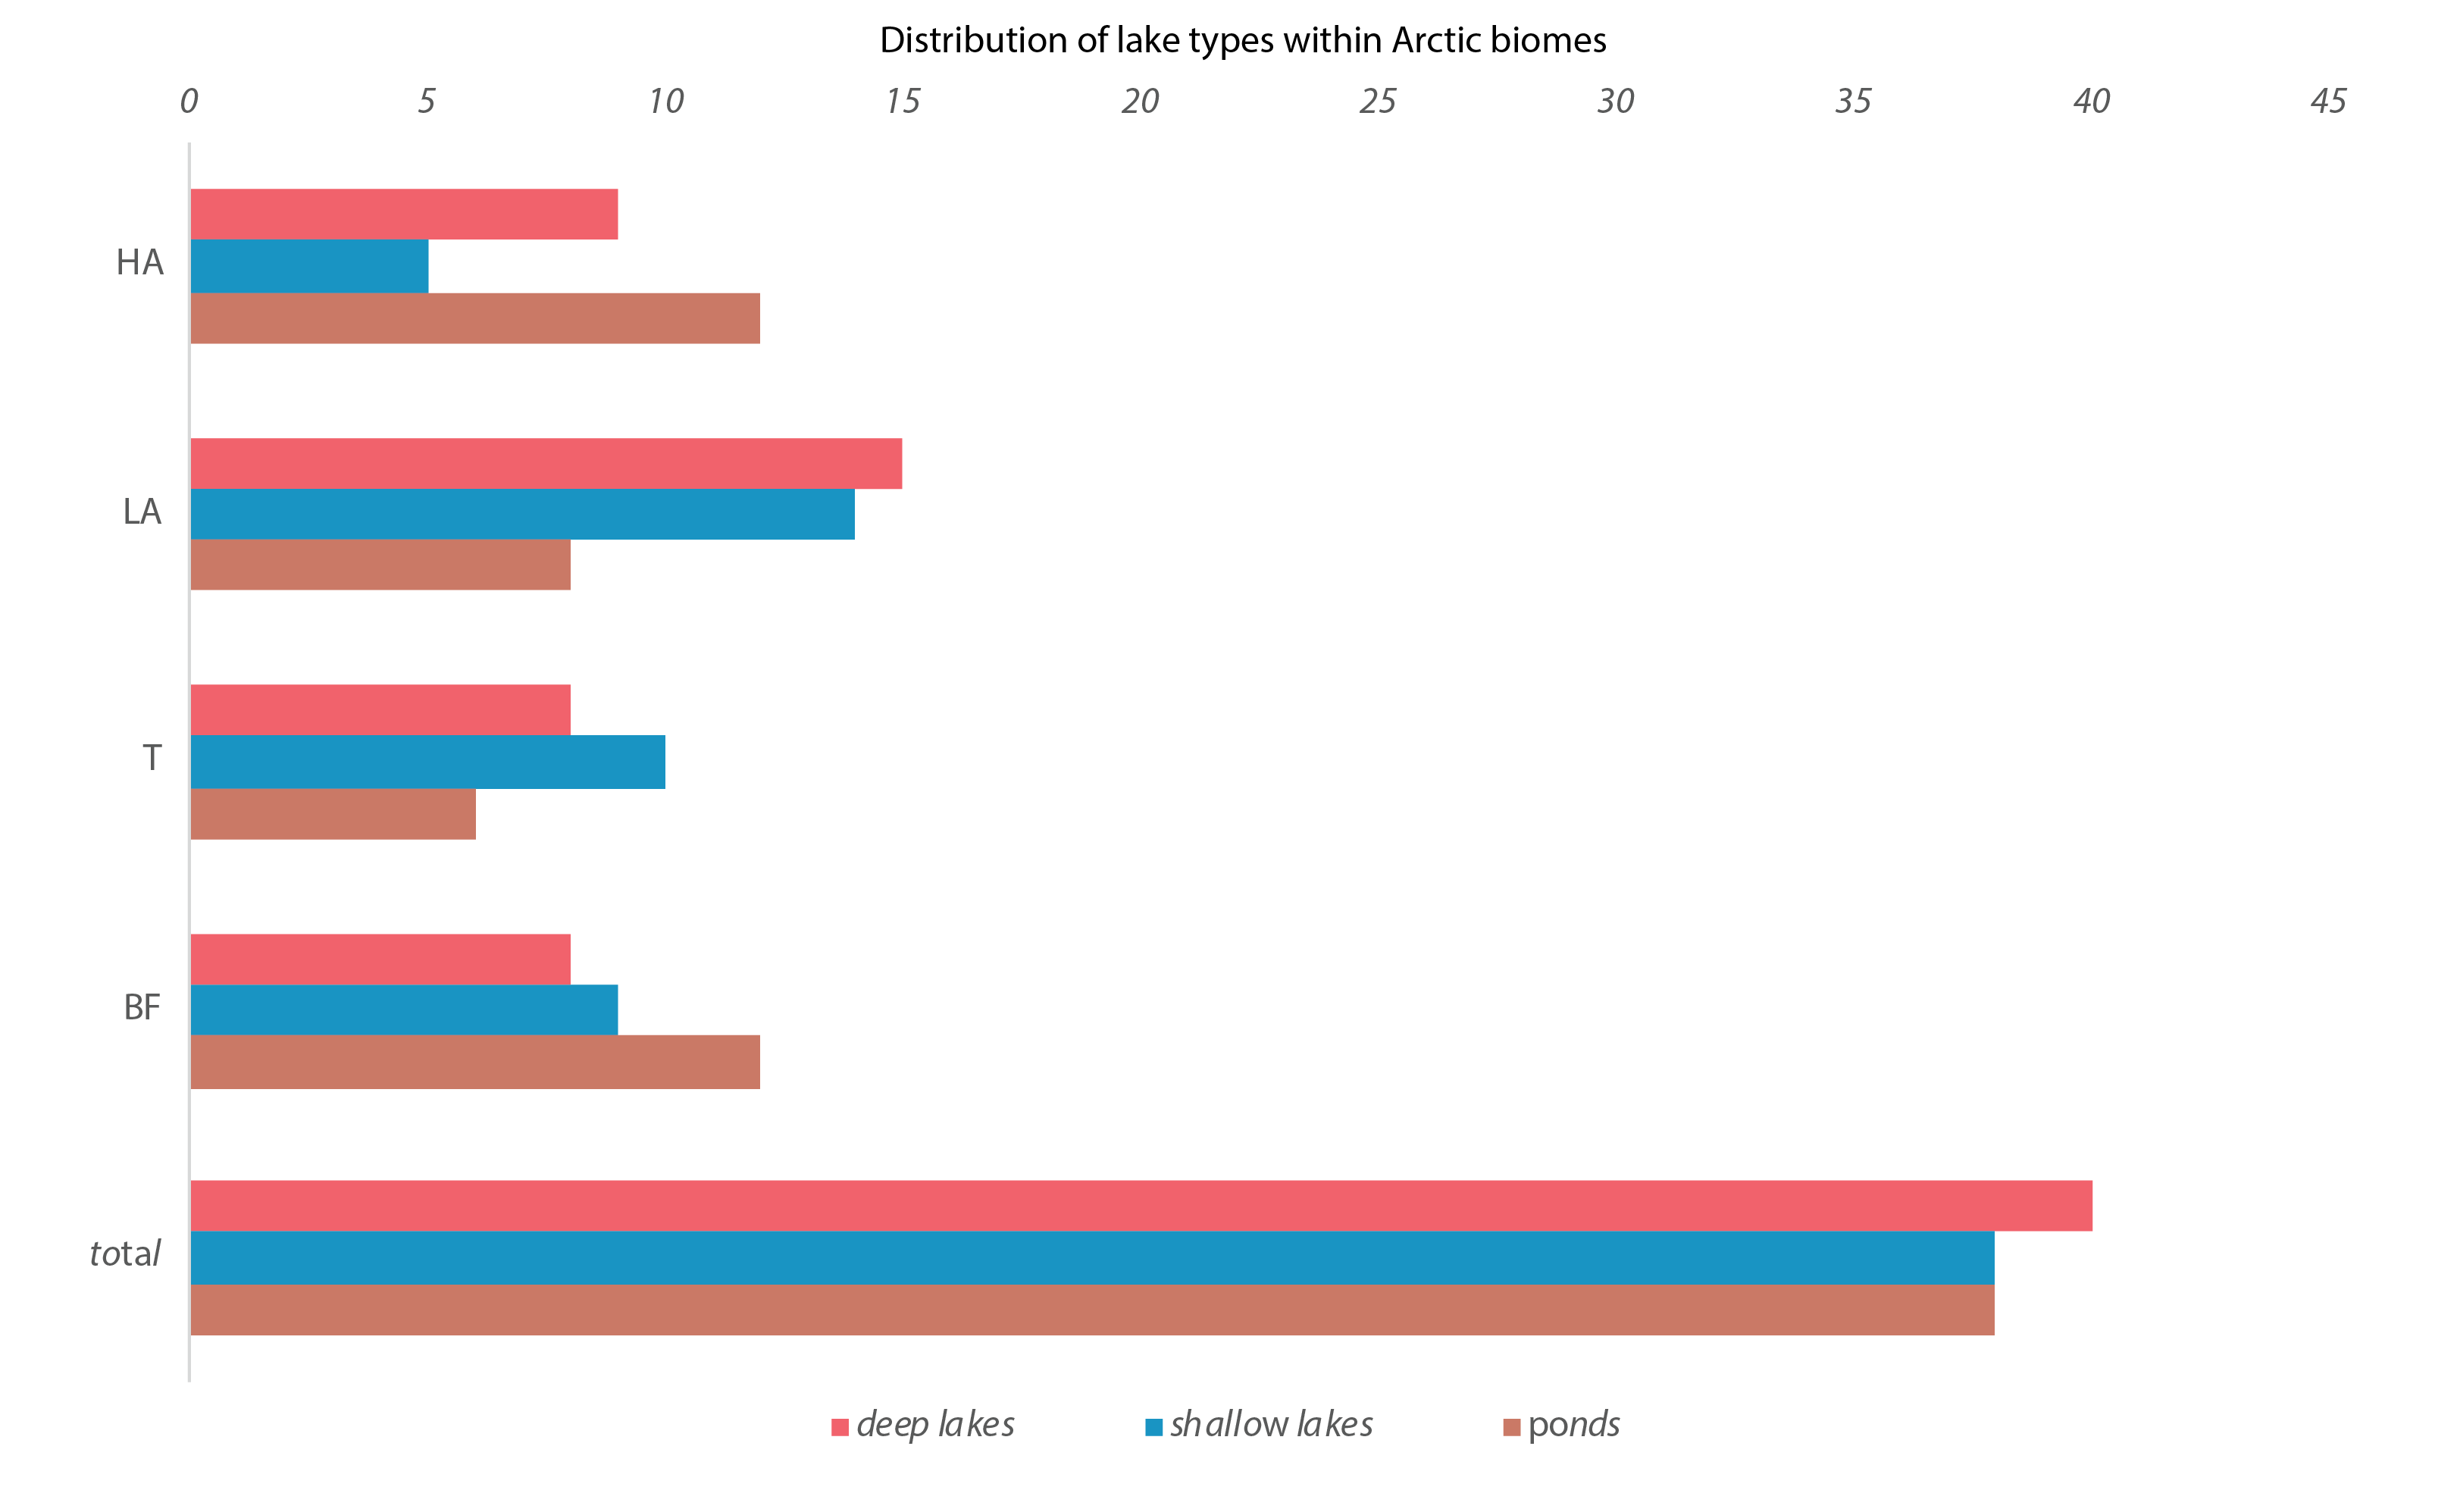
Figure 4-13 Number of deep lakes (red), shallow lakes (blue), and ponds (brown) in each geographical zone (BF, T, LA, HA). BF = Boreal Forest, T =Transition Zone, LA = Low Arctic, HA = High Arctic. State of the Arctic Freshwater Biodiversity Report - Chapter 4 - Page 40 - Figure 4-13
-
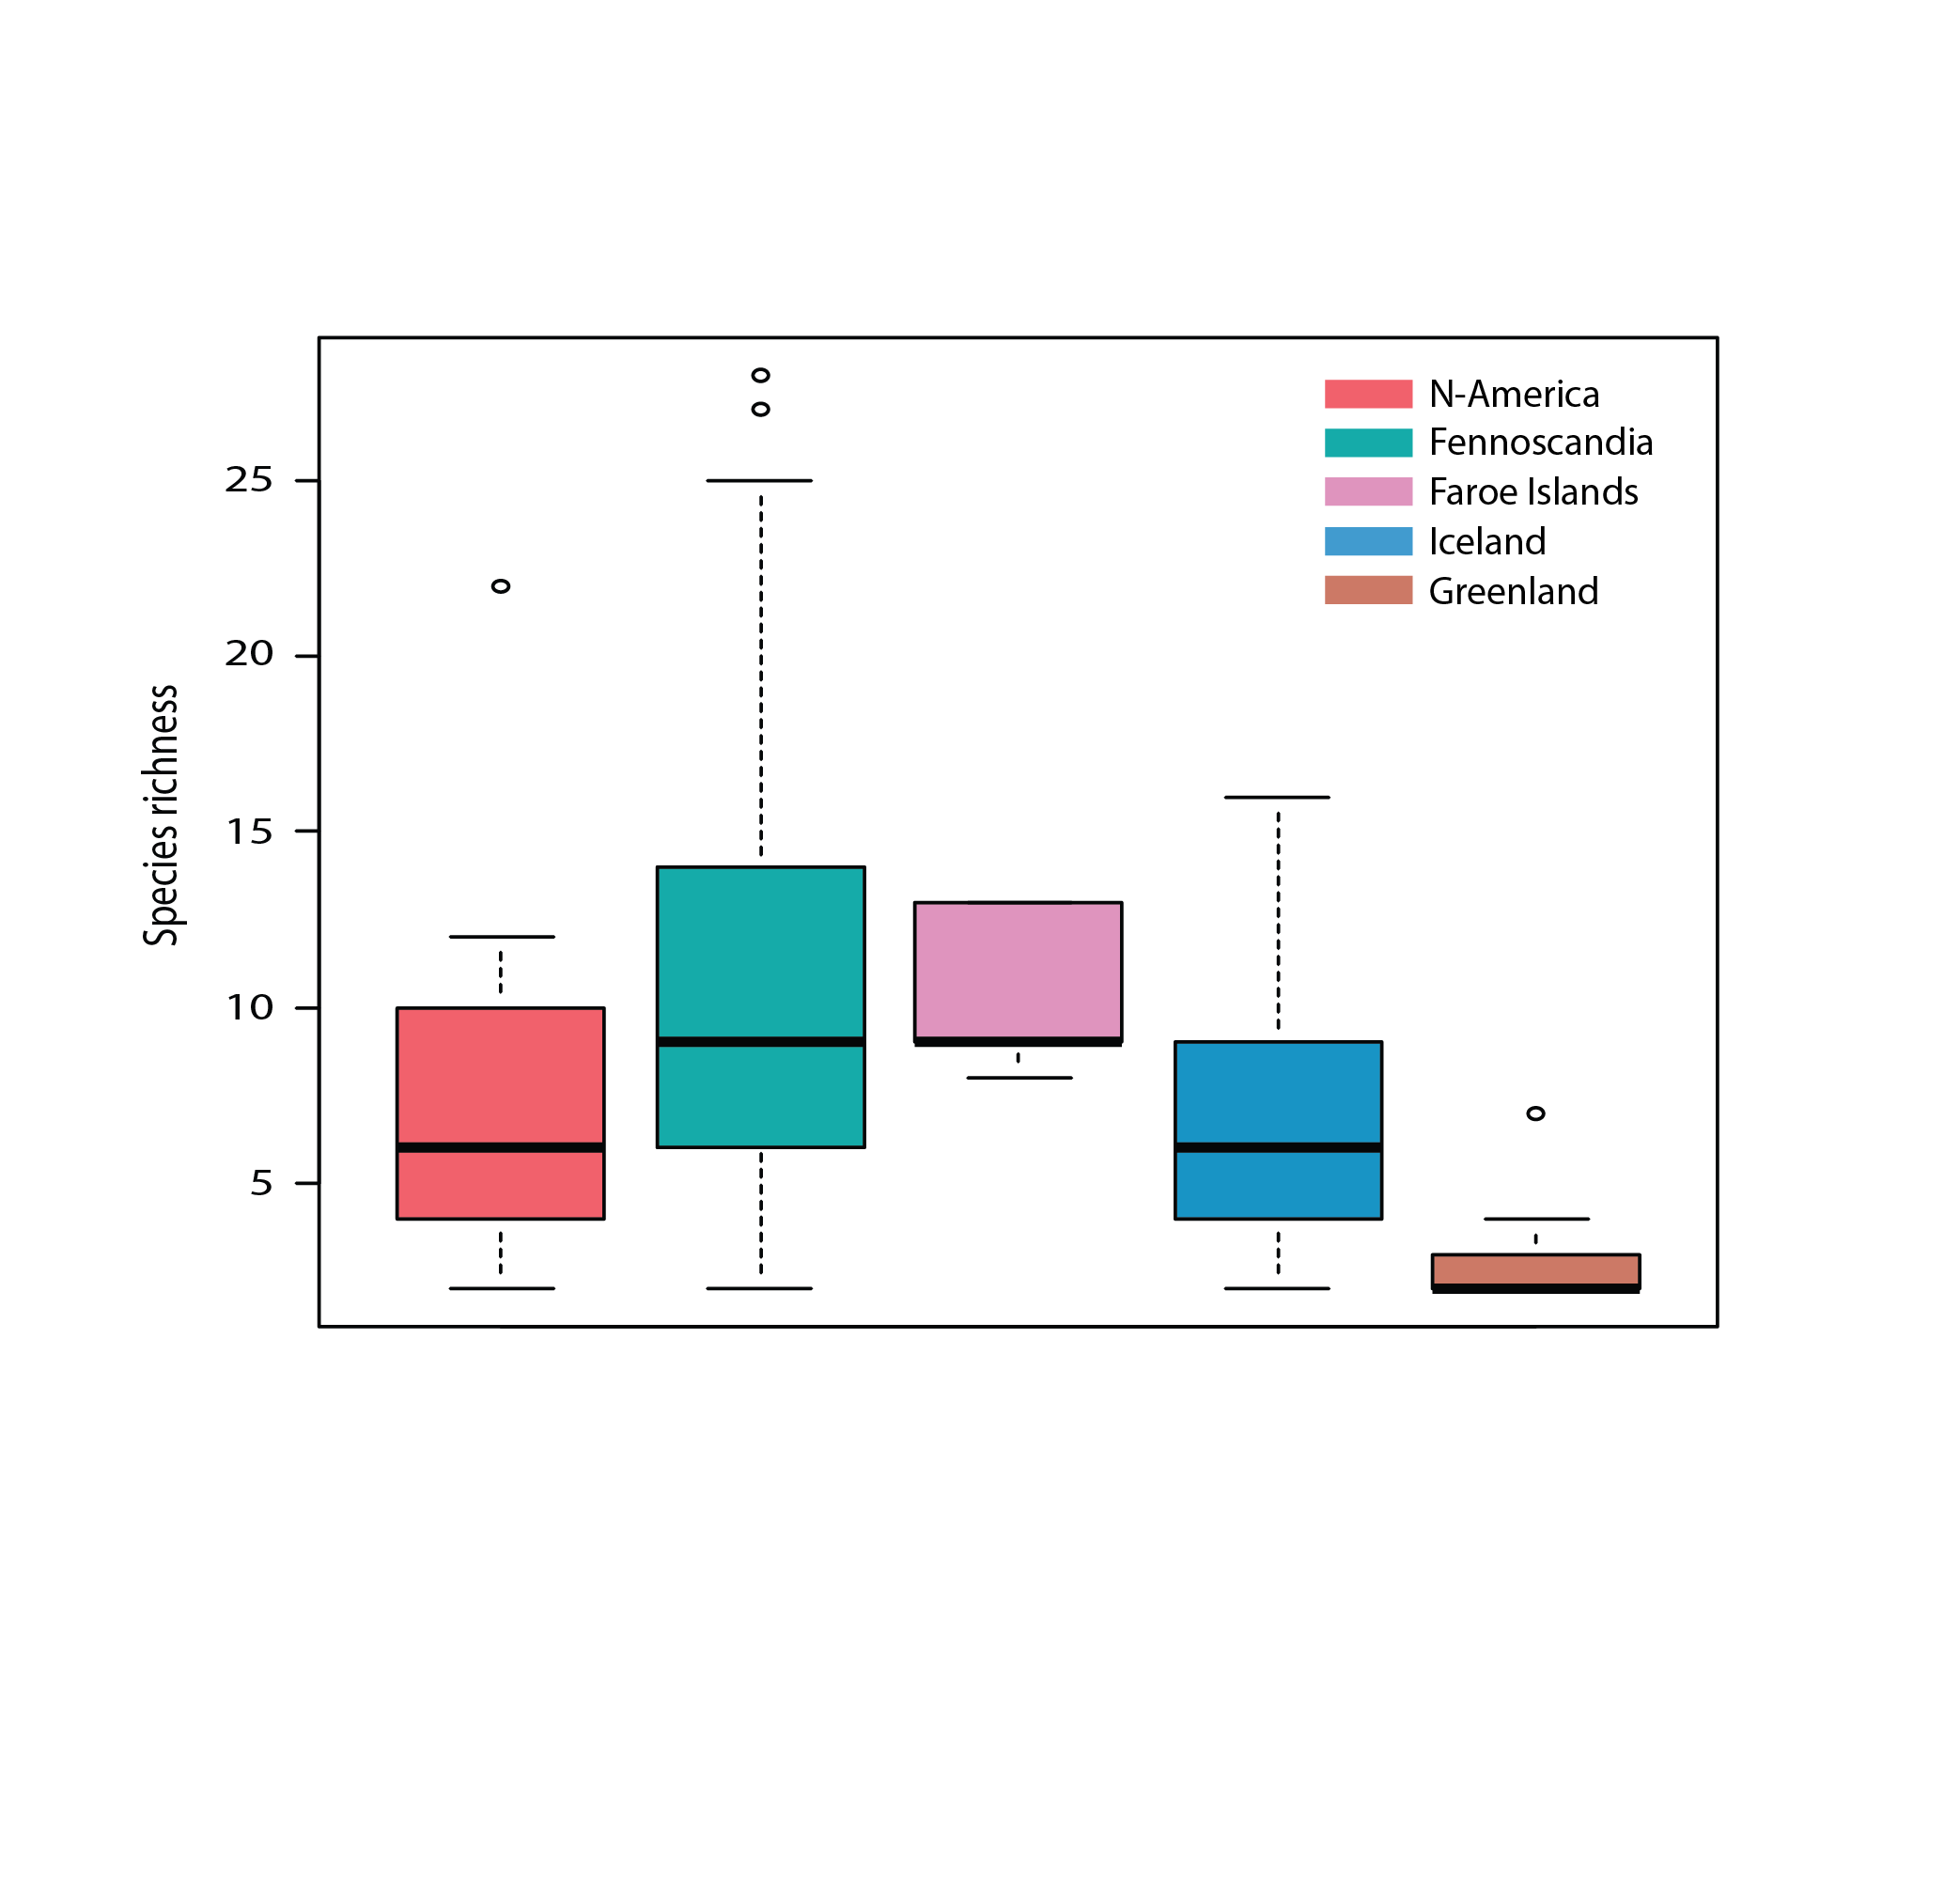
Figure 4 23 Species richness of aquatic macrophytes excluding mosses and algae in five geographic regions of the Arctic. Ame = North America, Fen = Fennoscandia, Far = Faroes, Ice = Iceland, Gre = Greenland. State of the Arctic Freshwater Biodiversity Report - Chapter 4 - Page 55 - Figure 4-22
-
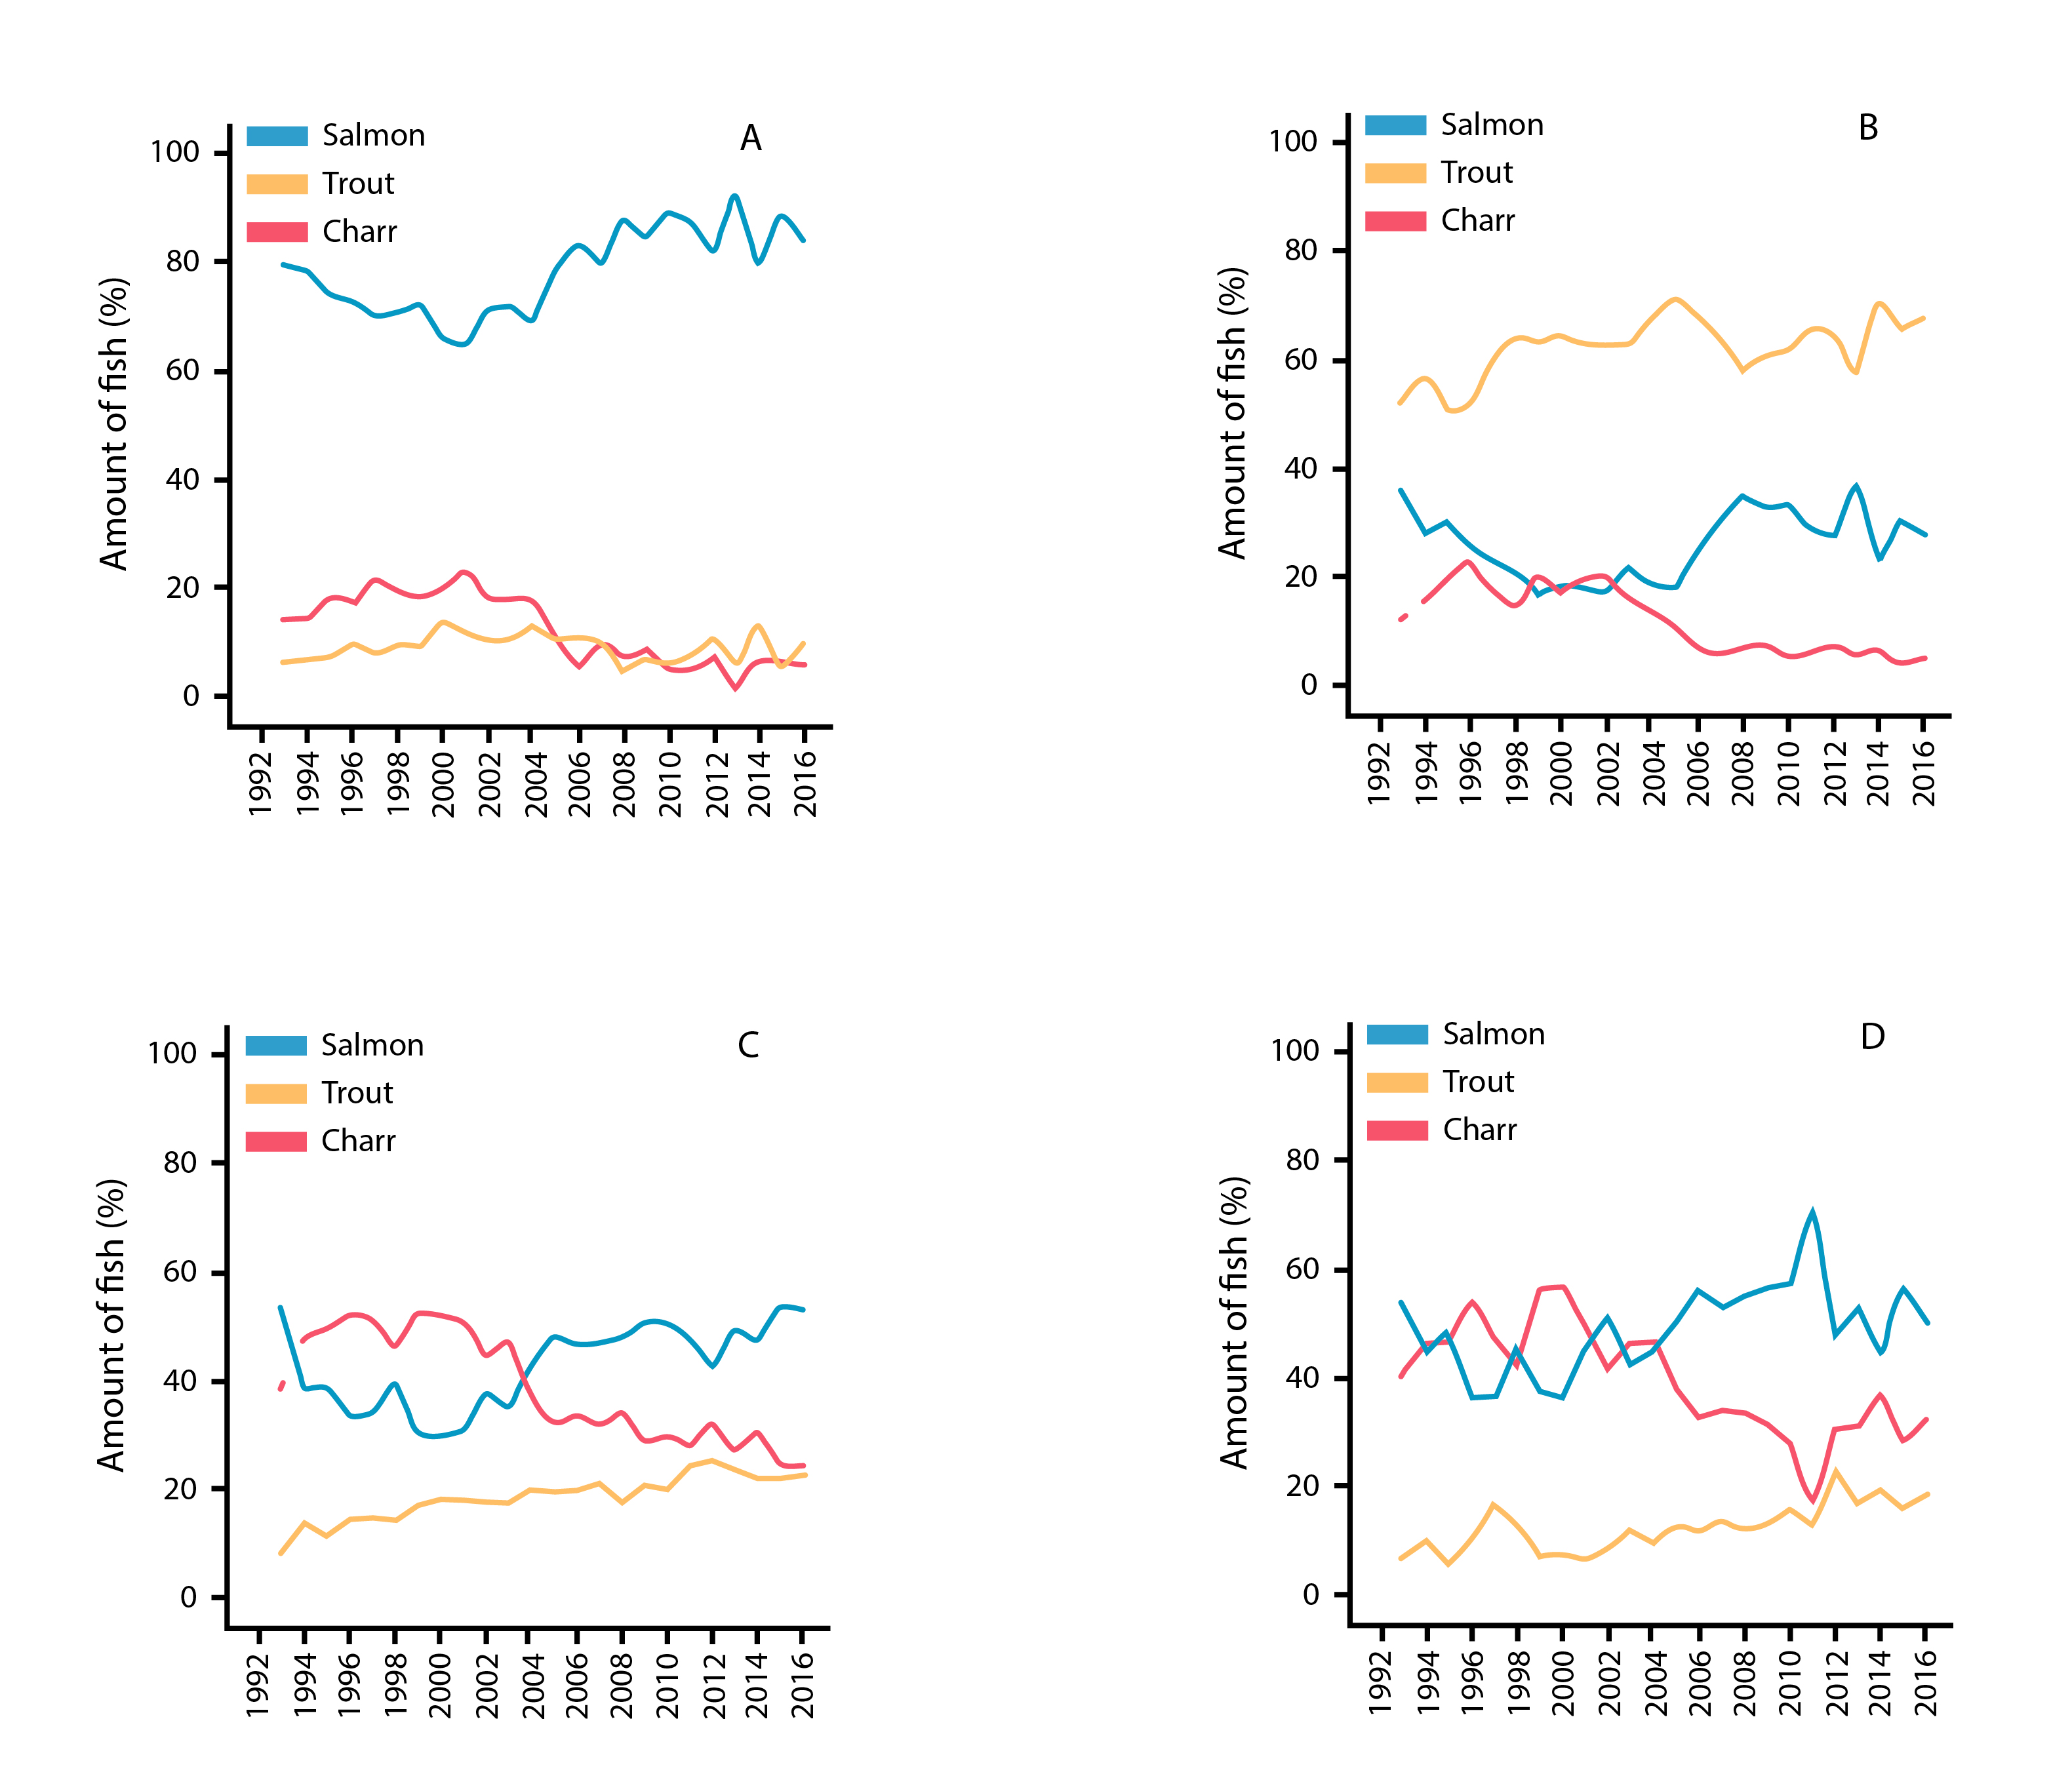
Temporal patterns in % abundance of Atlantic salmon, brown trout, and anadromous Arctic charr from catch statistics in Iceland rivers monitored from 1992 to 2016, showing results from (a) west, (b) south, (c) north, and (d) east Iceland. State of the Arctic Freshwater Biodiversity Report - Chapter 4 - Page 81 - Figure 4-41
-
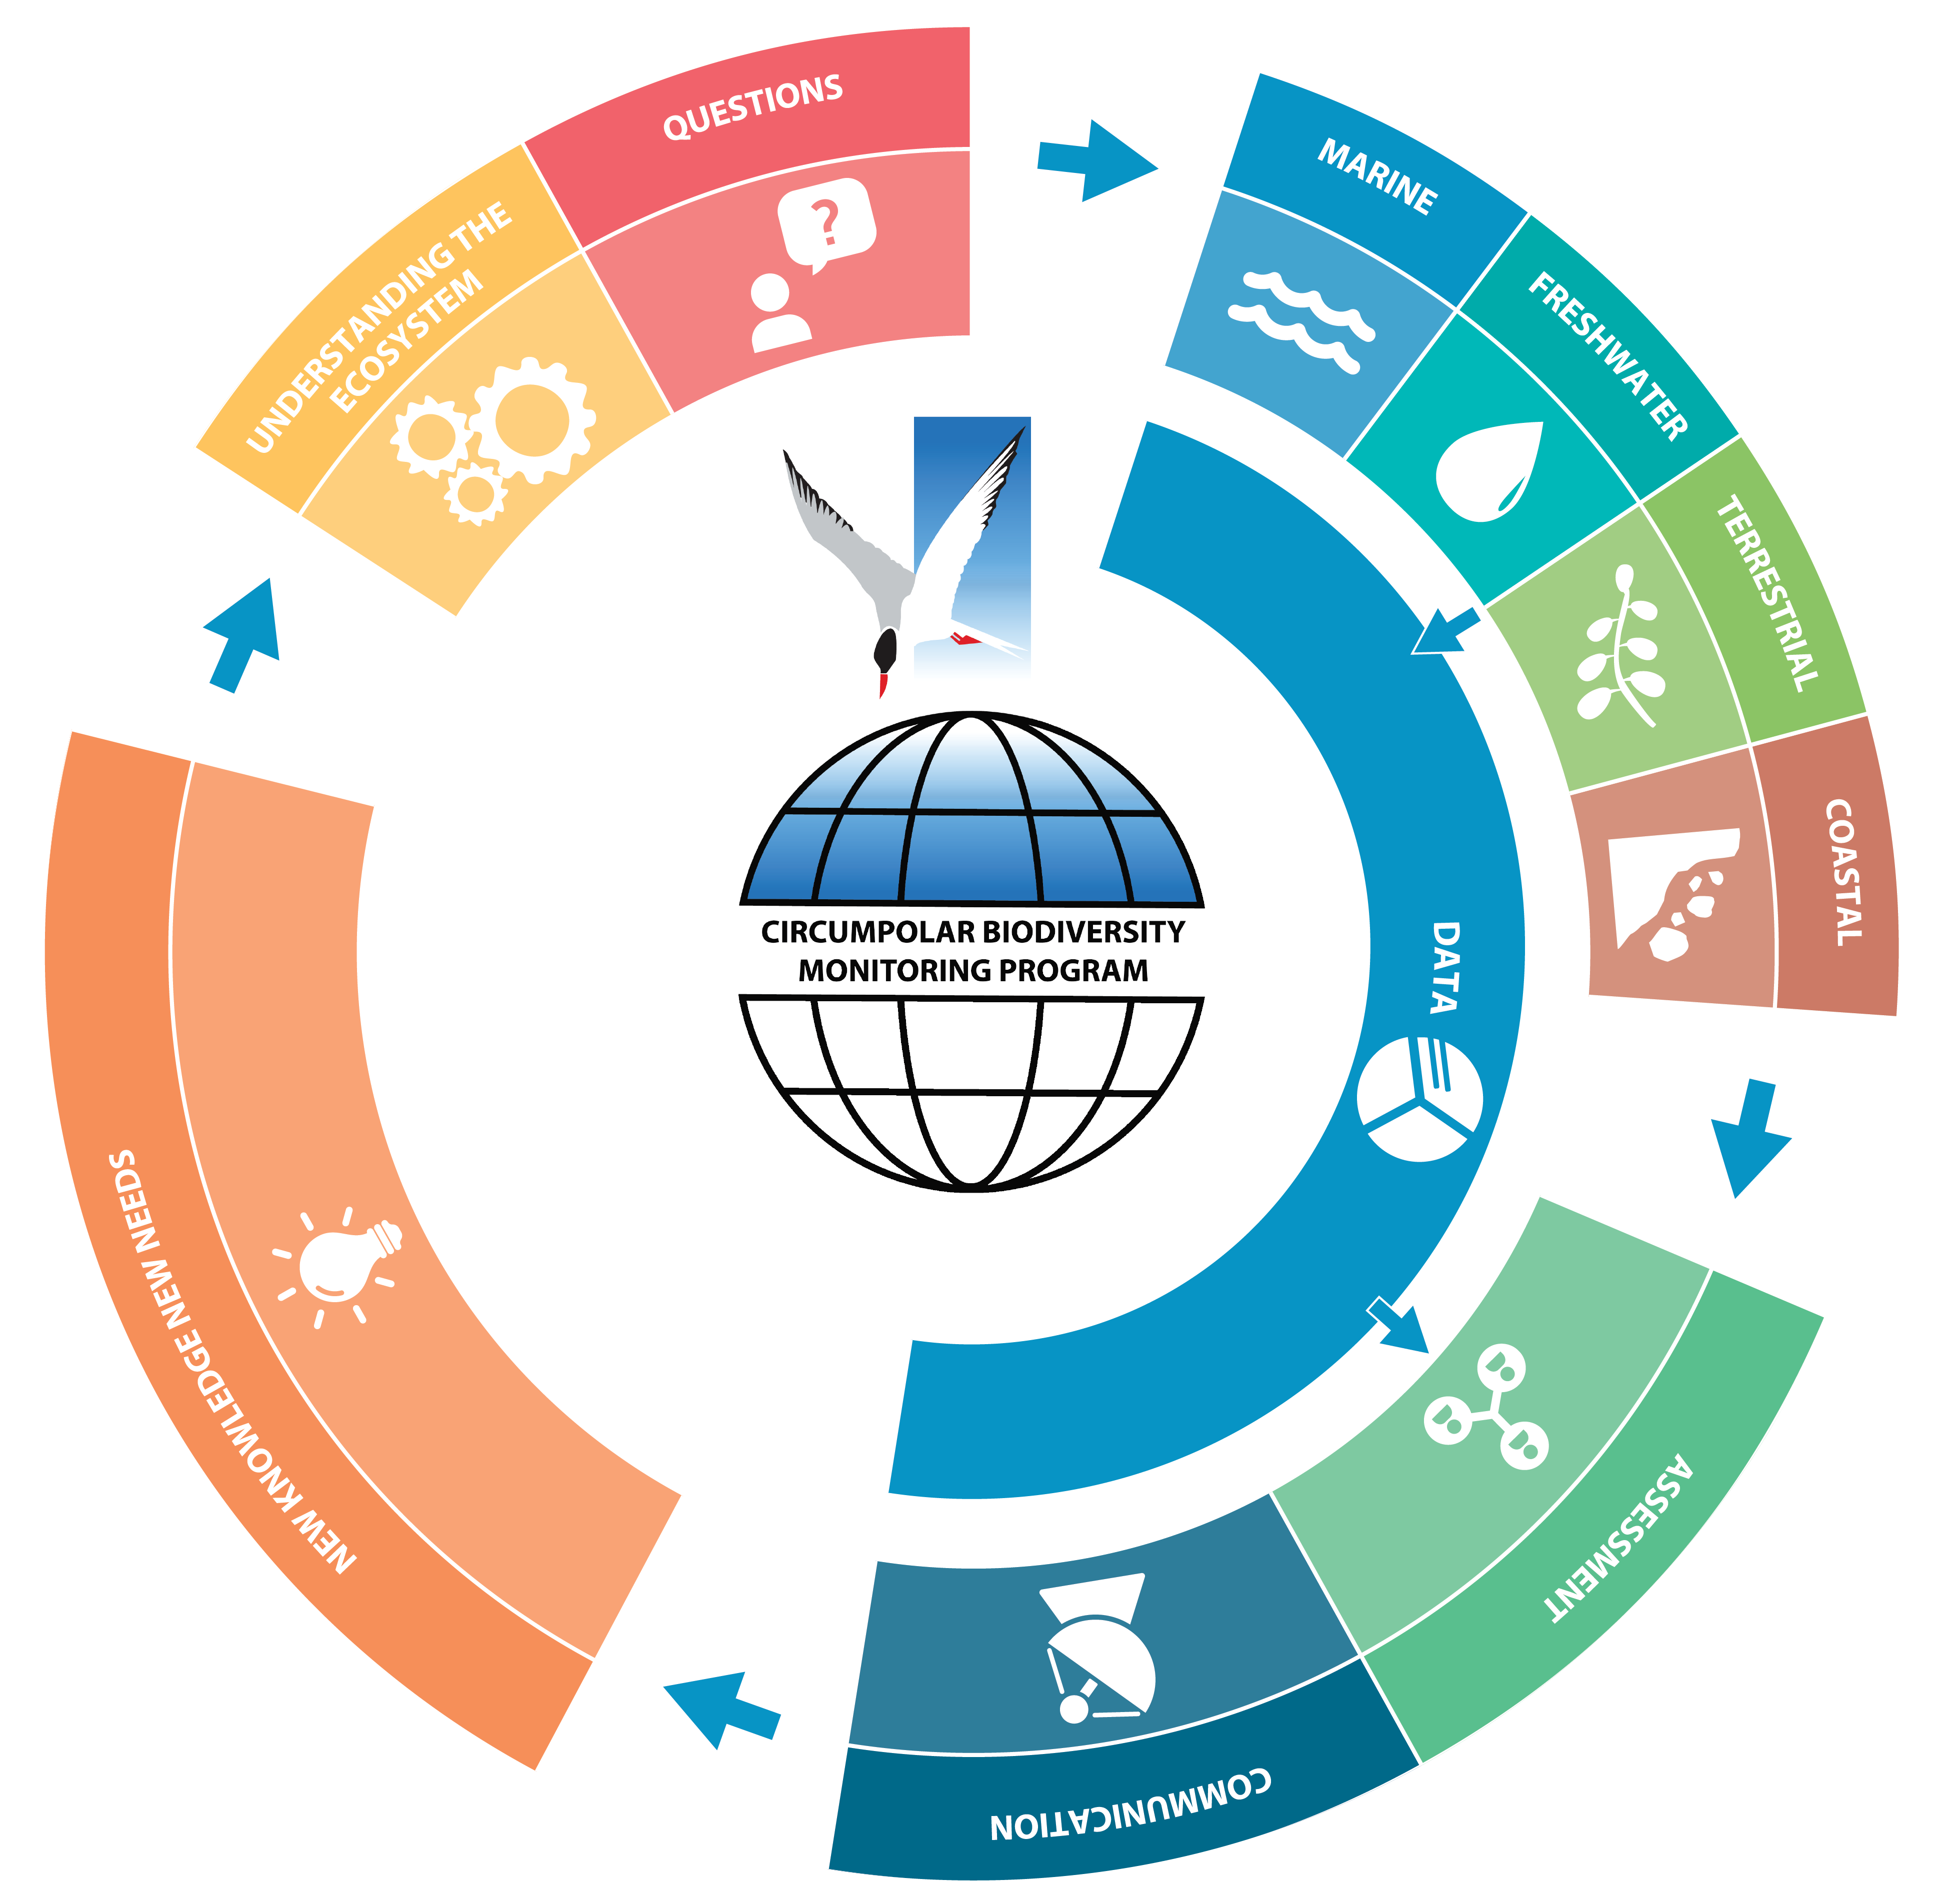
Figure 2-1 The CBMP takes an adaptive Integrated Ecosystem based Approach to monitoring and data creation. This figure illustrates how management questions, conceptual ecosystem models based on science and Traditional Knowledge (TK), and existing monitoring networks are designed to guide the four CBMP Steering Groups (marine, freshwater, terrestrial, and coastal) in their development. Monitoring outputs (data) are designed to feed into the assessment and decision-making processes (data, communication and reporting). The findings are then intended to feed back into the monitoring program. State of the Arctic Freshwater Biodiversity Report - Chapter 2 - Page 15 - Figure 2-1
-
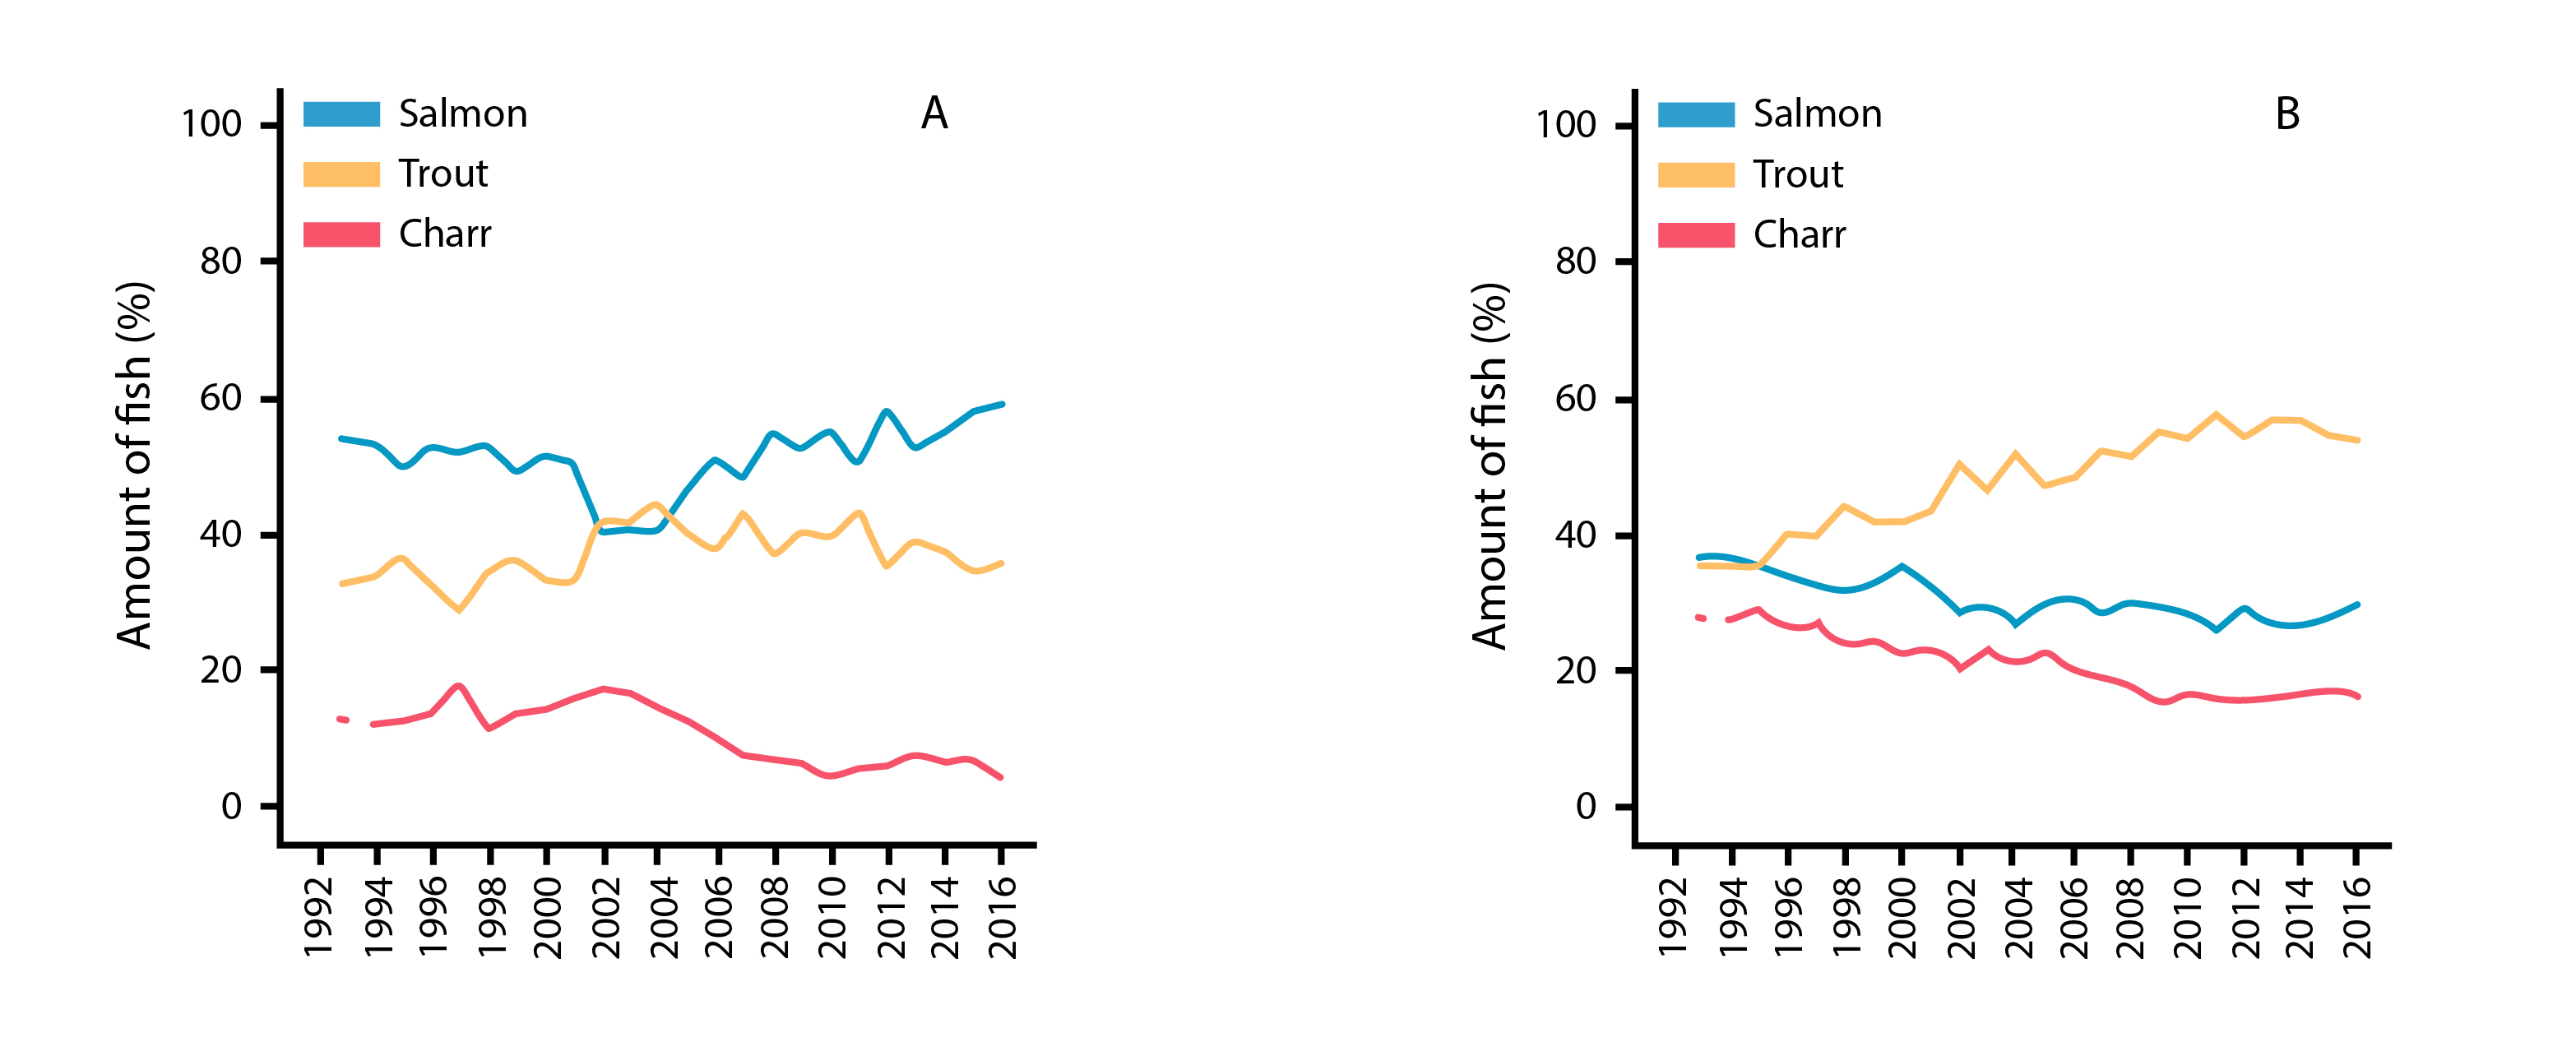
Temporal patterns in % abundance of Atlantic salmon, brown trout, and anadromous Arctic charr from catch statistics in northern Norway rivers monitored from 1993 to 2016, including basins dominated by (a) rivers and (b) lakes. State of the Arctic Freshwater Biodiversity Report - Chapter 4 - Page 81- Figure 4-42
-
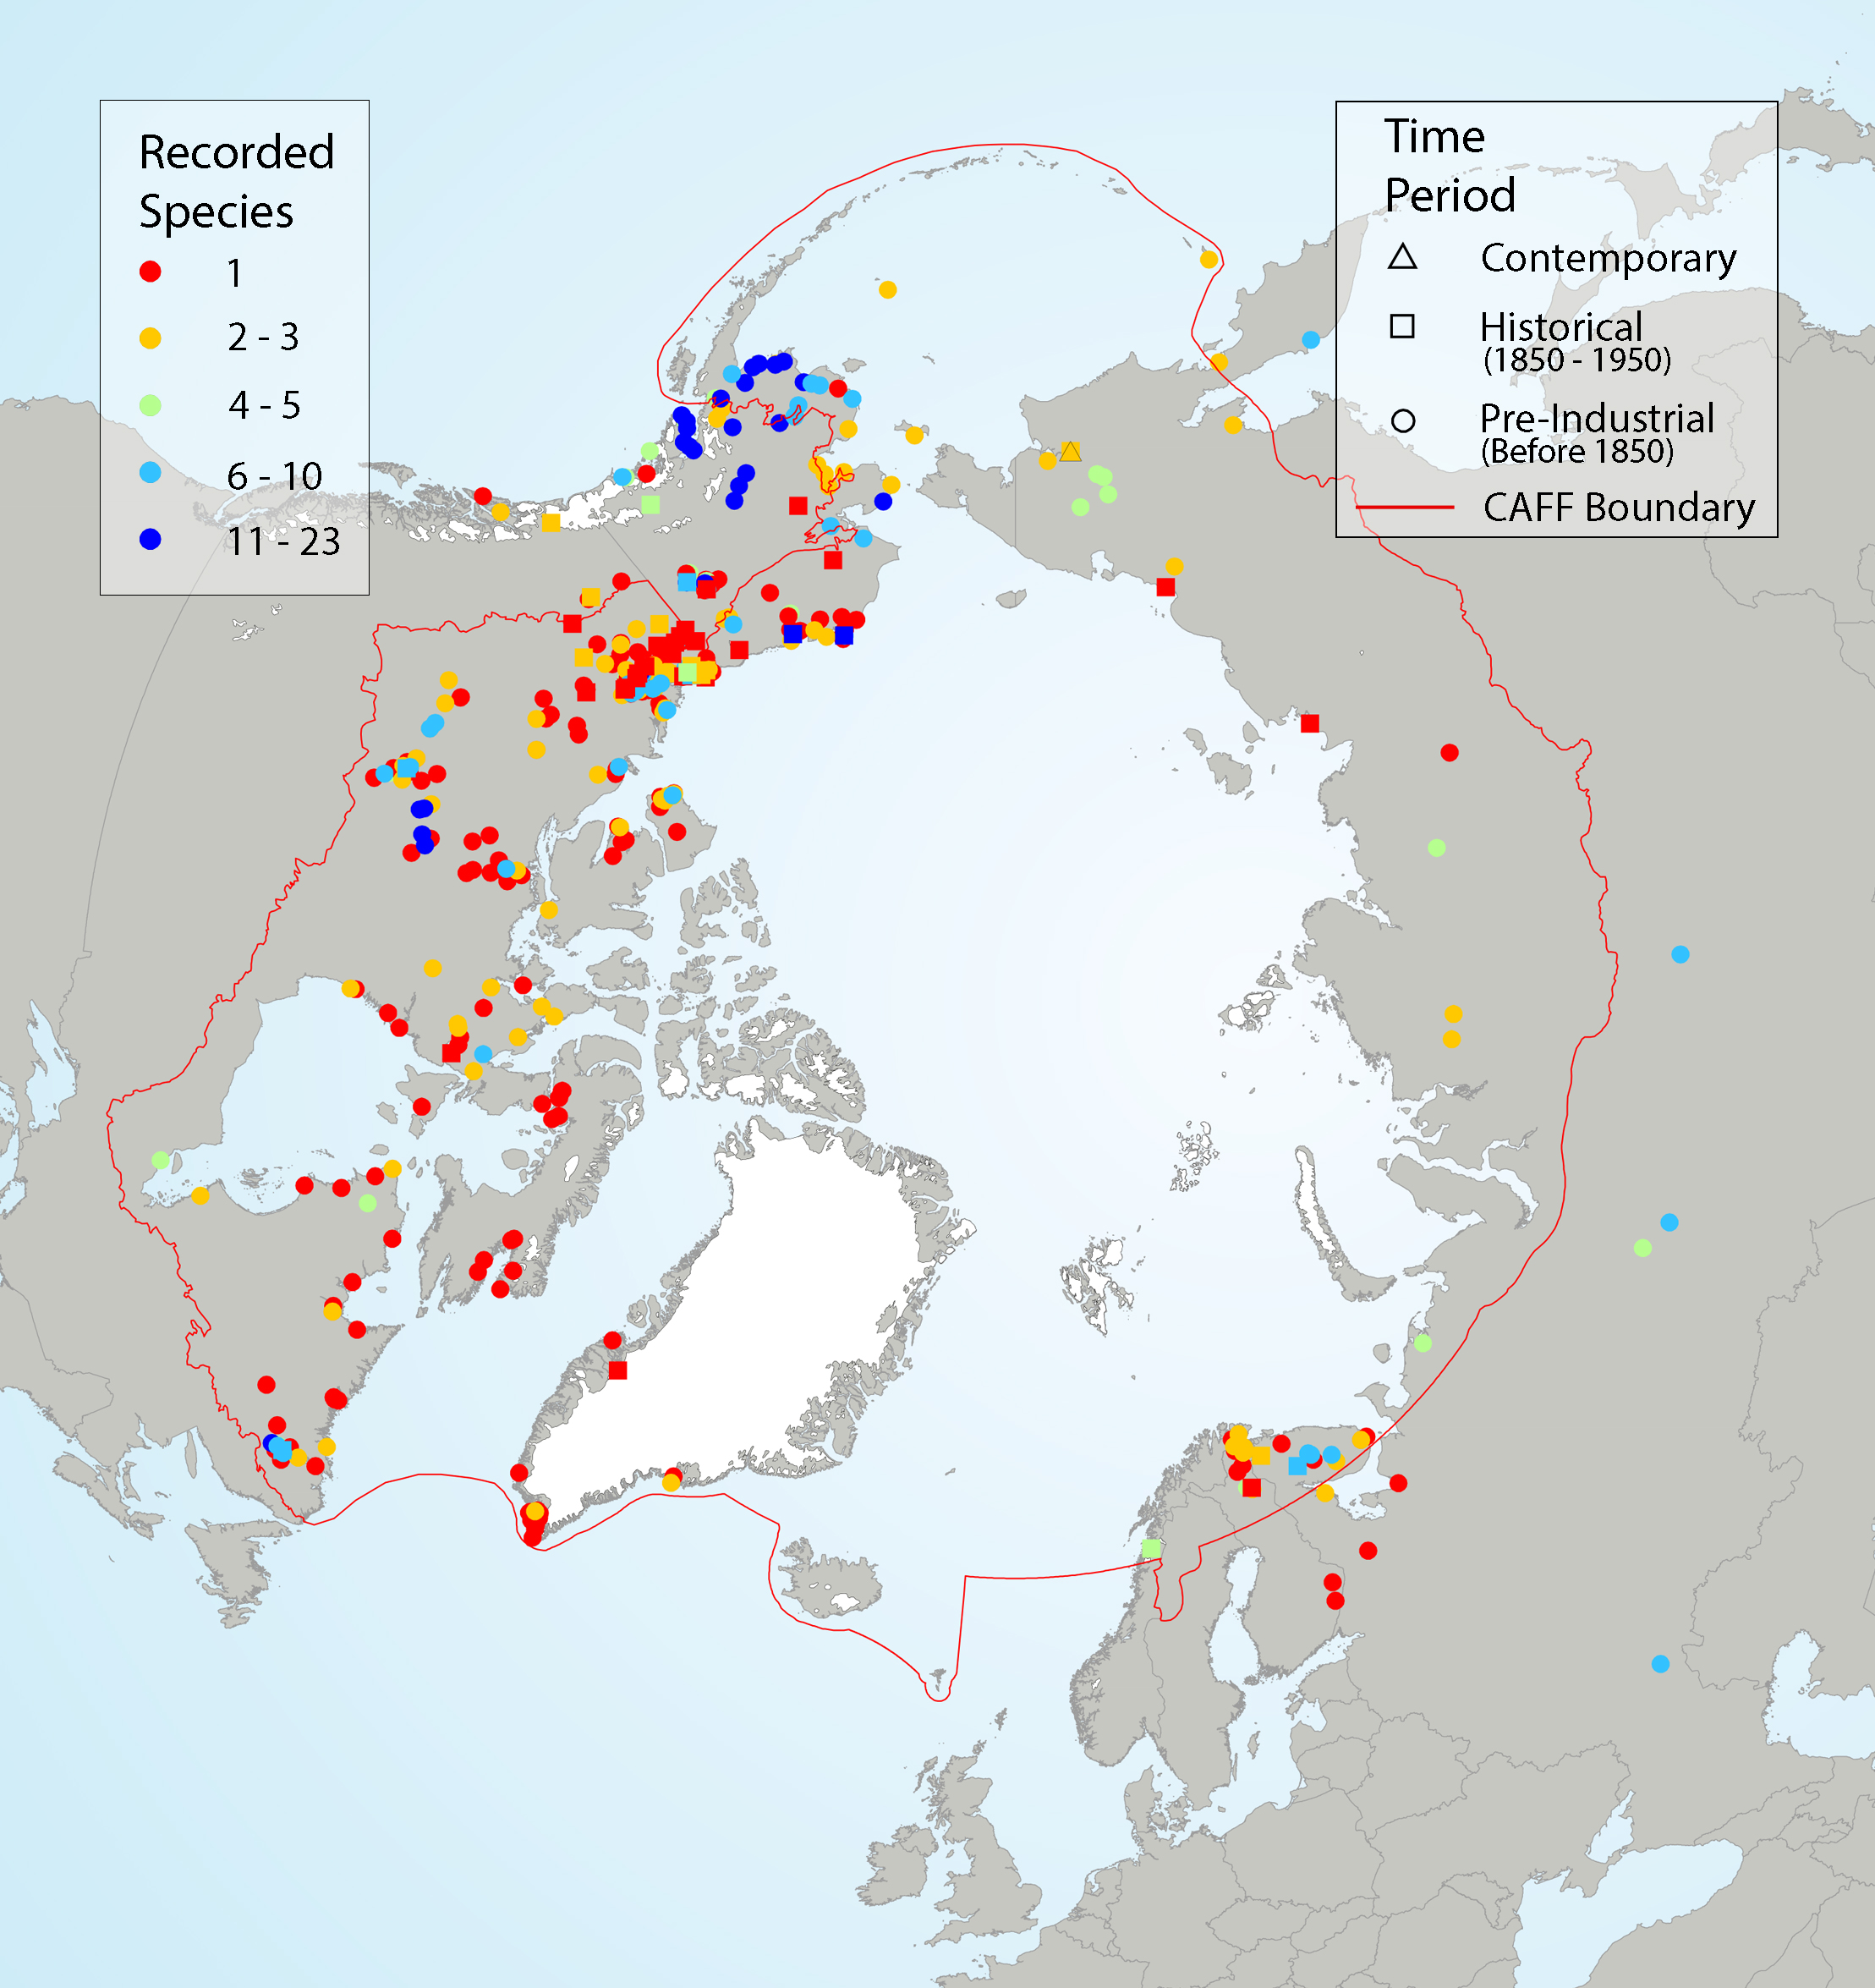
Fish species observations from Traditional Knowledge (TK ) literature, plotted in the approximate geographic location of observed record, with symbol colour indicating the number of fish species recorded and shape indicating the approximate time period of observation. Results are from a systematic literature search of TK sources from Alaska, Canada, Greenland, Fennoscandia, and Russia. State of the Arctic Freshwater Biodiversity Report - Chapter 4 - Page 75- Figure 4-37
-

Although the circumpolar countries endeavor to support monitoring programs that provide good coverage of Arctic and subarctic regions, this ideal is constrained by the high costs associated with repeated sampling of a large set of lakes and rivers in areas that often are very remote. Consequently, freshwater monitoring has sparse, spatial coverage in large parts of the Arctic, with only Fennoscandia and Iceland having extensive monitoring coverage of lakes and streams Figure 6-2 Current state of monitoring for river FECs in each Arctic country State of the Arctic Freshwater Biodiversity Report - Chapter 6 - Page 94 - Figure 6-2