 Arctic Biodiversity Data Service - ABDS Catalog
oceans
Type of resources
Available actions
Topics
Keywords
Contact for the resource
Provided by
Years
Formats
Representation types
Update frequencies
status
Scale
-
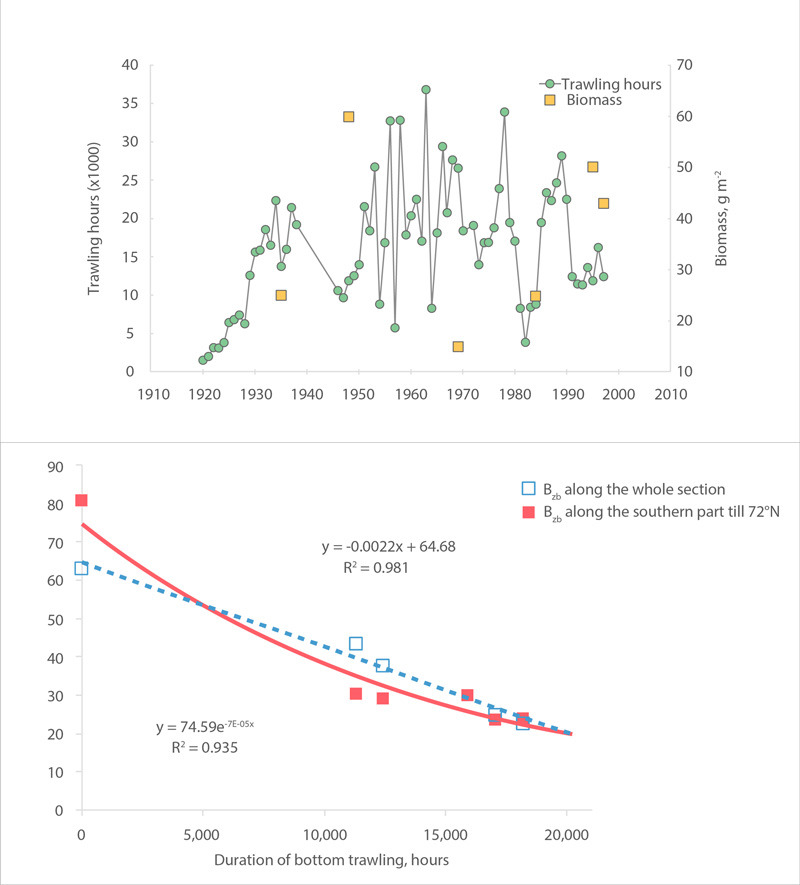
Variation of average annual trawling activity (in hours) and macrobenthic biomass (g m-2), (a) and relationship of biomass with a four-year lag (mean value of time of the turnover in biomass value) to trawling activity, (b) along the Kola section of the Barents Sea during 1920-1997 (Denisenko 2001, 2013). STATE OF THE ARCTIC MARINE BIODIVERSITY REPORT - <a href="https://arcticbiodiversity.is/findings/benthos" target="_blank">Chapter 3</a> - Page 97 - Figure 3.3.5
-
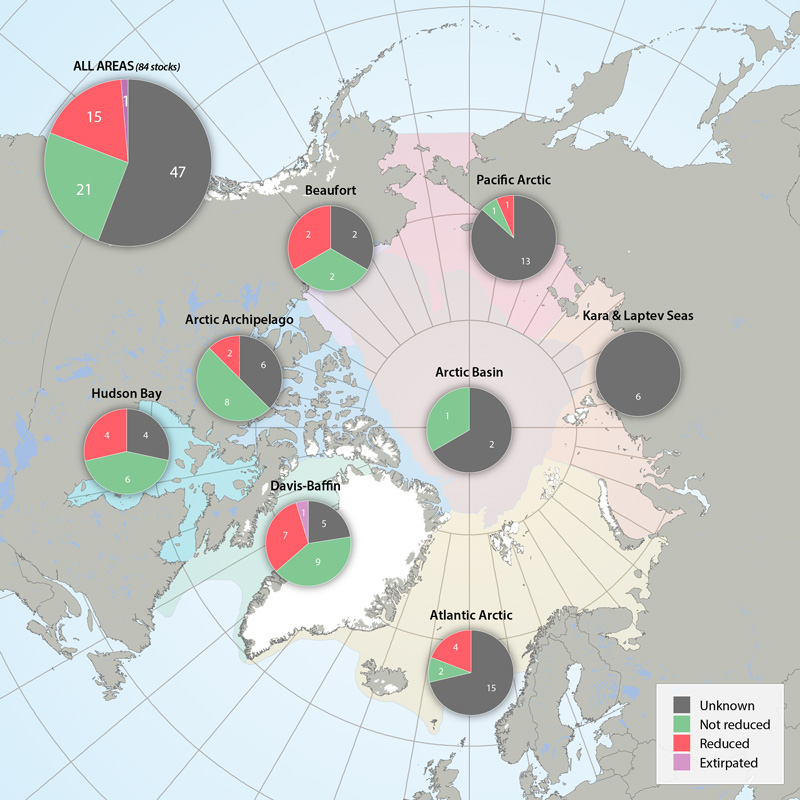
Status of marine mammal Focal Ecosystem Component stocks by Arctic Marine Area. STATE OF THE ARCTIC MARINE BIODIVERSITY REPORT - <a href="https://arcticbiodiversity.is/findings/marine-mammals" target="_blank">Chapter 3</a> - Page 157 - Figure 3.6.3
-
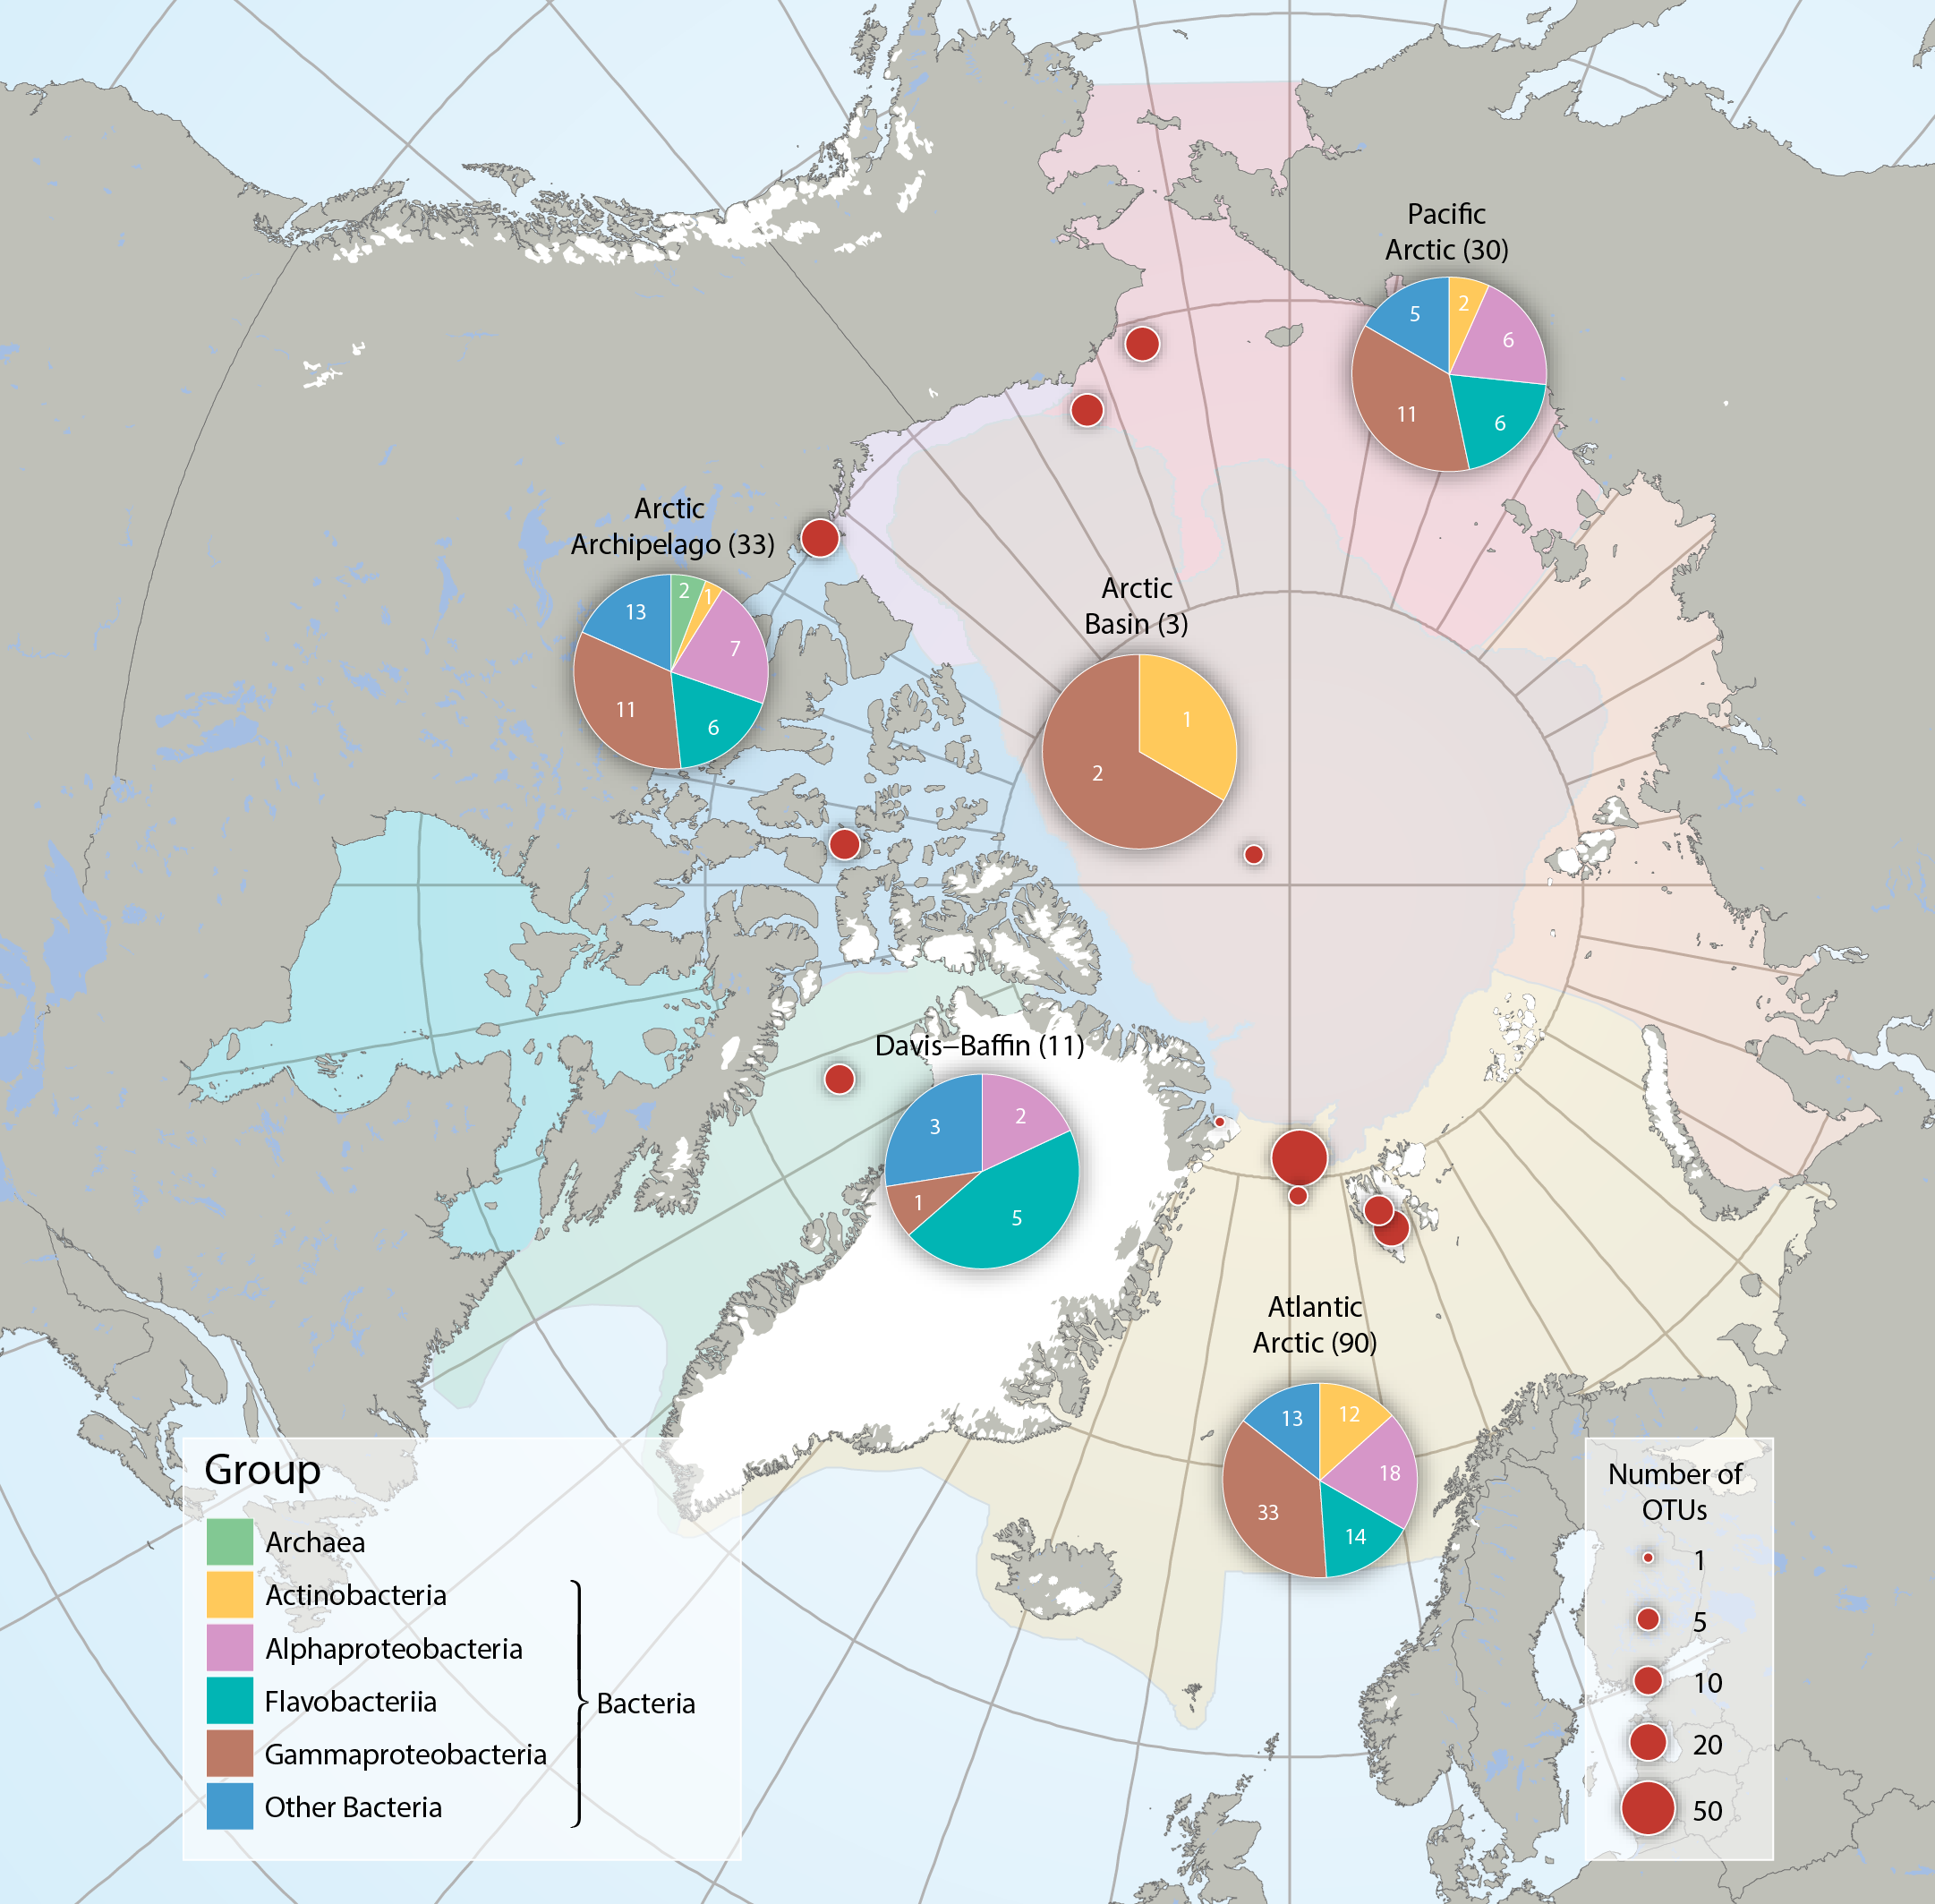
Bacteria and Archaea across five Arctic Marine Areas based on number of operational taxonomic units (OTUs), or molecular species. Composition of microbial groups, with respective numbers of OTUs (pie charts) and number of OTUs at sampling locations (red dots). Data aggregated by the CBMP Sea Ice Biota Expert Network. Data source: National Center for Biotechnology Information’s (NCBI 2017) Nucleotide and PubMed databases. STATE OF THE ARCTIC MARINE BIODIVERSITY REPORT - <a href="https://arcticbiodiversity.is/findings/sea-ice-biota" target="_blank">Chapter 3</a> - Page 38 - Figure 3.1.2 From the report draft: "Synthesis of available data was performed by using searches conducted in the National Center for Biotechnology Information’s “Nucleotide” (http://www.ncbi.nlm.nih.gov/guide/data-software/) and “PubMed” (http://www.ncbi.nlm.nih.gov/pubmed) databases. Aligned DNA sequences were downloaded and clustered into OTUs by maximum likelihood phylogenetic placement."
-
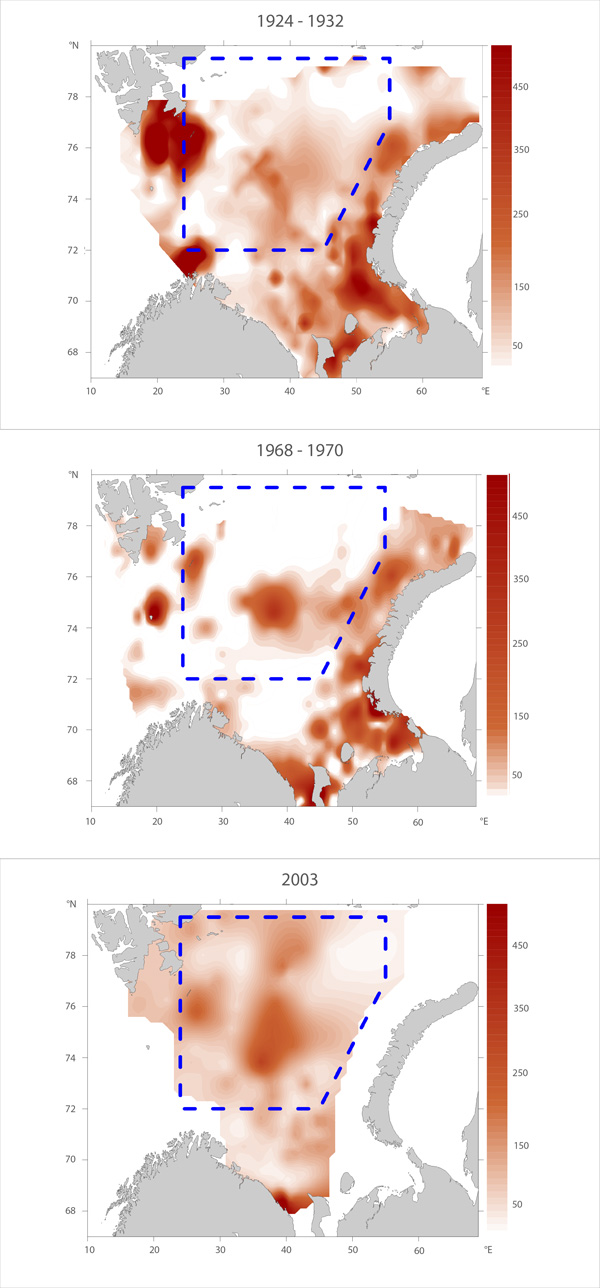
Macrofauna distribution of biomass (g wet fixed weight m-2) in the Barents Sea over three time periods: 1924-32 (Figure A), 1968-70 (Figure B) and 2003 (Figure C, constructed from original archive data, except for area south of 72° N where digitized megafaunal-data taken from Anisimova et al. (2010) was used. Adapted from Denisenko (2013). Blue boxes delineate the areas within which the zoobenthos biomass values were compared. STATE OF THE ARCTIC MARINE BIODIVERSITY REPORT - <a href="https://arcticbiodiversity.is/findings/benthos" target="_blank">Chapter 3</a> - Page 96- Figure 3.3.3
-
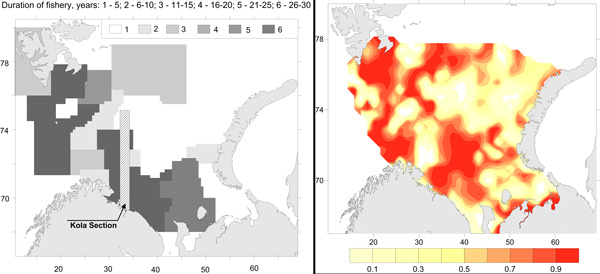
Commercial fishery impact on zoobenthos of the Barents Sea. Figure A) Intensity and duration of fishery efforts in standard commercial fishery areas in the Barents Sea. The darker the area the longer the fishery has been in operation. Figure B) Level of decline in macrobenthic biomass between 1926-1932 and 1968-1970 calculated as 1-b1968/b1930. The largest biomass decreases correspond to the darker colour, whereas lighter colour refers to no change (Denisenko 2013). STATE OF THE ARCTIC MARINE BIODIVERSITY REPORT - <a href="https://arcticbiodiversity.is/findings/benthos" target="_blank">Chapter 3</a> - Page 97 - Figure 3.3.4
-
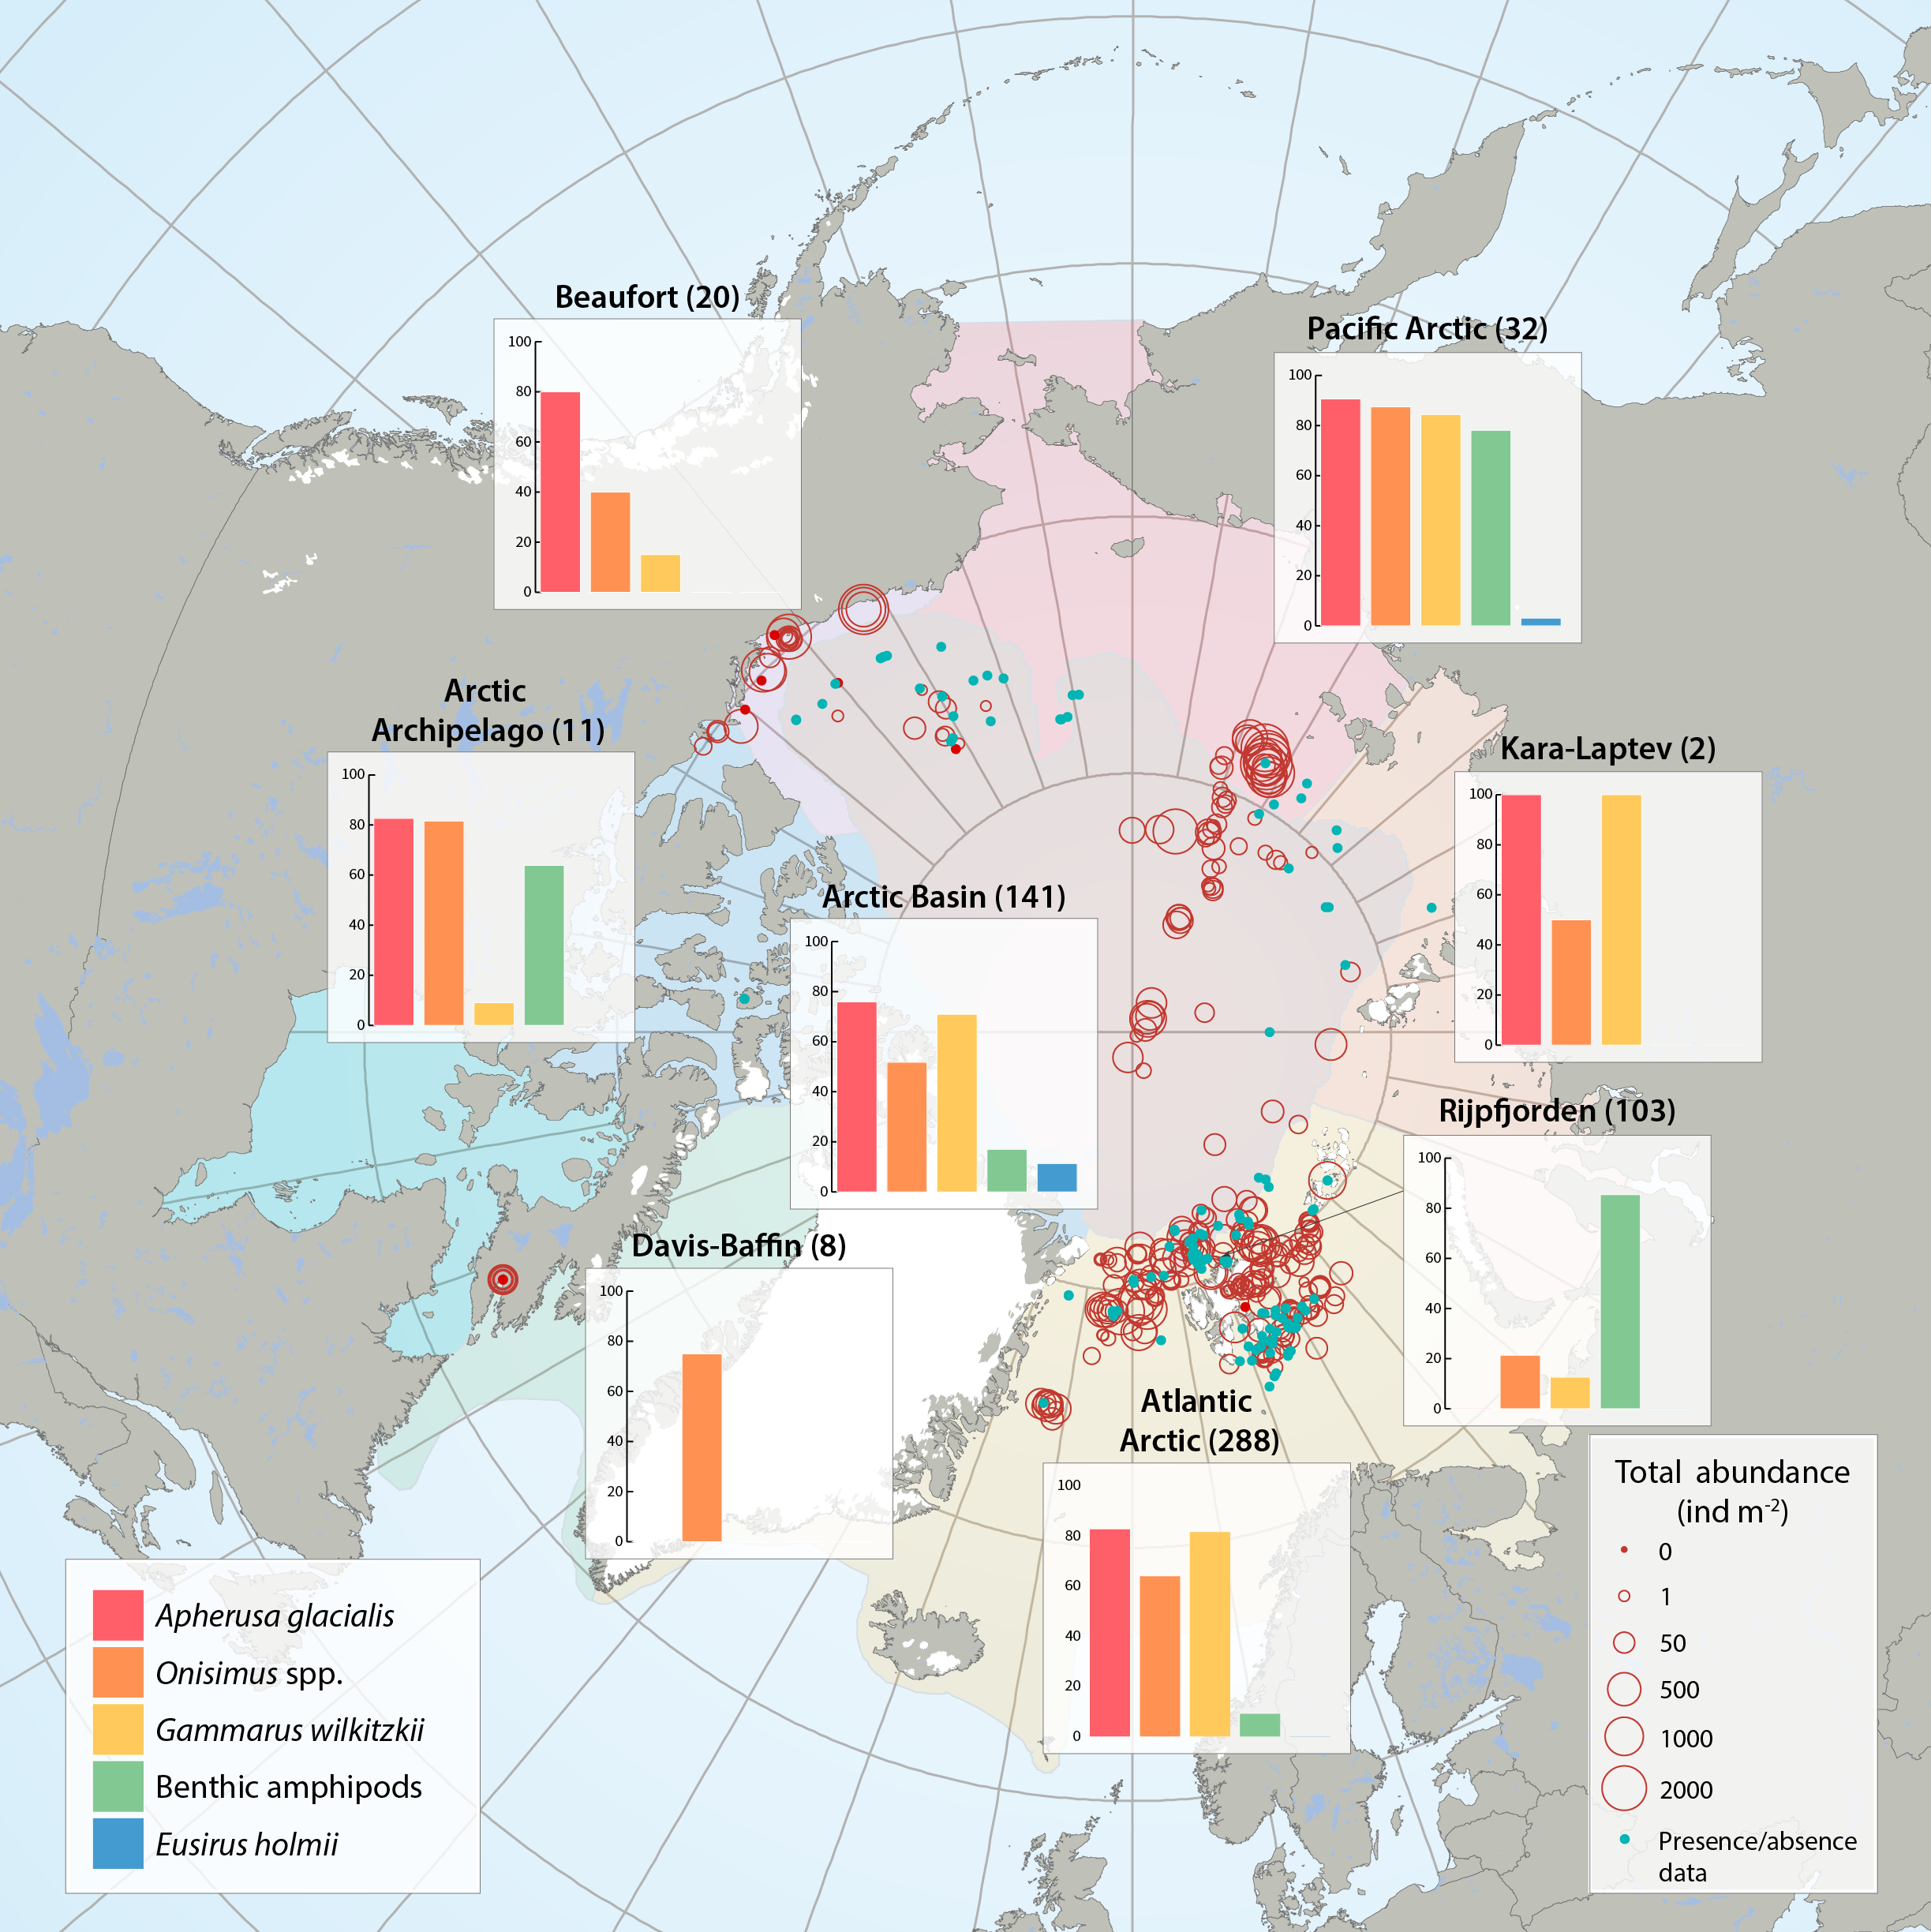
Sea ice amphipod (macrofauna) distribution and abundance across the Arctic aggregated from 47 sources between 1977 and 2012 by the CBMP Sea Ice Biota Expert Network. Bar graphs illustrate the frequency of occurrence (%) of amphipods in samples that contained at least one ice-associated amphipod. Red circles illustrate the total abundances of all ice-associated amphipods in quantitative samples (individuals m-2) at locations of sampling for each Arctic Marine Area (AMA). Number of sampling efforts for each region is given in parenthesis after region name. Blue dots represent samples where only presence/ absence data were available and where amphipods were present. STATE OF THE ARCTIC MARINE BIODIVERSITY REPORT - <a href="https://arcticbiodiversity.is/findings/sea-ice-biota" target="_blank">Chapter 3</a> - Page 44 - Figure 3.1.6 From the report draft: "This summary includes 47 data sources of under-ice amphipods published between 1977 and 2012. When available, we collected information on abundance or density (ind. m-2, or ind. m-3 that were converted to ind. m-2) and biomass (g m-2, wet weight). If abundance or biomass data were not available, we examined presence/relative abundance information. Frequency of occurrence was calculated for regions across the Arctic using integrated data for all available years."
-
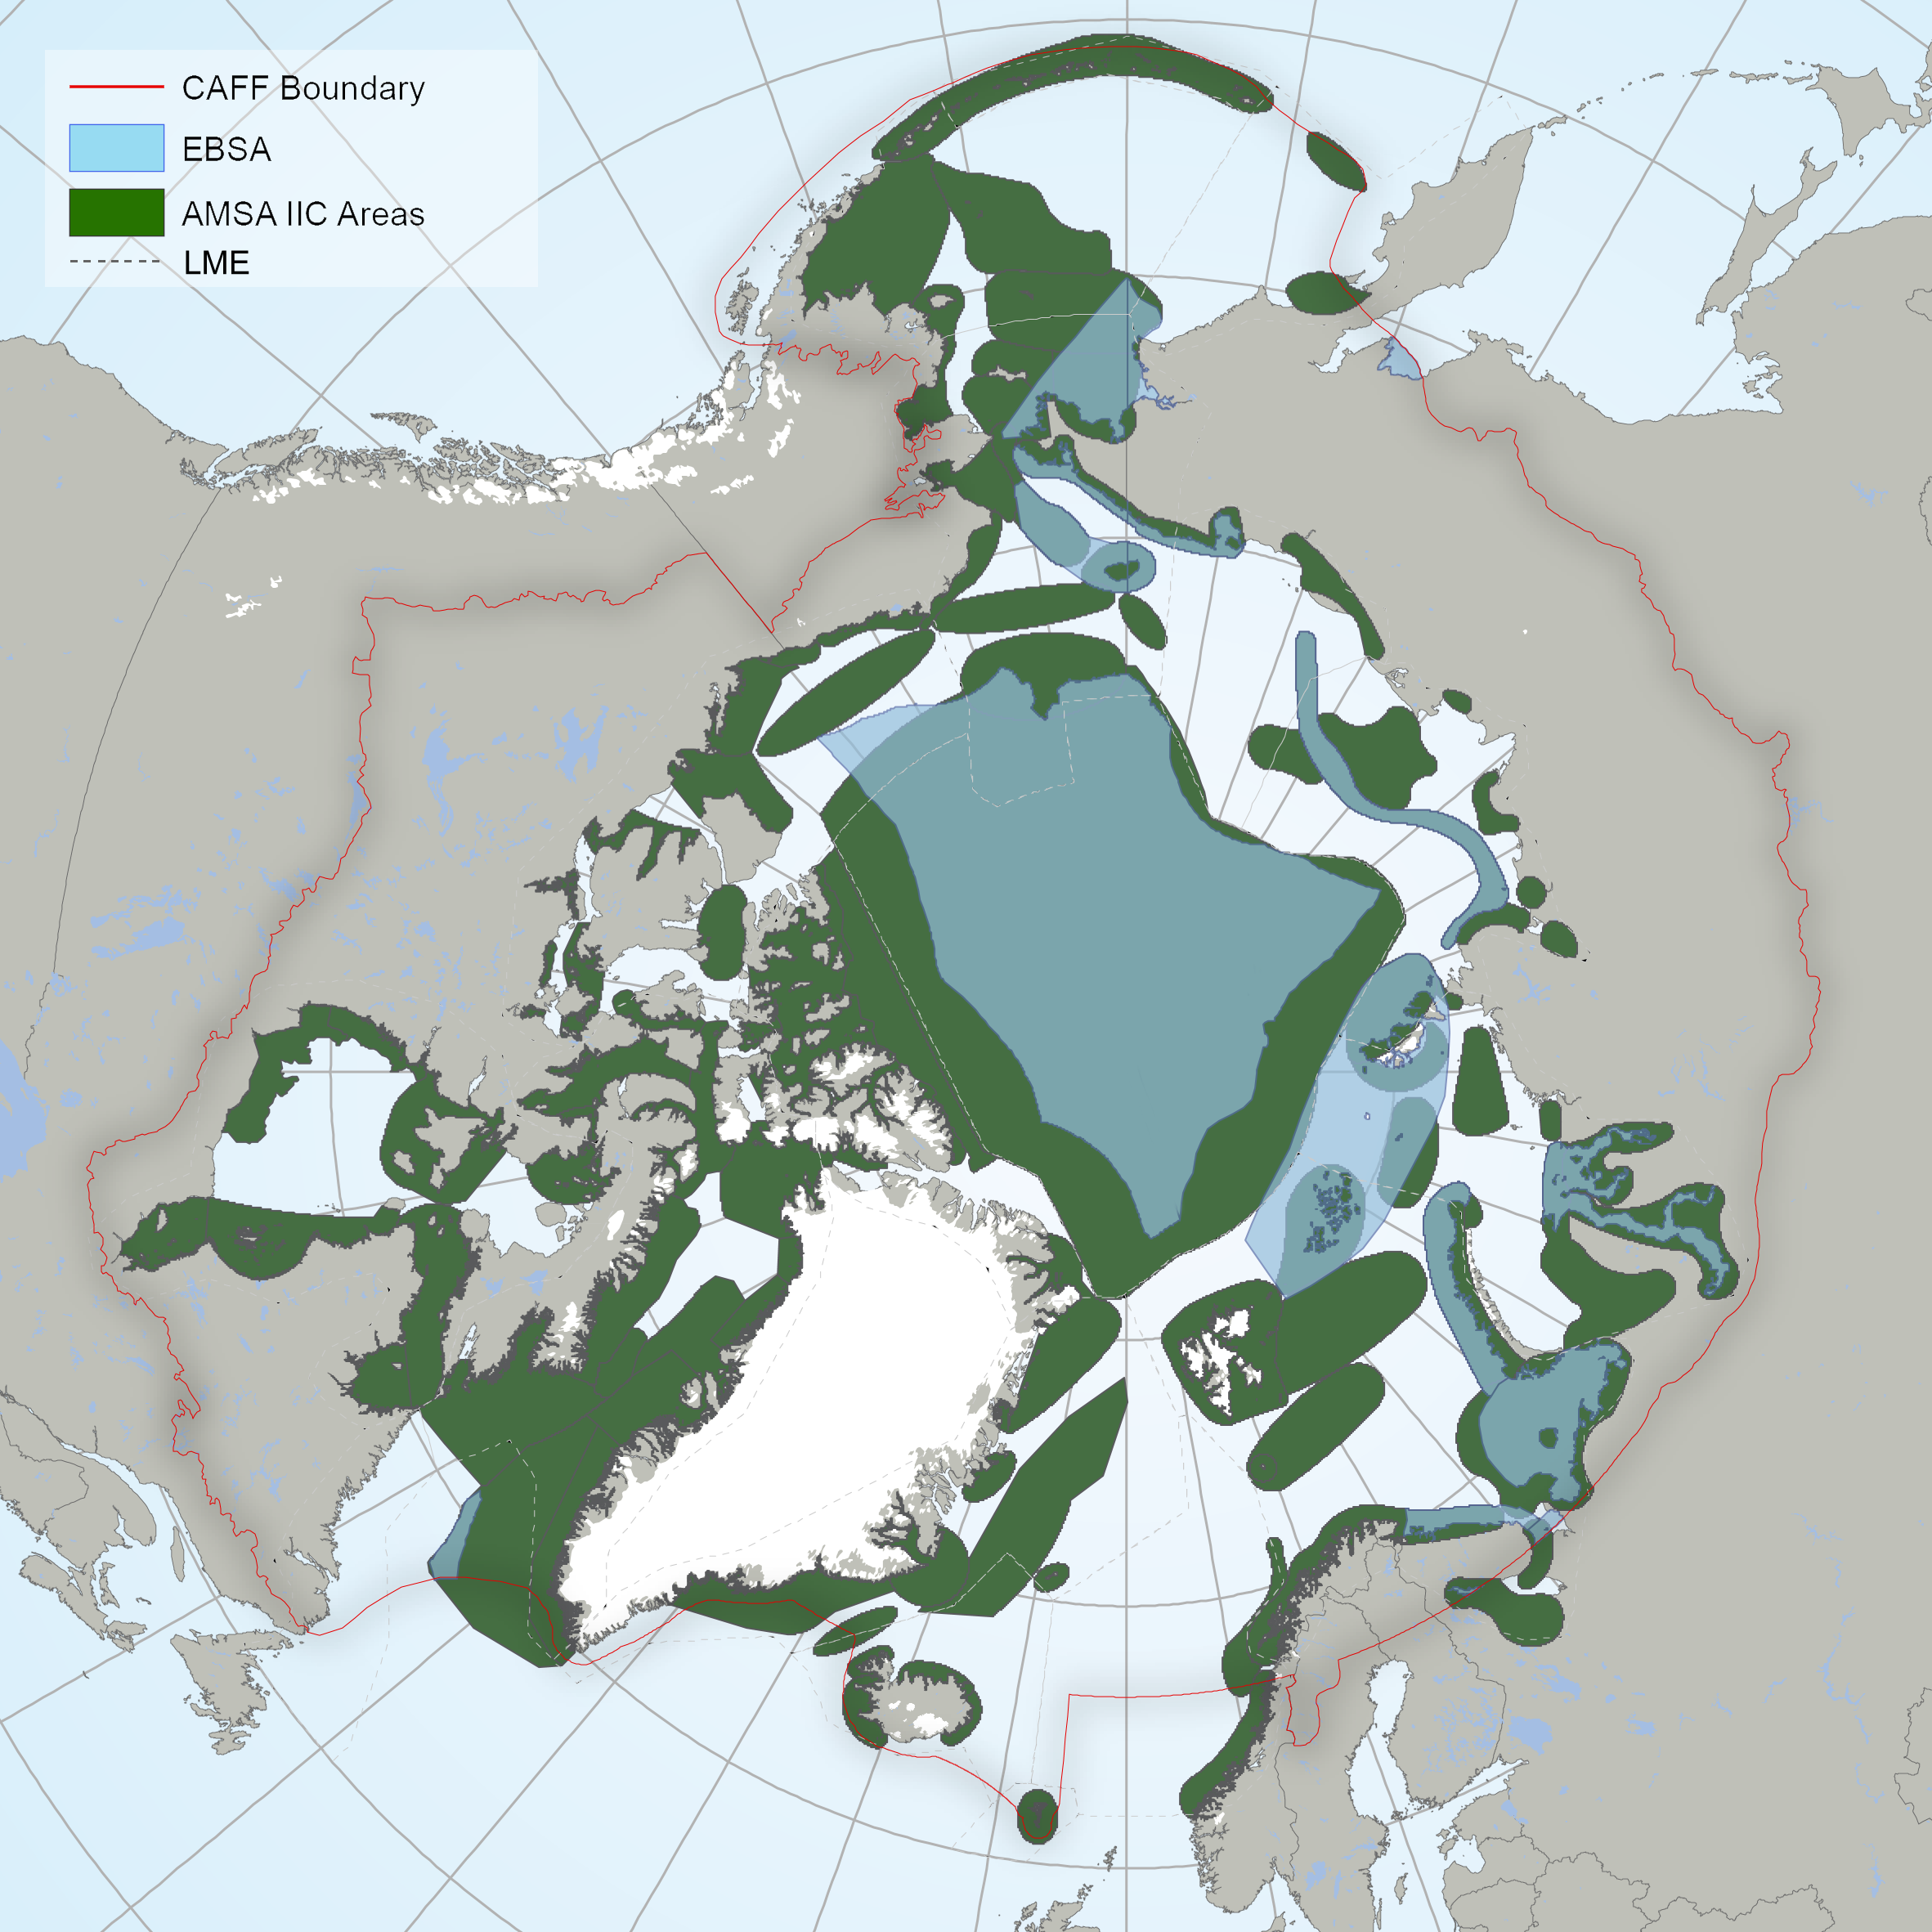
EBSAs (Source: CBD 2016) and marine “areas of heightened ecological and cultural significance” (Source: AMAP/CAFF/SDWG, 2013). In 2013, the Arctic Council identified “Areas of heightened ecological and cultural significance” using the International Maritime Organization criteria for Particularly Sensitive Sea Areas (PSSAs), which are similar to the CBD Ecologically and Biologically Significant Areas (EBSAs) criteria. The term “areas of heightened ecological and cultural significance” comes from Recommendation IIC of the Arctic Council’s 2009 Arctic Marine Shipping Assessment: ARCTIC PROTECTED AREAS - INDICATOR REPORT 2017
-
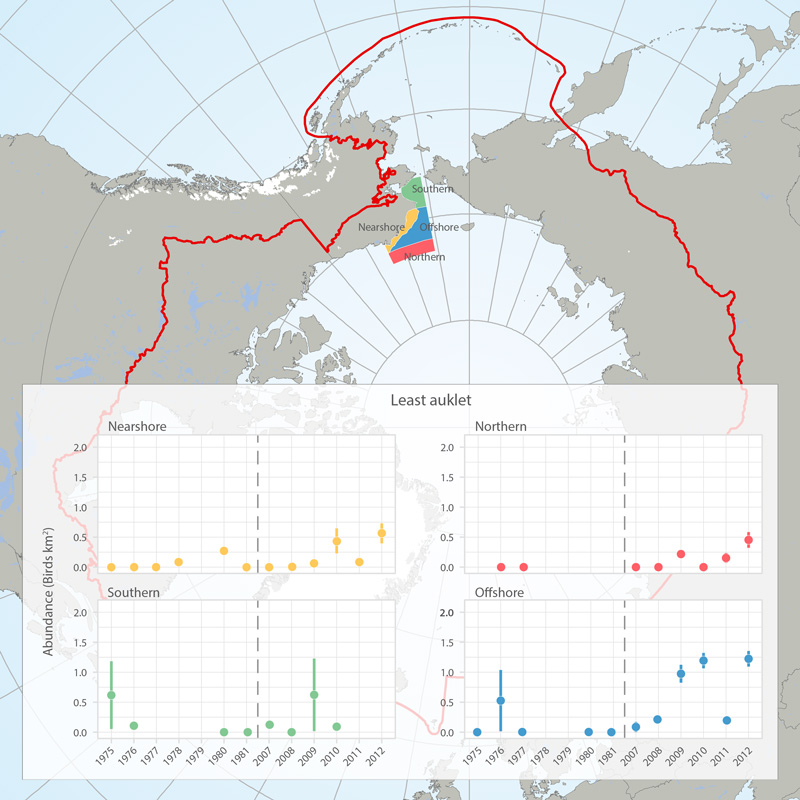
Abundance (birds/km2) of least auklets in four regions (see map) of the eastern Chukchi Sea, 1975-1981 and 2007-2012, based on at-sea surveys (archived in the North Pacific Pelagic Seabird Database). Figures provided by Adrian Gall, ABR, Inc. and reprinted with permission. STATE OF THE ARCTIC MARINE BIODIVERSITY REPORT - <a href="https://arcticbiodiversity.is/findings/seabirds" target="_blank">Chapter 3</a> - Page 138 - Box fig. 3.5.1 The shapefile outlines 4 regions of the eastern Chukchi Sea that were surveyed for seabirds during the open-water seasons of 1976-2012. We compared the density of seabirds in these regions among two time periods (1975-1981 and 2008-2012) to assess changes in seabird abundance over the past 4 decades. We also include a figure showing abundance of Least Auklets 1975-2012. Data are from the North Pacific Pelagic Seabird Database, maintained by the USGS (http://alaska.usgs.gov/science/biology/nppsd/index.php).
-

Interannual differences in taxonomic composition of phytoplankton during summer in a) Kongsfjorden and b) Rijpfjorden (Source: MOSJ, Norwegian Polar Institute). STATE OF THE ARCTIC MARINE BIODIVERSITY REPORT - <a href="https://arcticbiodiversity.is/findings/plankton" target="_blank">Chapter 3</a> - Page 74 - Figure 3.2.5
-
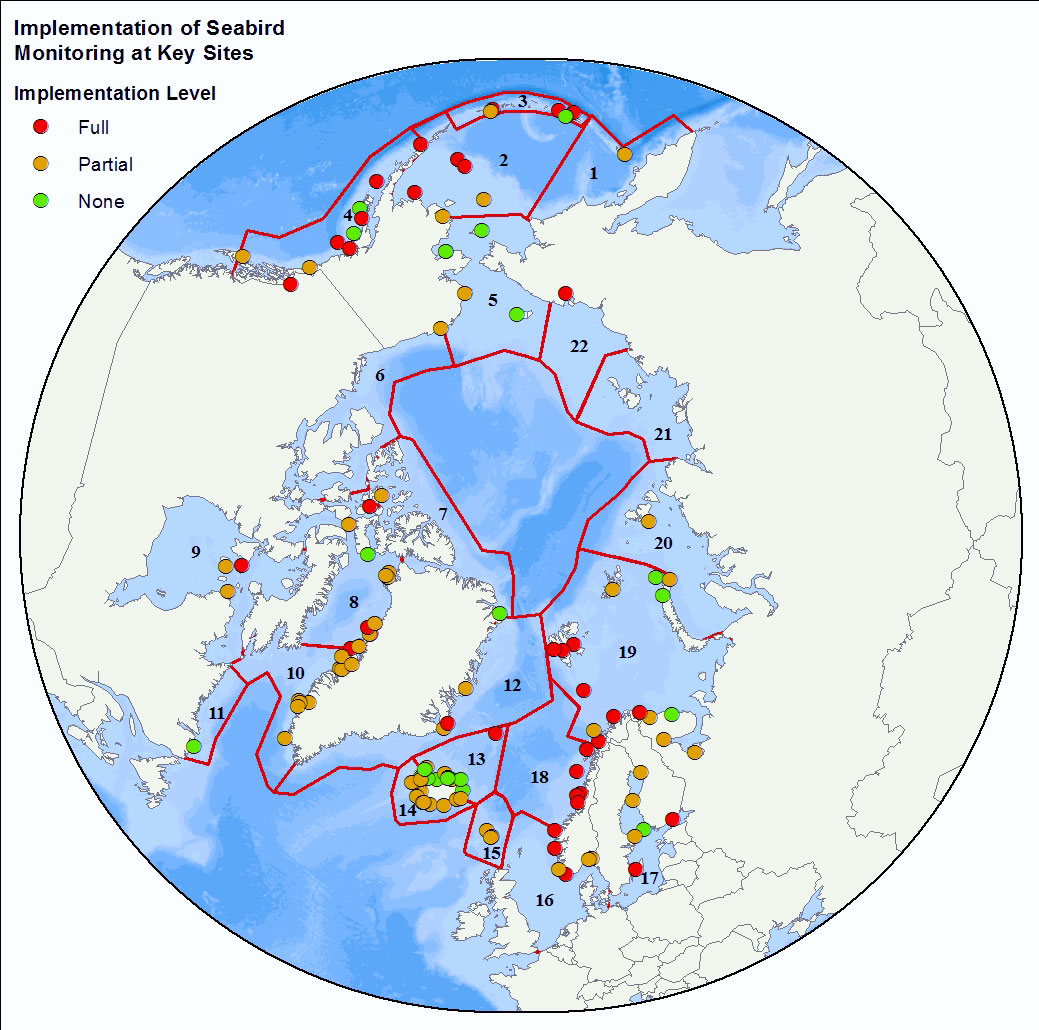
<img width="80px" height="67px" alt="logo" align="left" hspace="10px" src="http://geo.abds.is/geonetwork/srv/eng//resources.get?uuid=7d8986b1-fbd1-4e1a-a7c8-a4cef13e8eca&fname=cbird.png">The Circumpolar Seabird Monitoring Plan is designed to 1) monitor populations of selected Arctic seabird species, in one or more Arctic countries; 2) monitor, as appropriate, survival, diets, breeding phenology, and productivity of seabirds in a manner that allows changes to be detected; 3) provide circumpolar information on the status of seabirds to the management agencies of Arctic countries, in order to broaden their knowledge beyond the boundaries of their country thereby allowing management decisions to be made based on the best available information; 4) inform the public through outreach mechanisms as appropriate; 5) provide information on changes in the marine ecosystem by using seabirds as indicators; and 6) quickly identify areas or issue in the Arctic ecosystem such as declining biodiversity or environmental pressures to target further research and plan management and conservation measures. - <a href="http://caff.is" target="_blank"> Circumpolar Seabird Monitoring plan </a>