 Arctic Biodiversity Data Service - ABDS Catalog
unknown
Type of resources
Available actions
Topics
Keywords
Contact for the resource
Provided by
Years
Formats
Representation types
Update frequencies
status
Scale
-
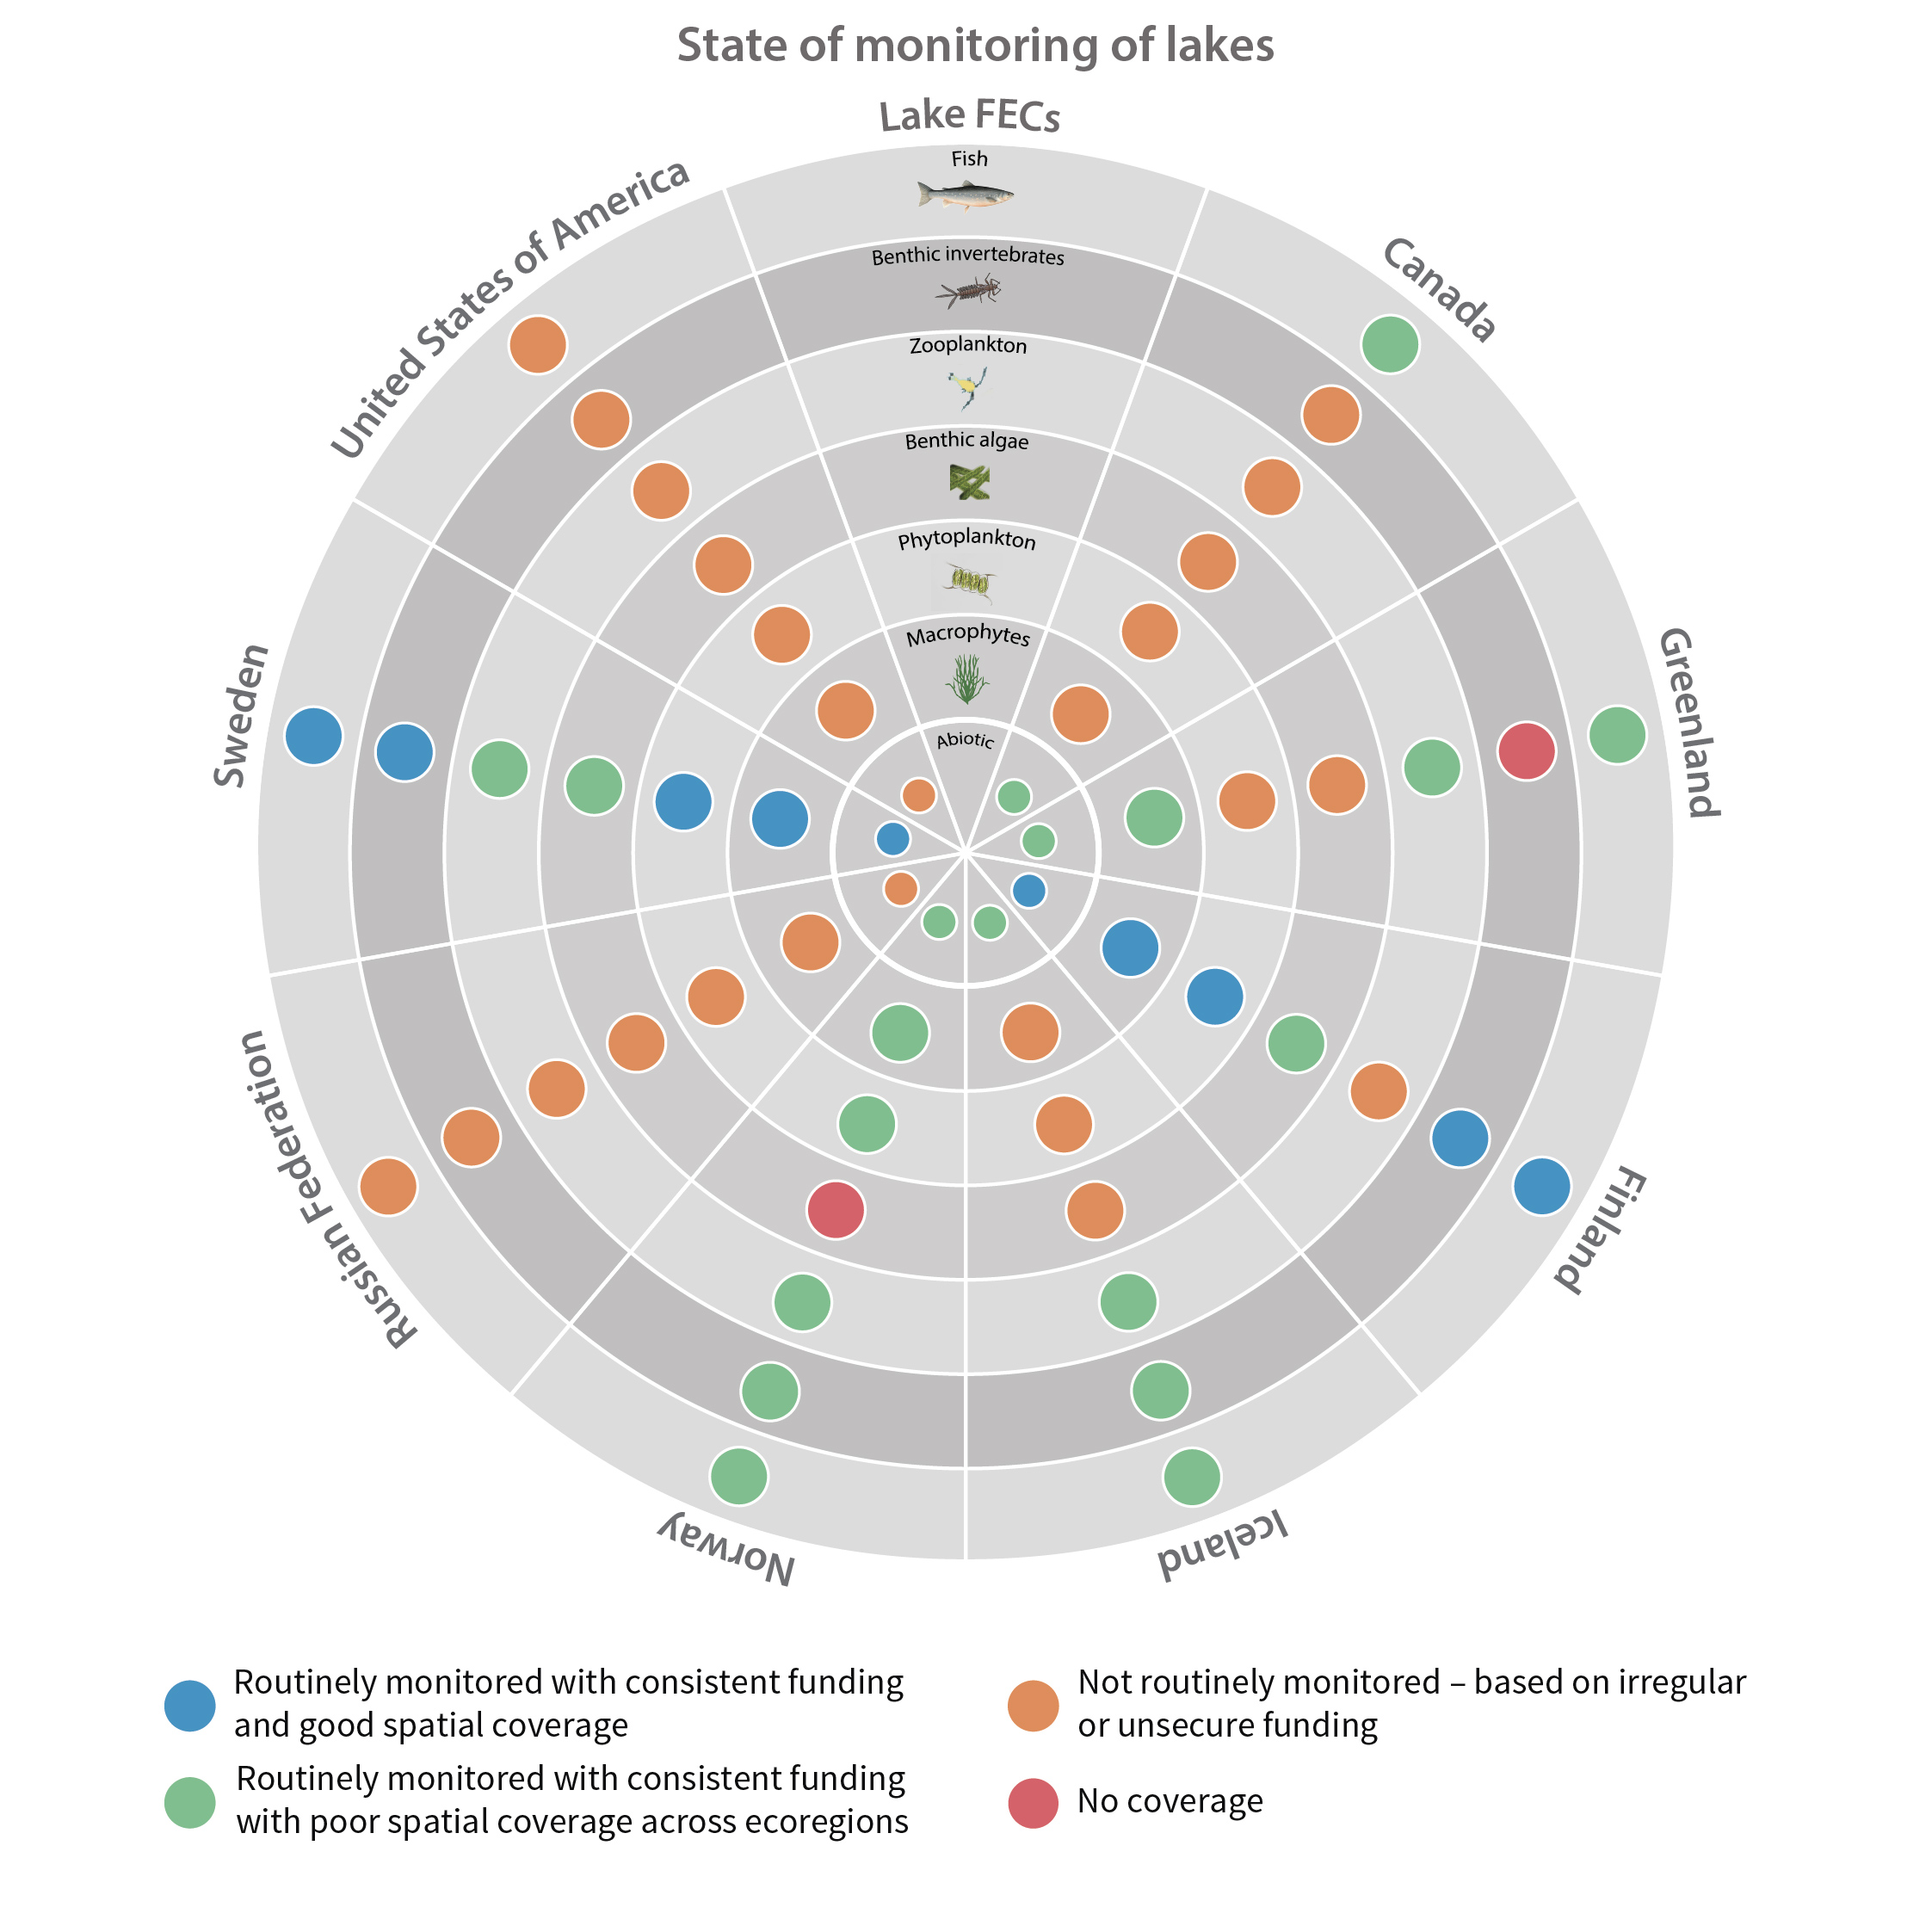
Although the circumpolar countries endeavor to support monitoring programs that provide good coverage of Arctic and subarctic regions, this ideal is constrained by the high costs associated with repeated sampling of a large set of lakes and rivers in areas that often are very remote. Consequently, freshwater monitoring has sparse, spatial coverage in large parts of the Arctic, with only Fennoscandia and Iceland having extensive monitoring coverage of lakes and streams Figure 6-1 Current state of monitoring for lake FECs in each Arctic country. State of the Arctic Freshwater Biodiversity Report - Chapter 6 - Page 93 - Figure 6-1
-
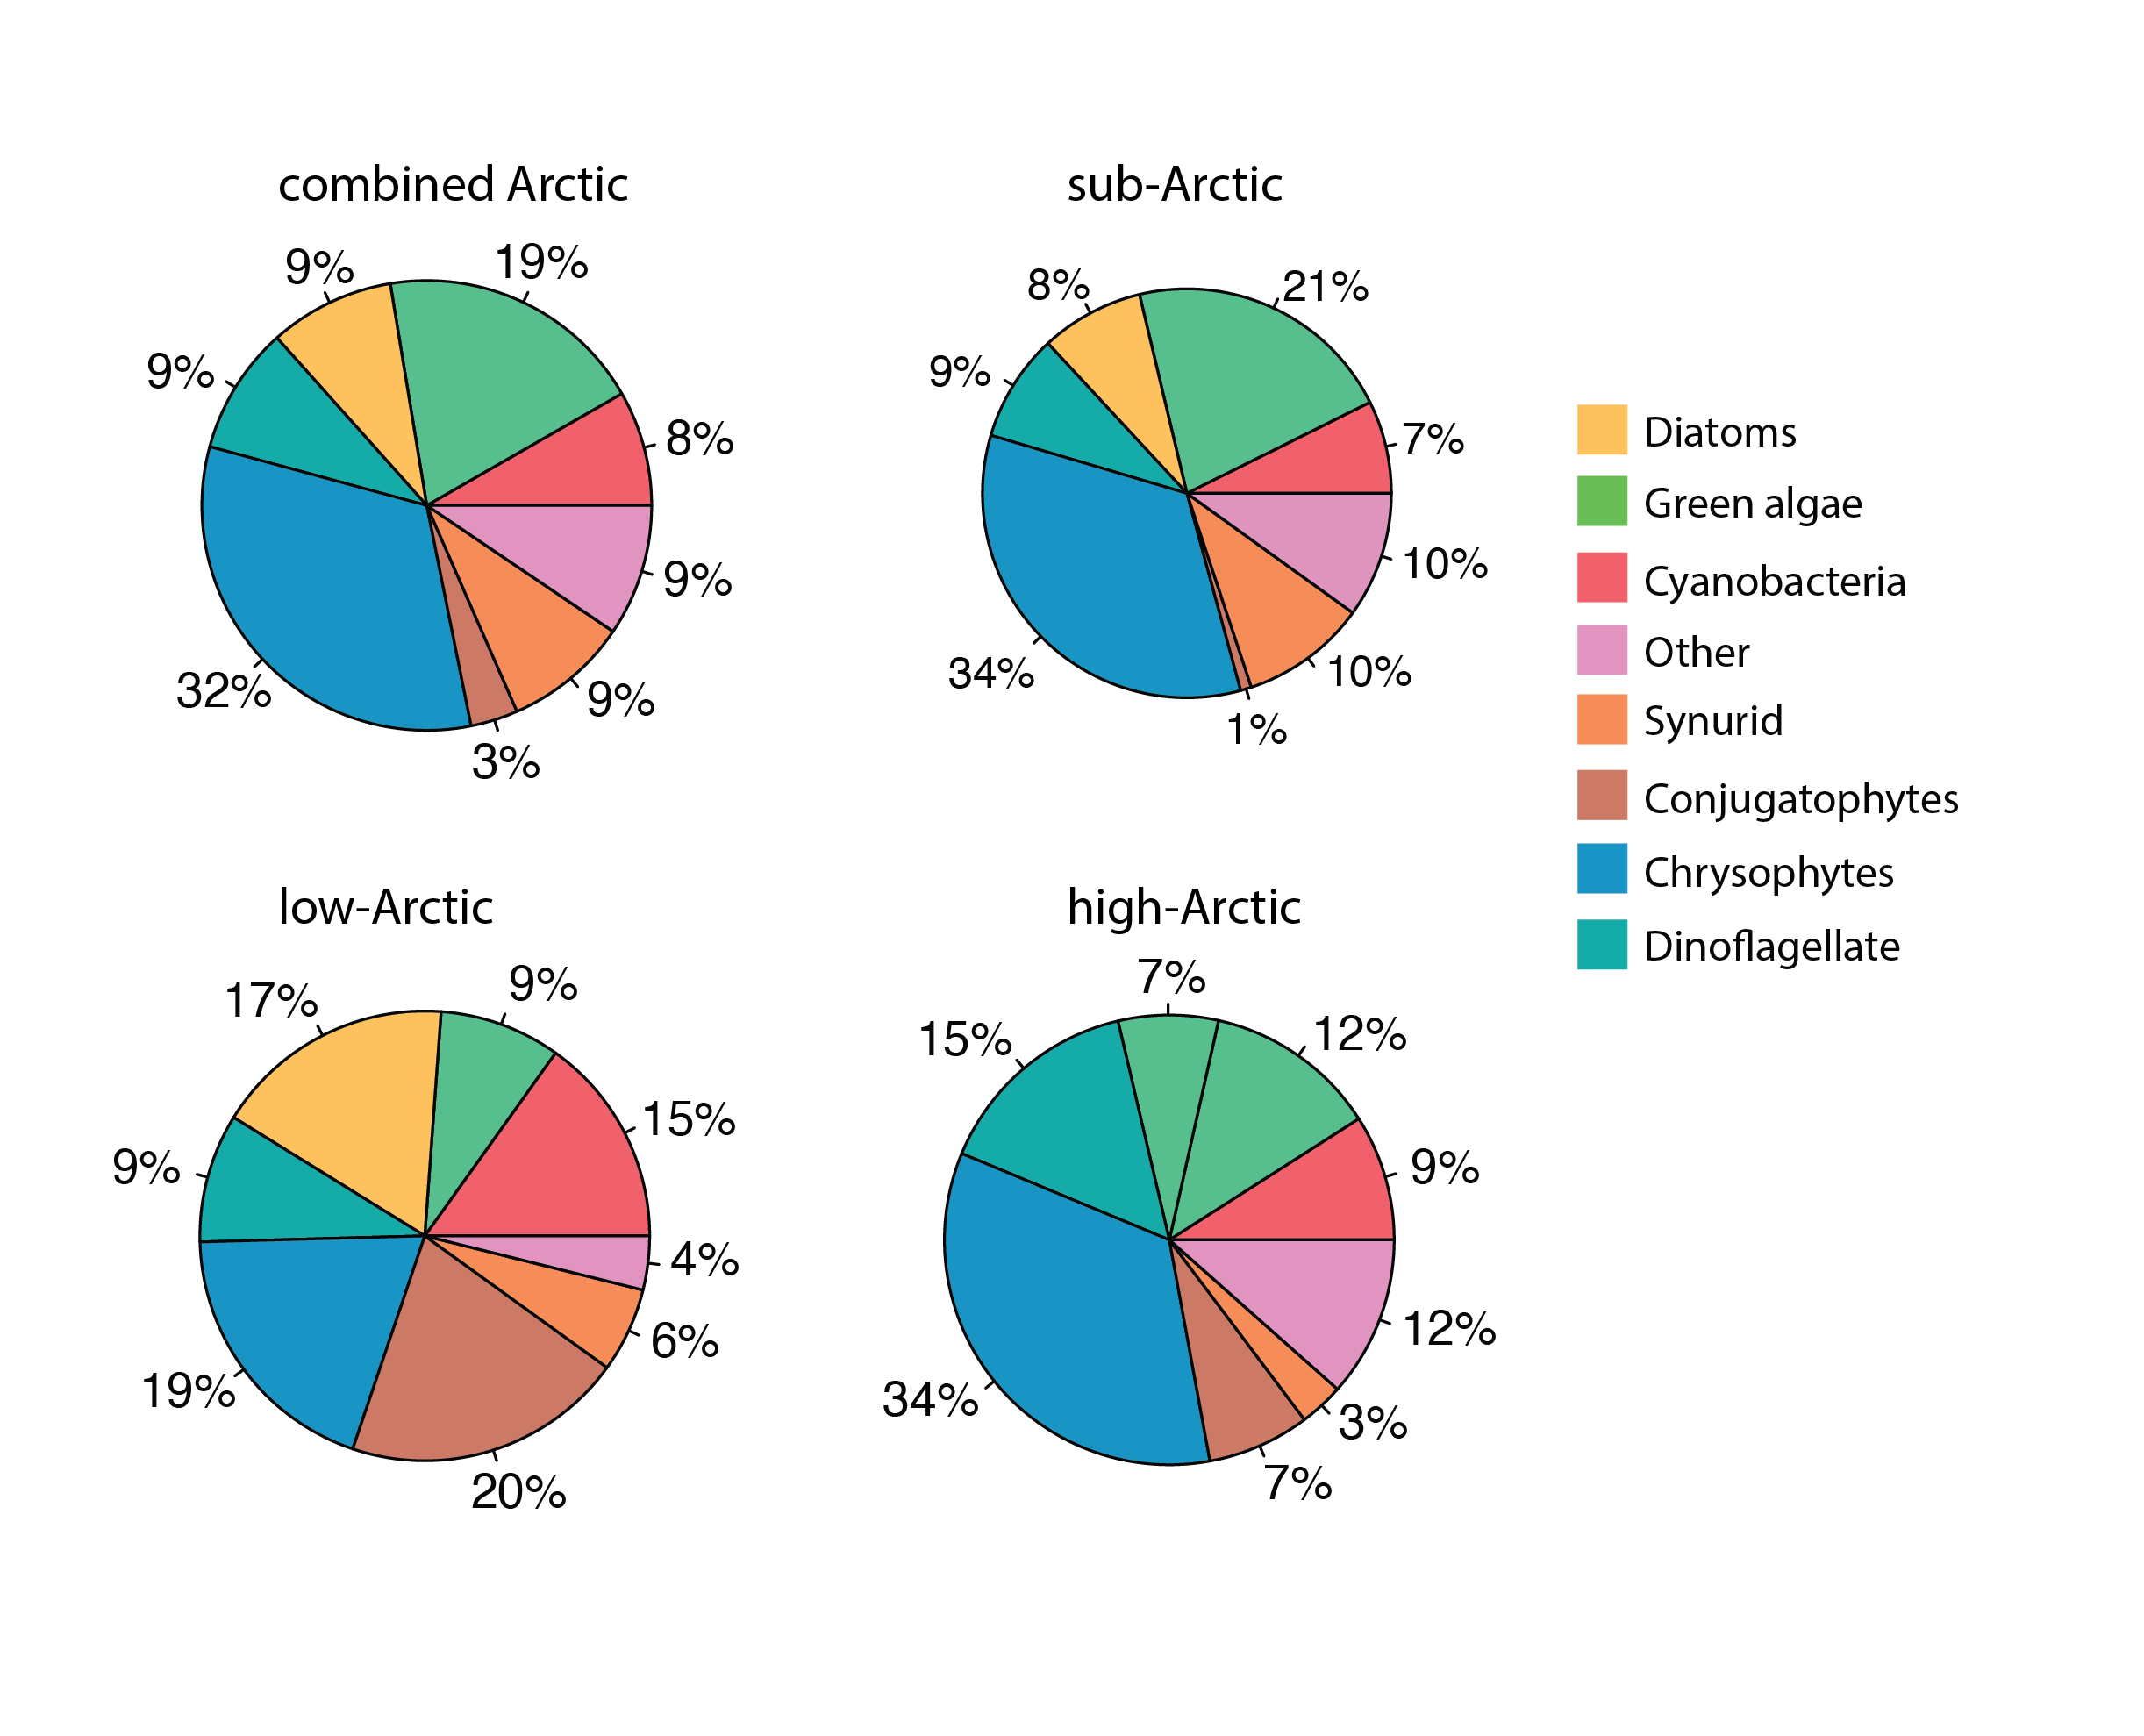
Phytoplankton percent composition by dominant classes across the three Arctic regions, using relative presence across stations calculated from from presence – absence data. State of the Arctic Freshwater Biodiversity Report - Chapter 4 - Page 48 - Figure 4-19
-
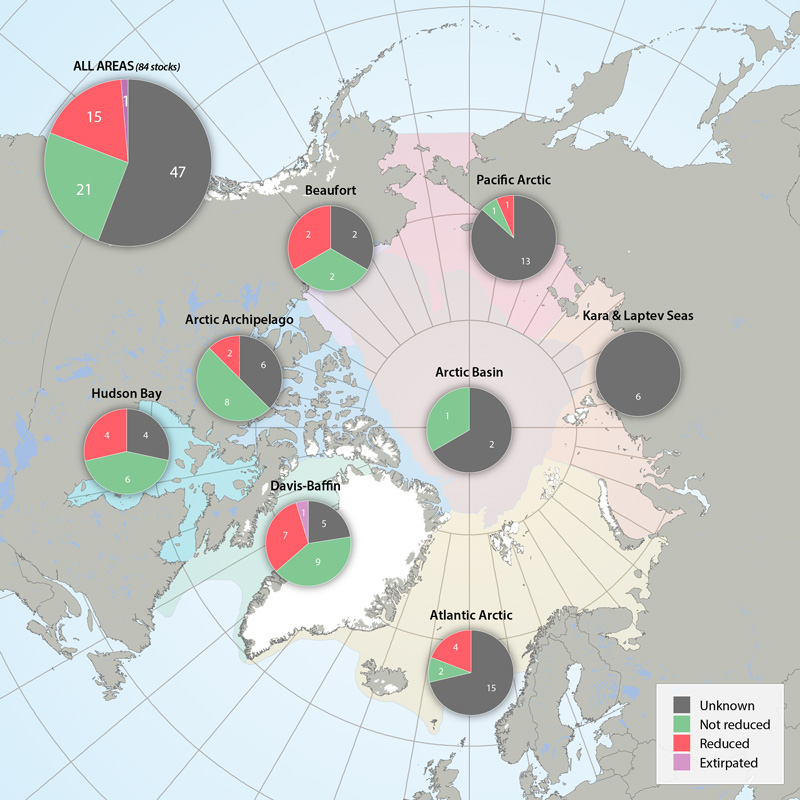
Status of marine mammal Focal Ecosystem Component stocks by Arctic Marine Area. STATE OF THE ARCTIC MARINE BIODIVERSITY REPORT - <a href="https://arcticbiodiversity.is/findings/marine-mammals" target="_blank">Chapter 3</a> - Page 157 - Figure 3.6.3
-
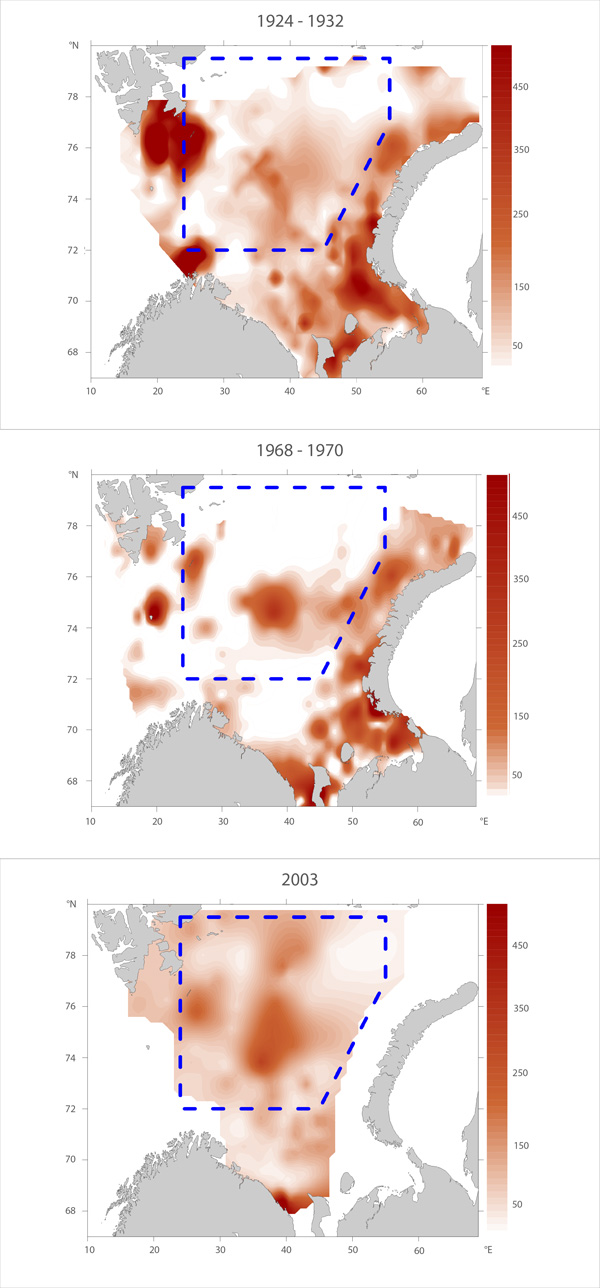
Macrofauna distribution of biomass (g wet fixed weight m-2) in the Barents Sea over three time periods: 1924-32 (Figure A), 1968-70 (Figure B) and 2003 (Figure C, constructed from original archive data, except for area south of 72° N where digitized megafaunal-data taken from Anisimova et al. (2010) was used. Adapted from Denisenko (2013). Blue boxes delineate the areas within which the zoobenthos biomass values were compared. STATE OF THE ARCTIC MARINE BIODIVERSITY REPORT - <a href="https://arcticbiodiversity.is/findings/benthos" target="_blank">Chapter 3</a> - Page 96- Figure 3.3.3
-
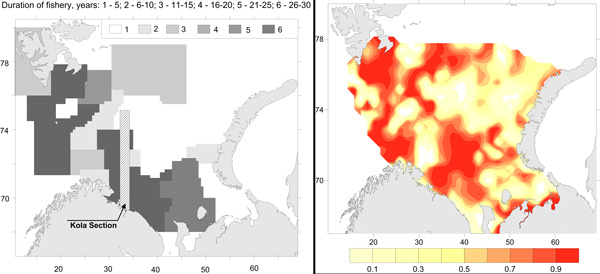
Commercial fishery impact on zoobenthos of the Barents Sea. Figure A) Intensity and duration of fishery efforts in standard commercial fishery areas in the Barents Sea. The darker the area the longer the fishery has been in operation. Figure B) Level of decline in macrobenthic biomass between 1926-1932 and 1968-1970 calculated as 1-b1968/b1930. The largest biomass decreases correspond to the darker colour, whereas lighter colour refers to no change (Denisenko 2013). STATE OF THE ARCTIC MARINE BIODIVERSITY REPORT - <a href="https://arcticbiodiversity.is/findings/benthos" target="_blank">Chapter 3</a> - Page 97 - Figure 3.3.4
-
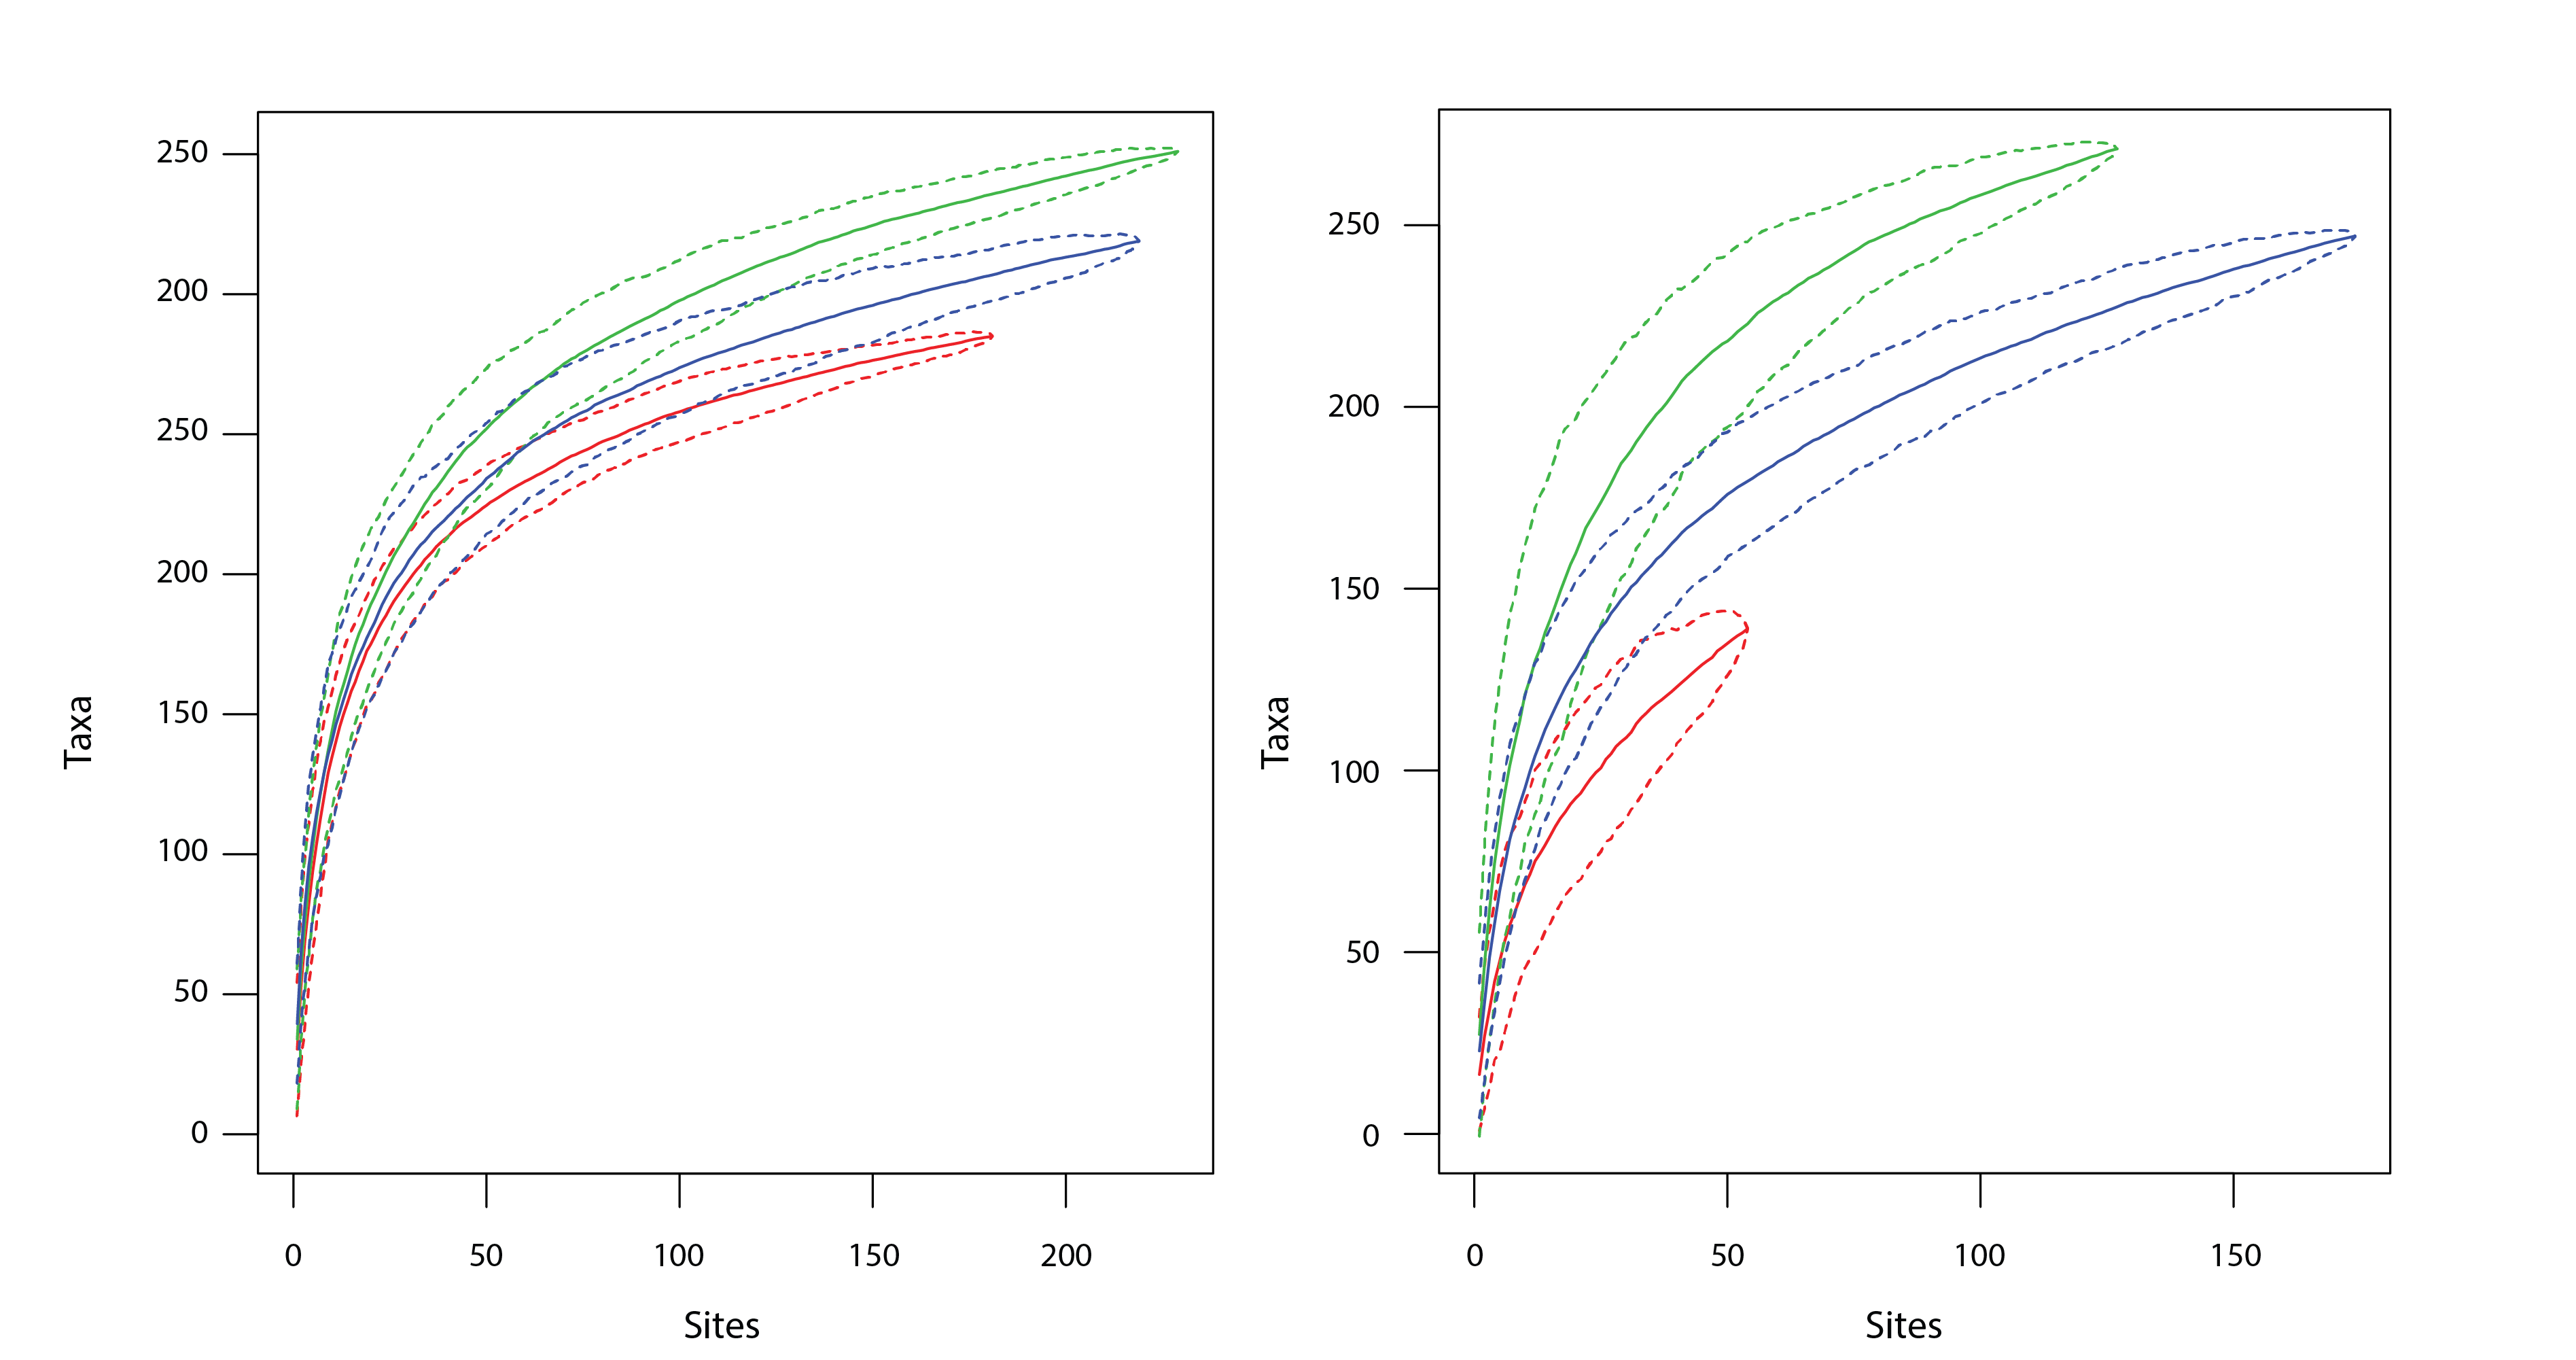
Taxa accumulation curves for (left) lake surface sediment samples, and (right) stream scrapes across the sub-Arctic (blue), Low Arctic (green) and High Arctic (red) ABA Arctic zones. Dashed lines represent the bounds of the 95% confidence interval of the estimate. State of the Arctic Freshwater Biodiversity Report - Chapter 4 - Page 38 - Figure 4-11
-
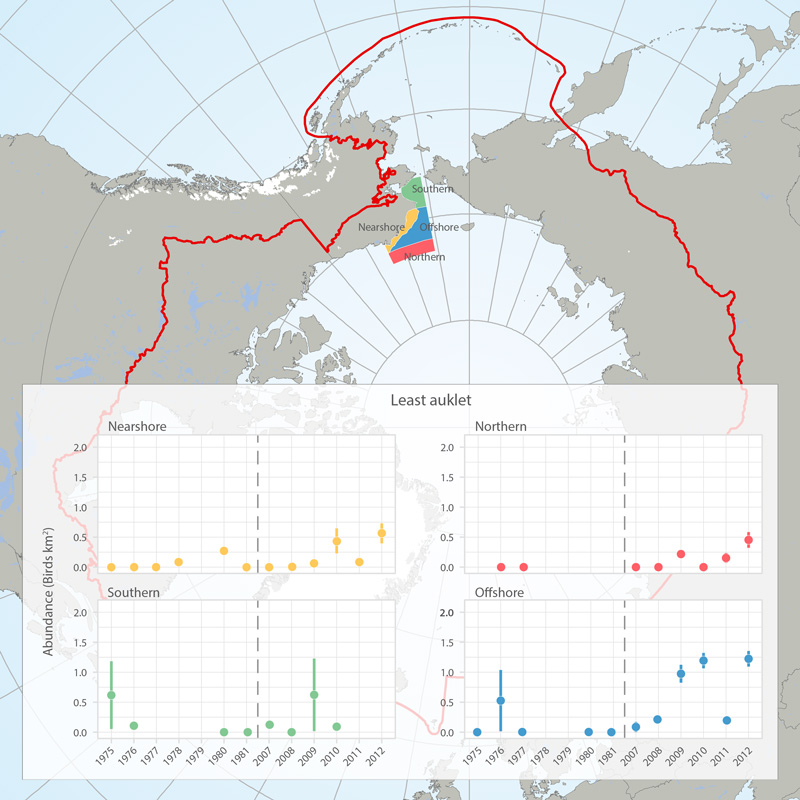
Abundance (birds/km2) of least auklets in four regions (see map) of the eastern Chukchi Sea, 1975-1981 and 2007-2012, based on at-sea surveys (archived in the North Pacific Pelagic Seabird Database). Figures provided by Adrian Gall, ABR, Inc. and reprinted with permission. STATE OF THE ARCTIC MARINE BIODIVERSITY REPORT - <a href="https://arcticbiodiversity.is/findings/seabirds" target="_blank">Chapter 3</a> - Page 138 - Box fig. 3.5.1 The shapefile outlines 4 regions of the eastern Chukchi Sea that were surveyed for seabirds during the open-water seasons of 1976-2012. We compared the density of seabirds in these regions among two time periods (1975-1981 and 2008-2012) to assess changes in seabird abundance over the past 4 decades. We also include a figure showing abundance of Least Auklets 1975-2012. Data are from the North Pacific Pelagic Seabird Database, maintained by the USGS (http://alaska.usgs.gov/science/biology/nppsd/index.php).
-
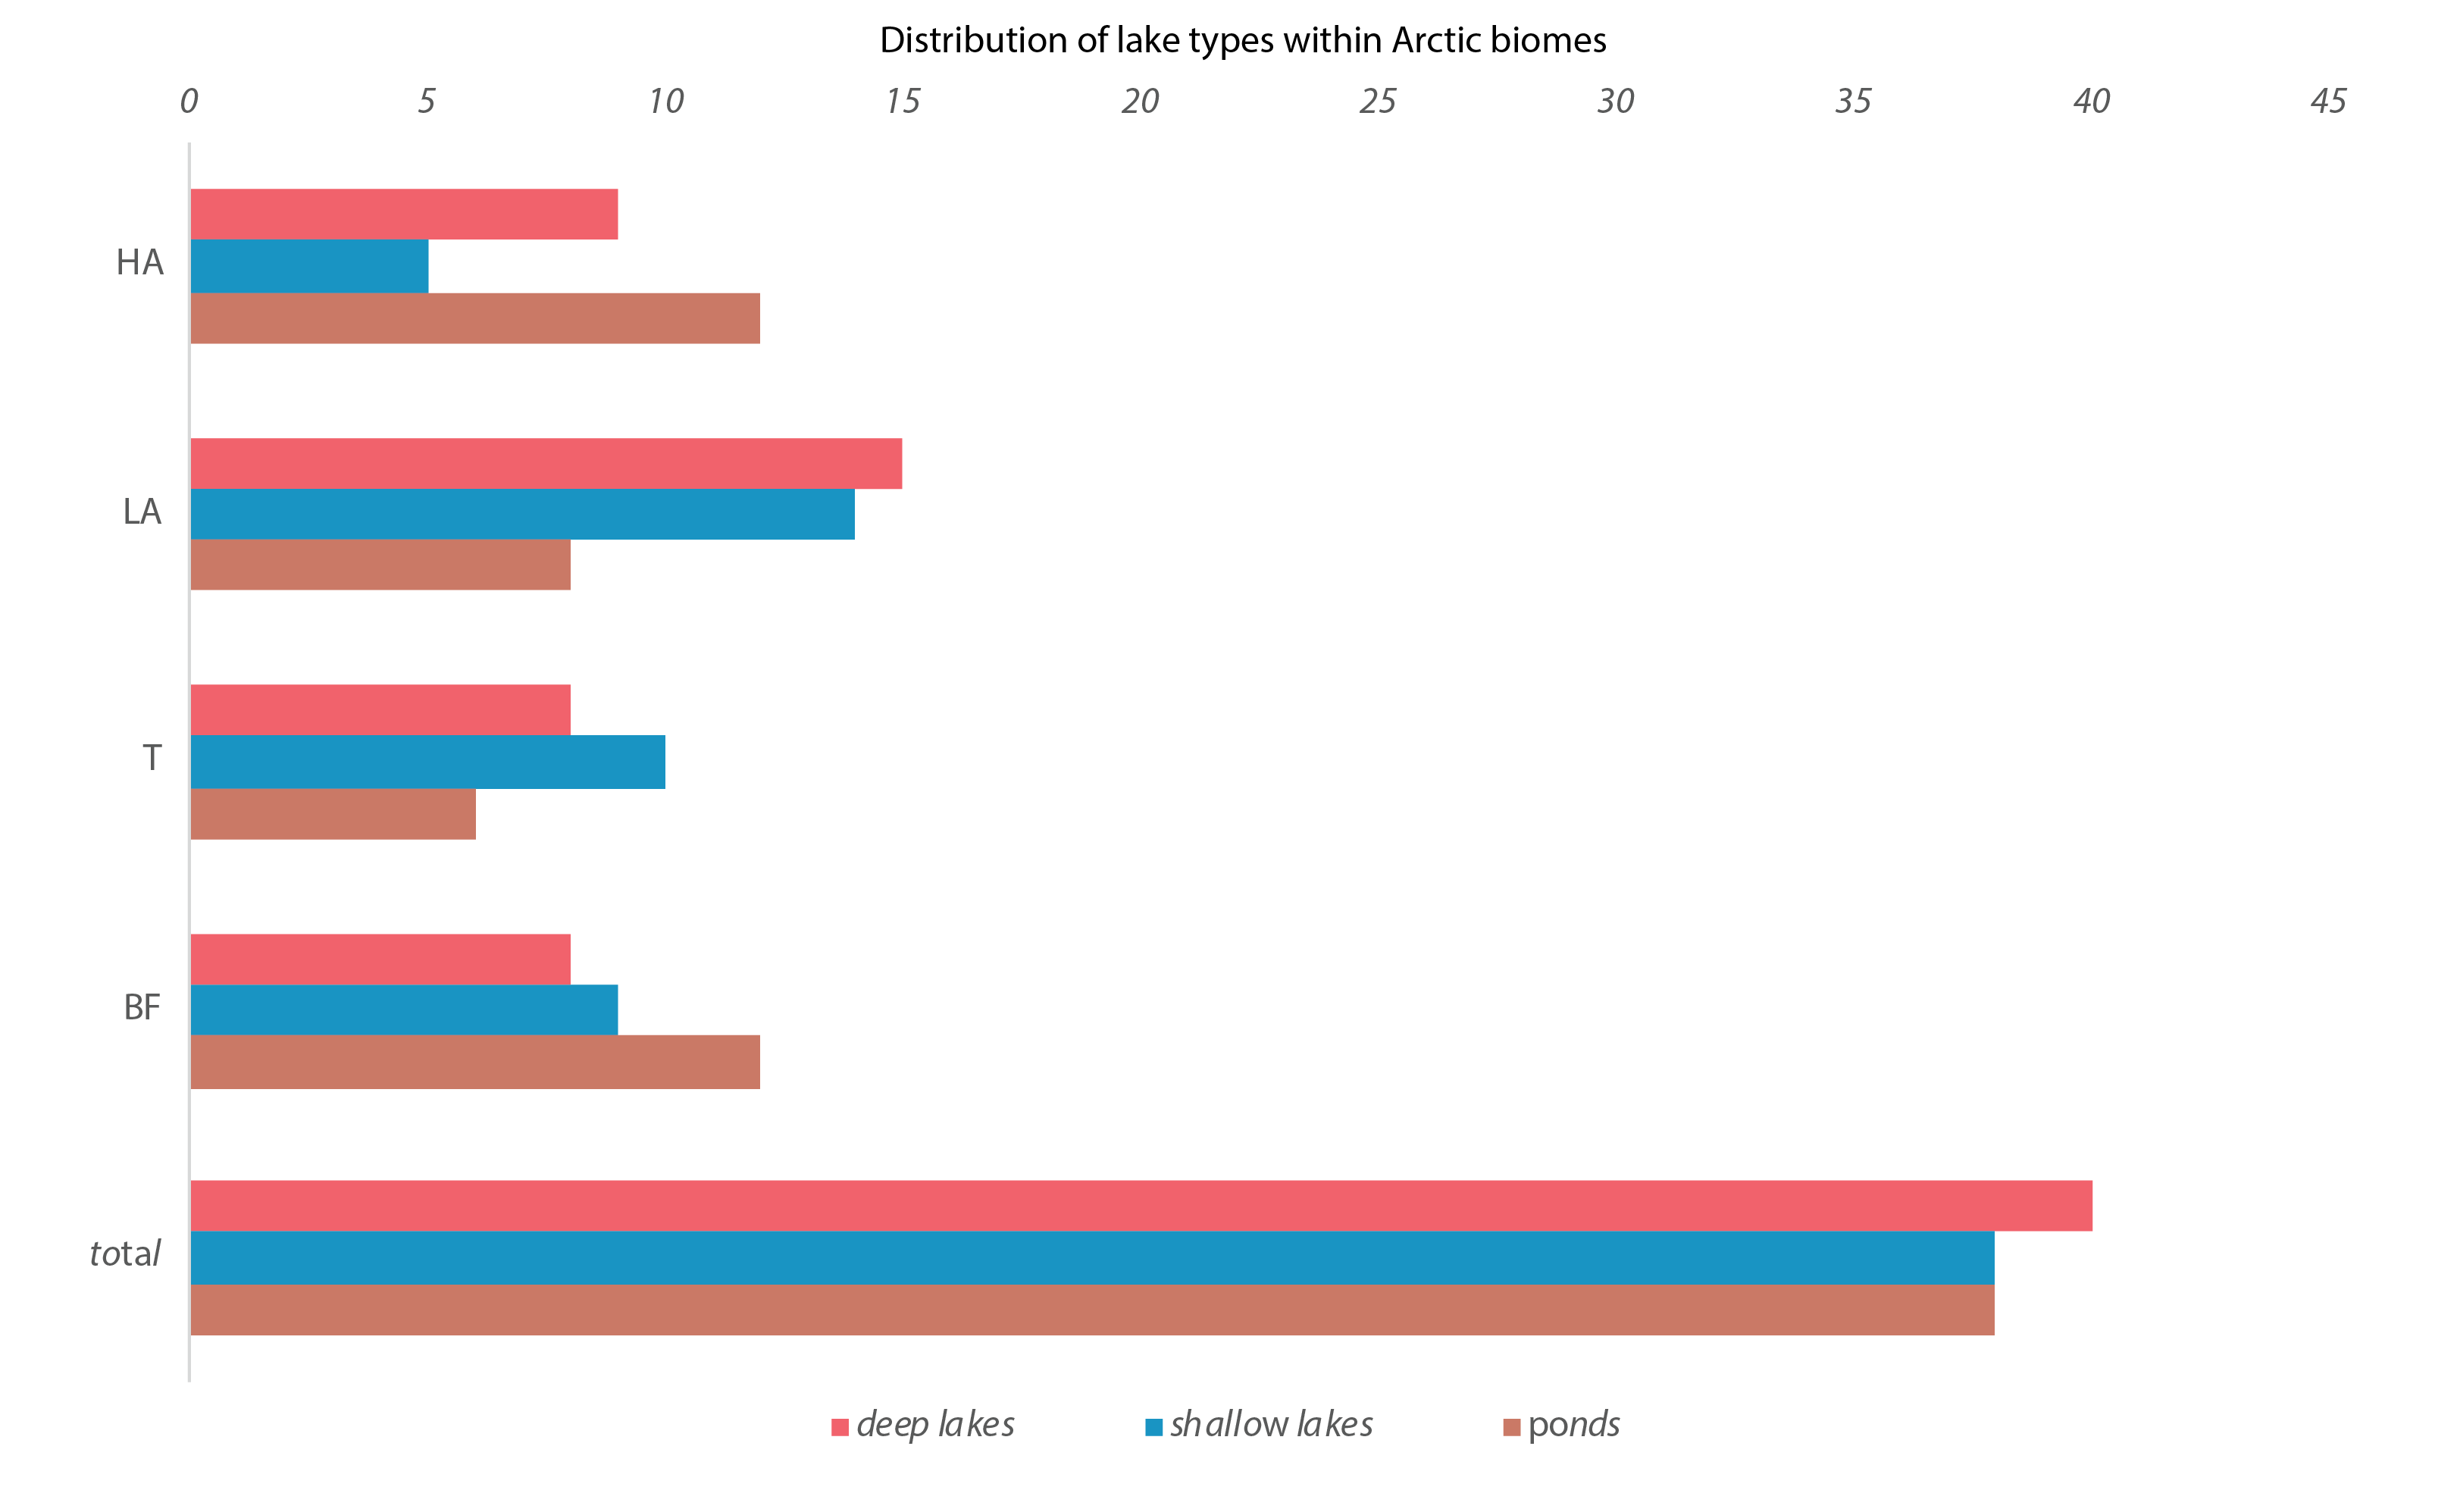
Figure 4-13 Number of deep lakes (red), shallow lakes (blue), and ponds (brown) in each geographical zone (BF, T, LA, HA). BF = Boreal Forest, T =Transition Zone, LA = Low Arctic, HA = High Arctic. State of the Arctic Freshwater Biodiversity Report - Chapter 4 - Page 40 - Figure 4-13
-
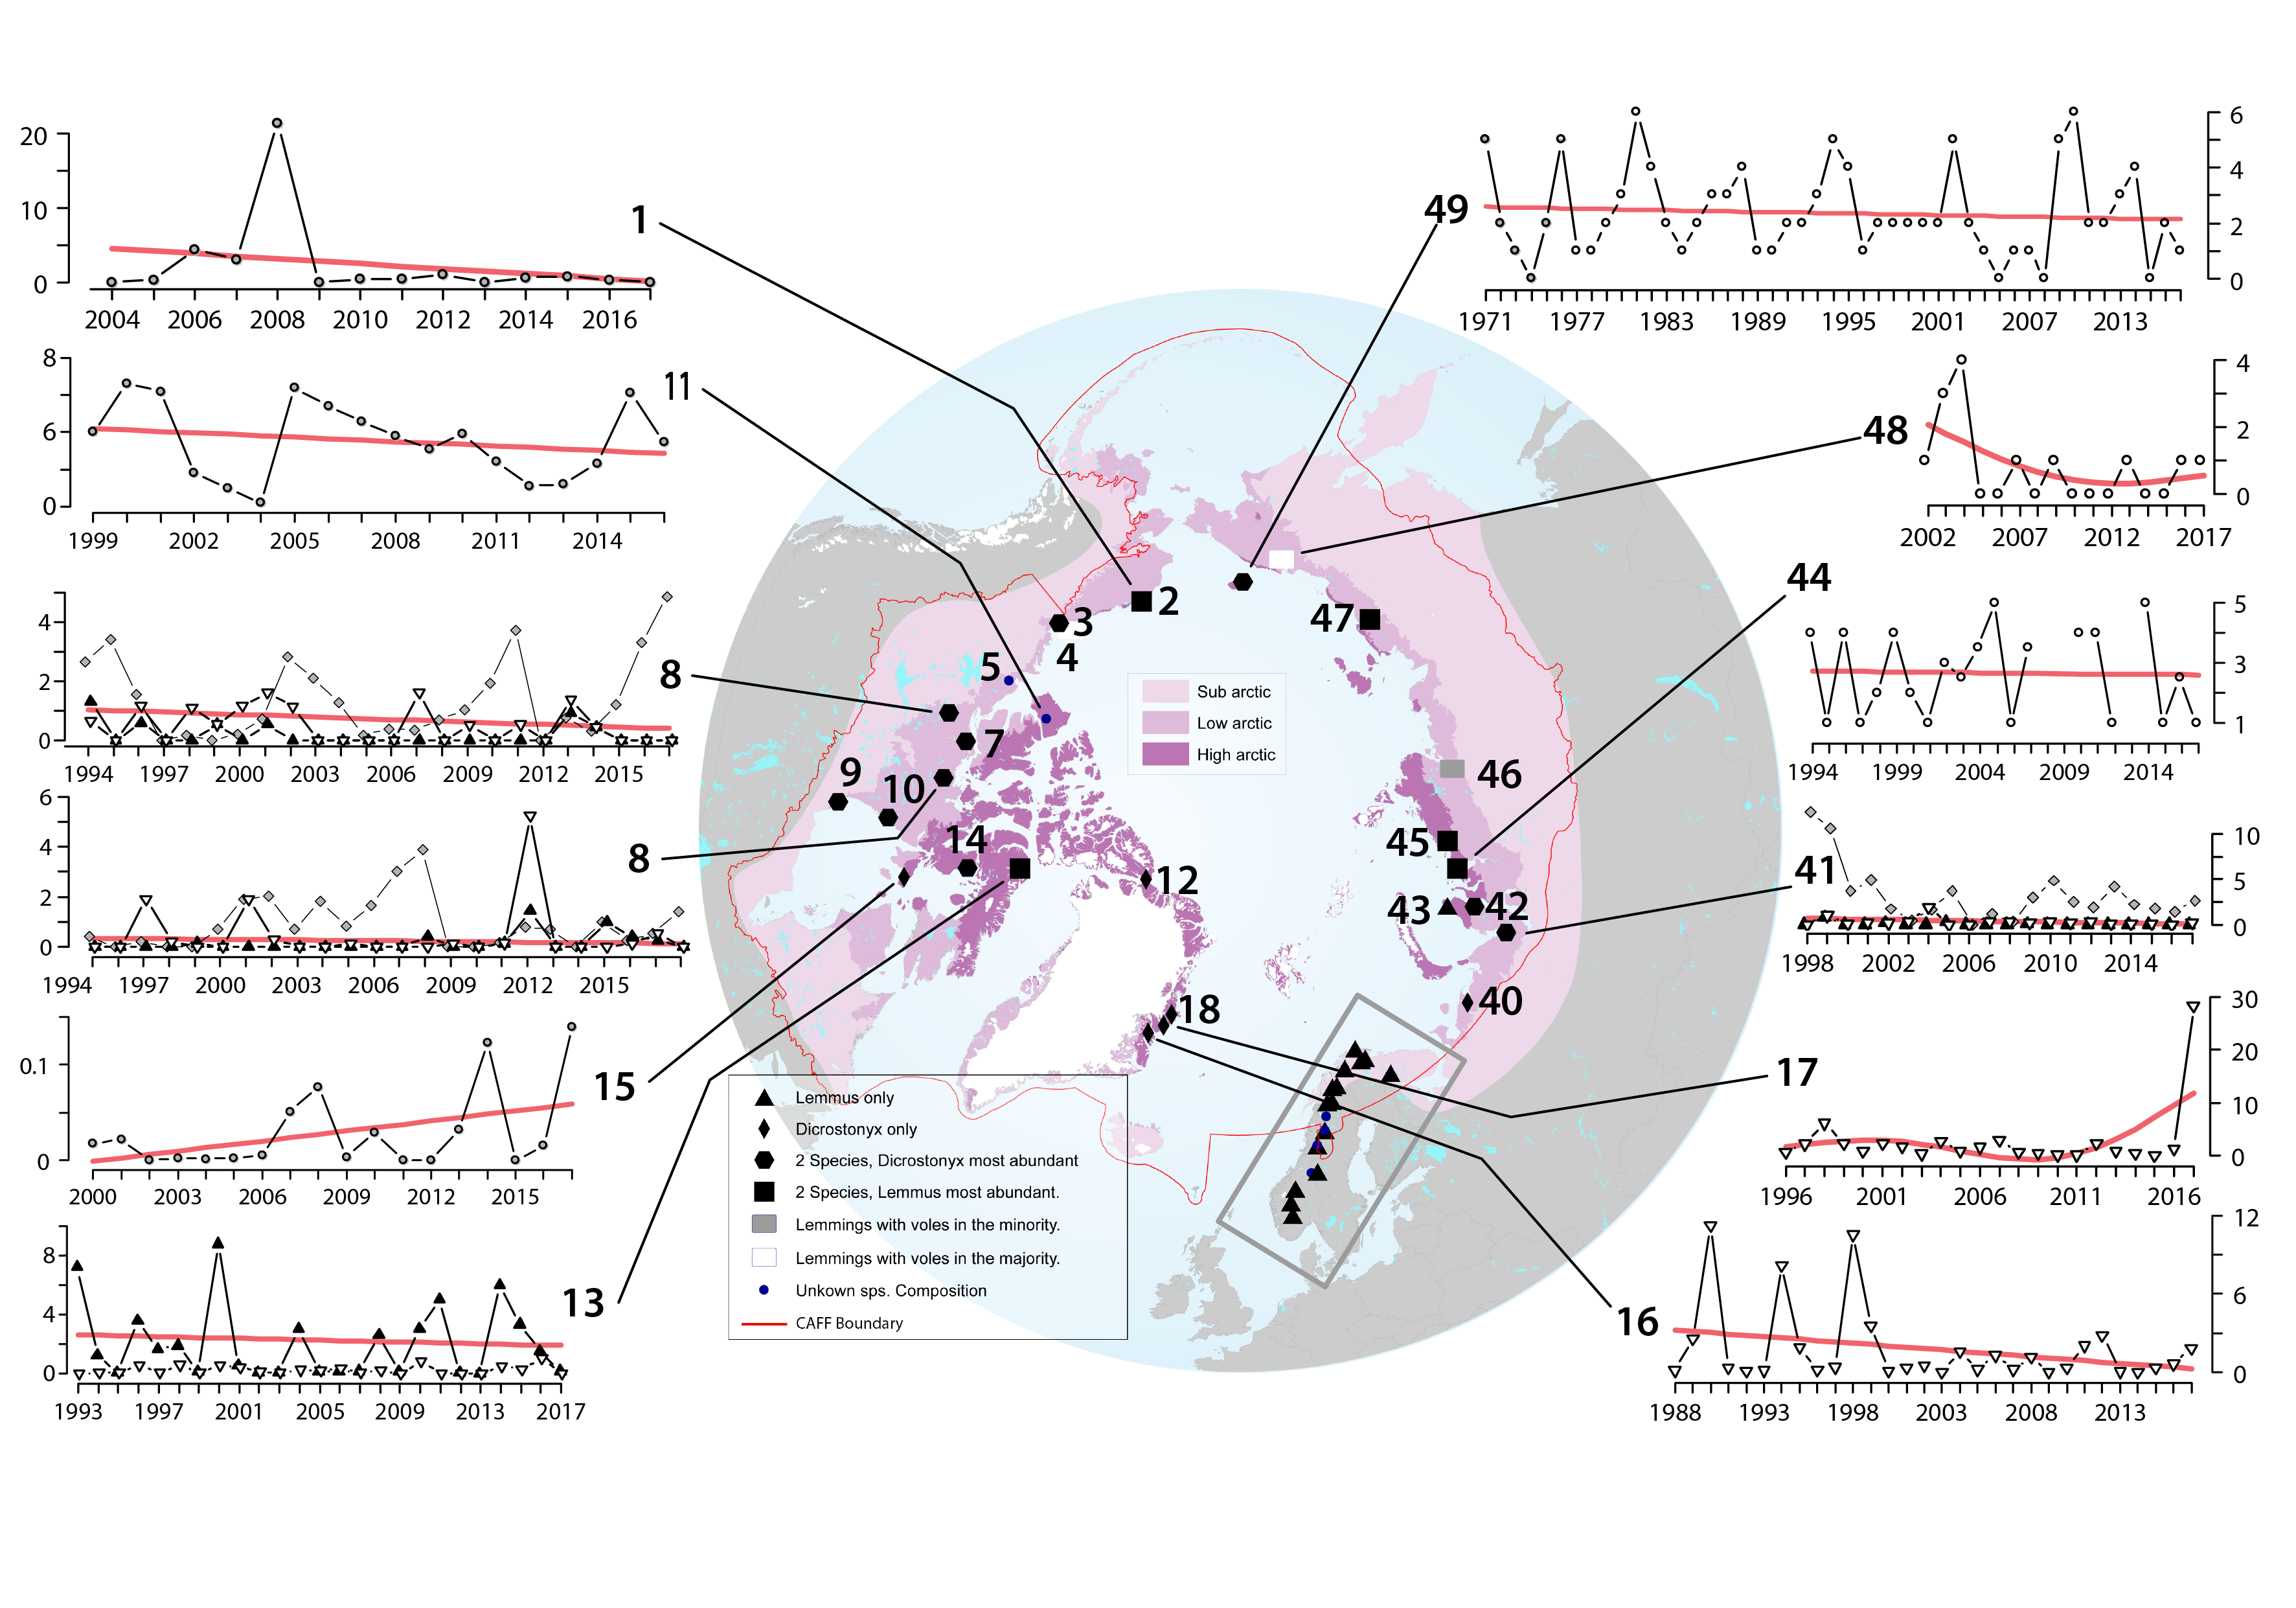
Lemmings are currently being monitored at 38 sites. Their status and trends were determined based on data from these sites as well as recent data (since 2000) from an additional 11 previous monitoring sites (Figure 3-31). Of those sites monitored, Fennoscandia is overrepresented relative to the geographical area it covers, whereas Russia is underrepresented. Based on the skewed geographical coverage, more information is available for some species of lemmings than others, particularly the Norwegian lemming. STATE OF THE ARCTIC TERRESTRIAL BIODIVERSITY REPORT - Chapter 3 - Page 80 - Figure 3.31
-
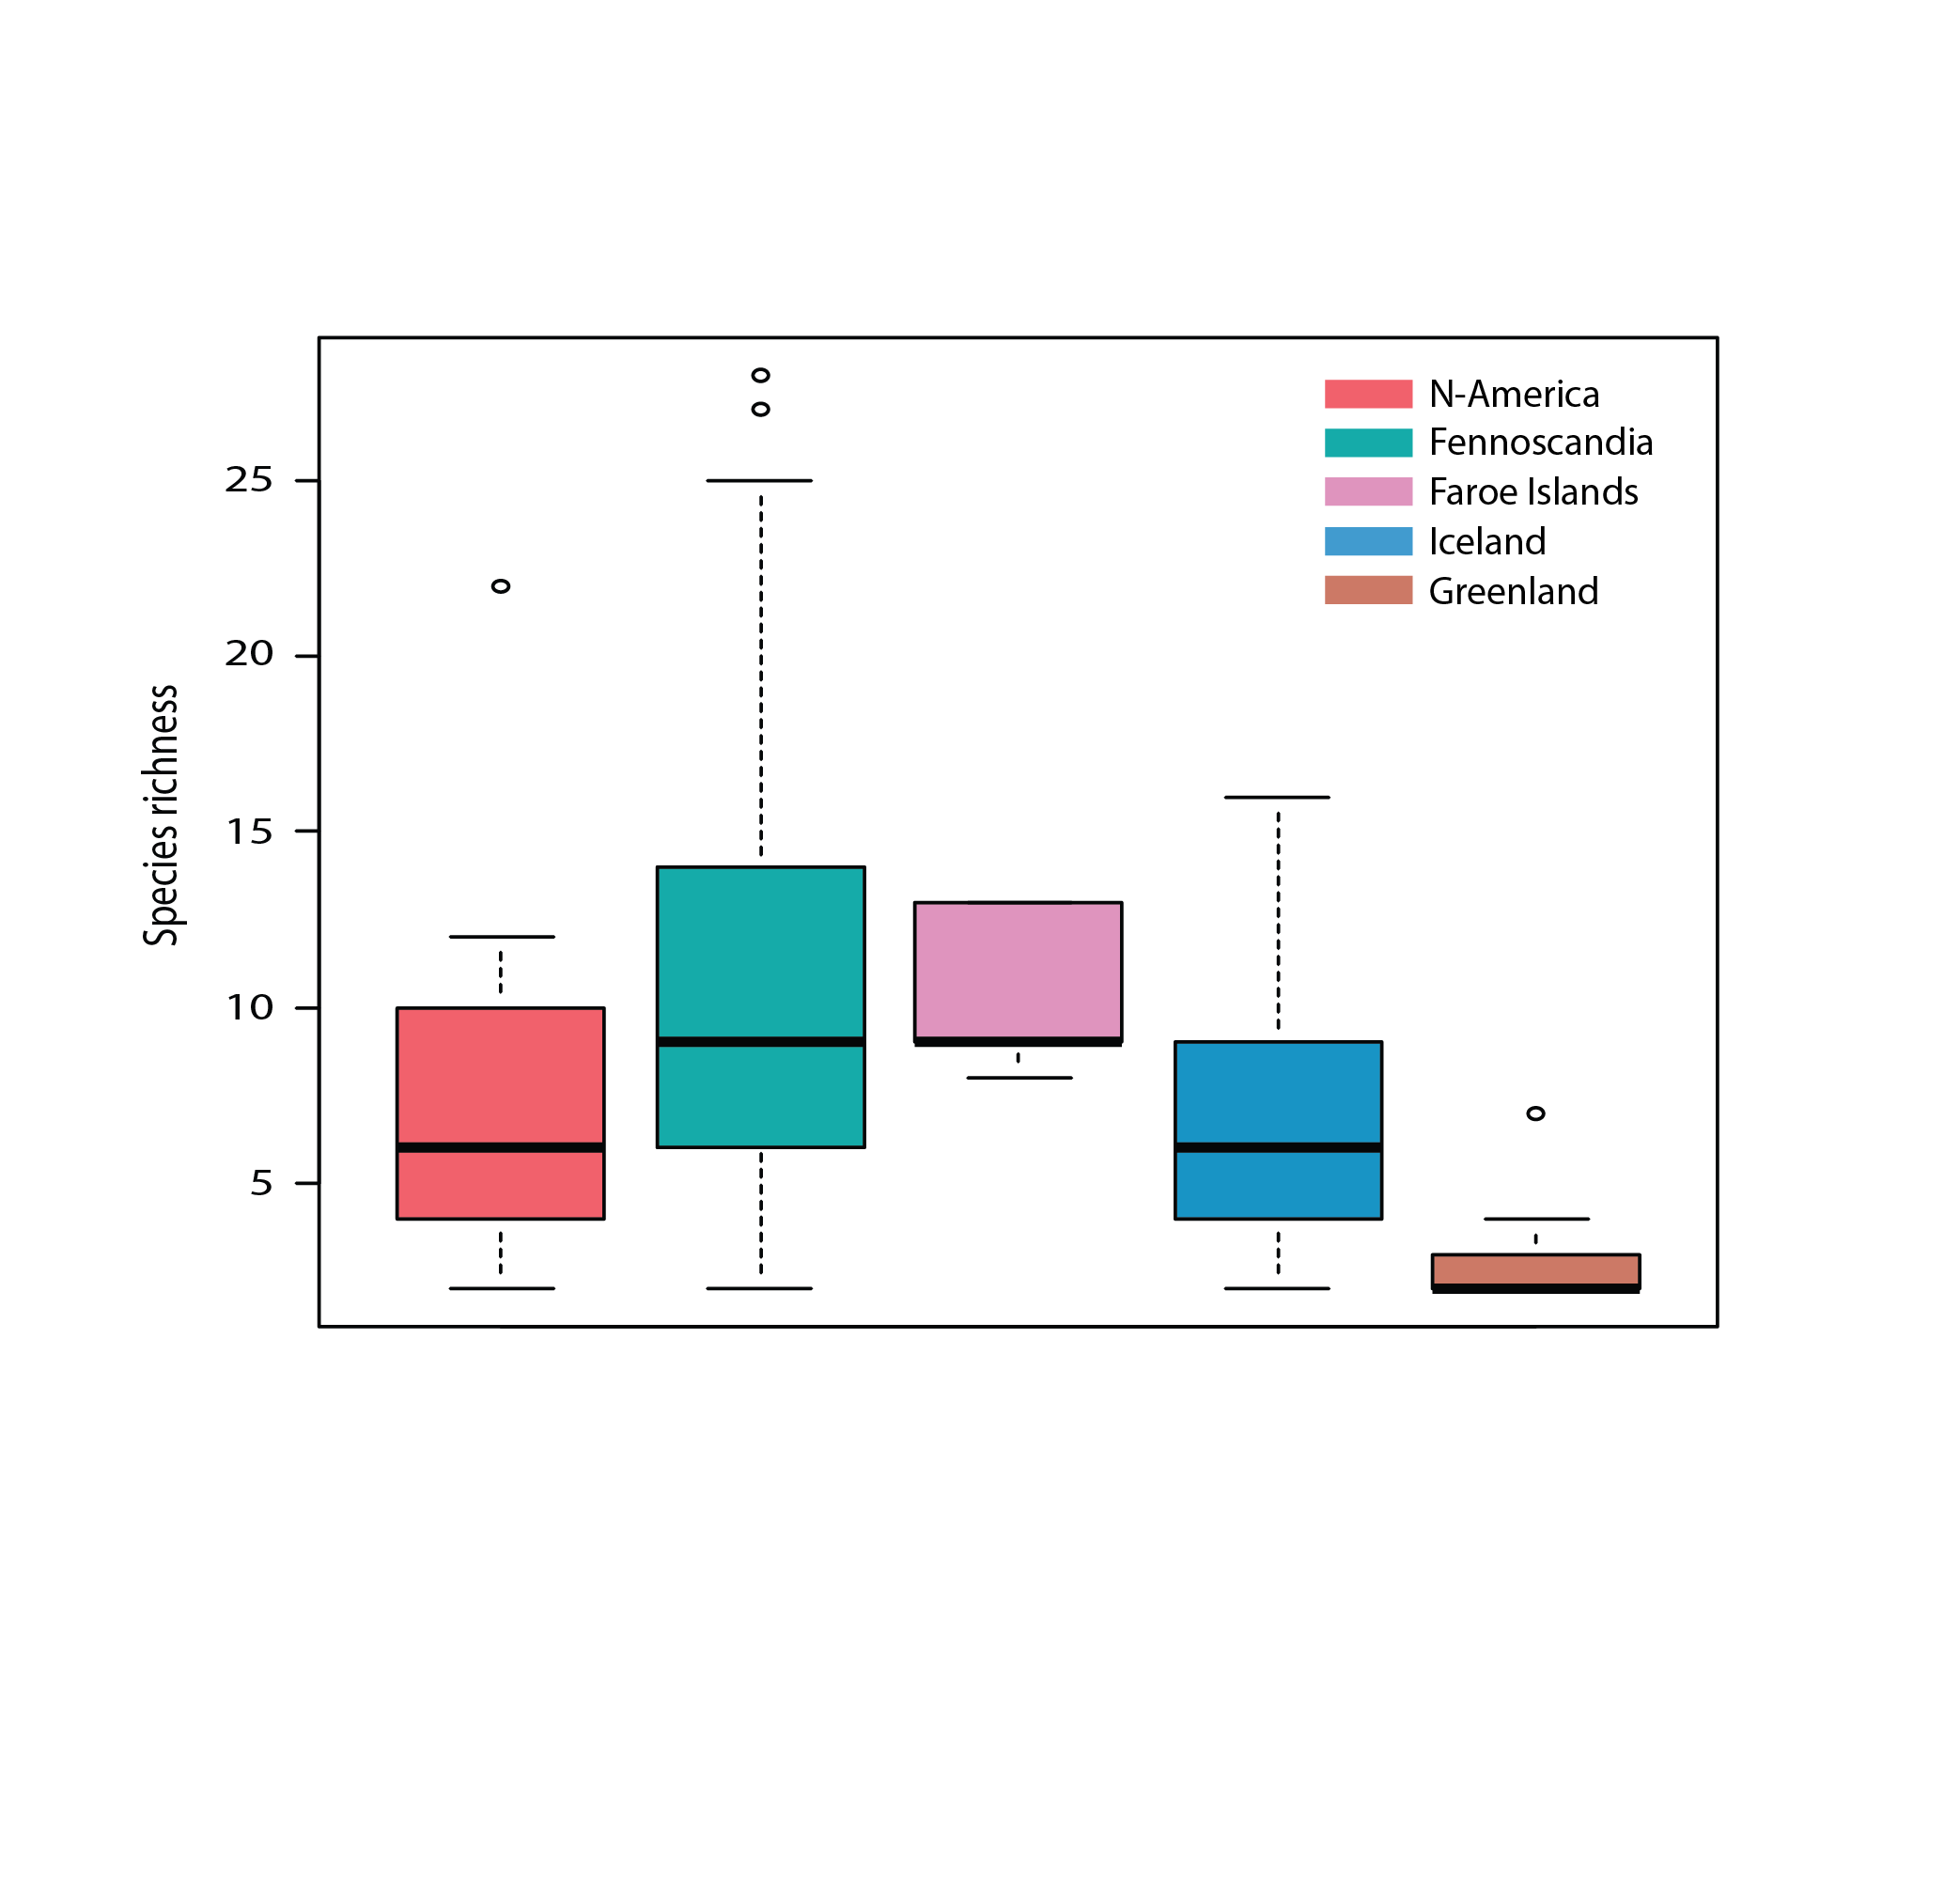
Figure 4 23 Species richness of aquatic macrophytes excluding mosses and algae in five geographic regions of the Arctic. Ame = North America, Fen = Fennoscandia, Far = Faroes, Ice = Iceland, Gre = Greenland. State of the Arctic Freshwater Biodiversity Report - Chapter 4 - Page 55 - Figure 4-22