 Arctic Biodiversity Data Service - ABDS Catalog
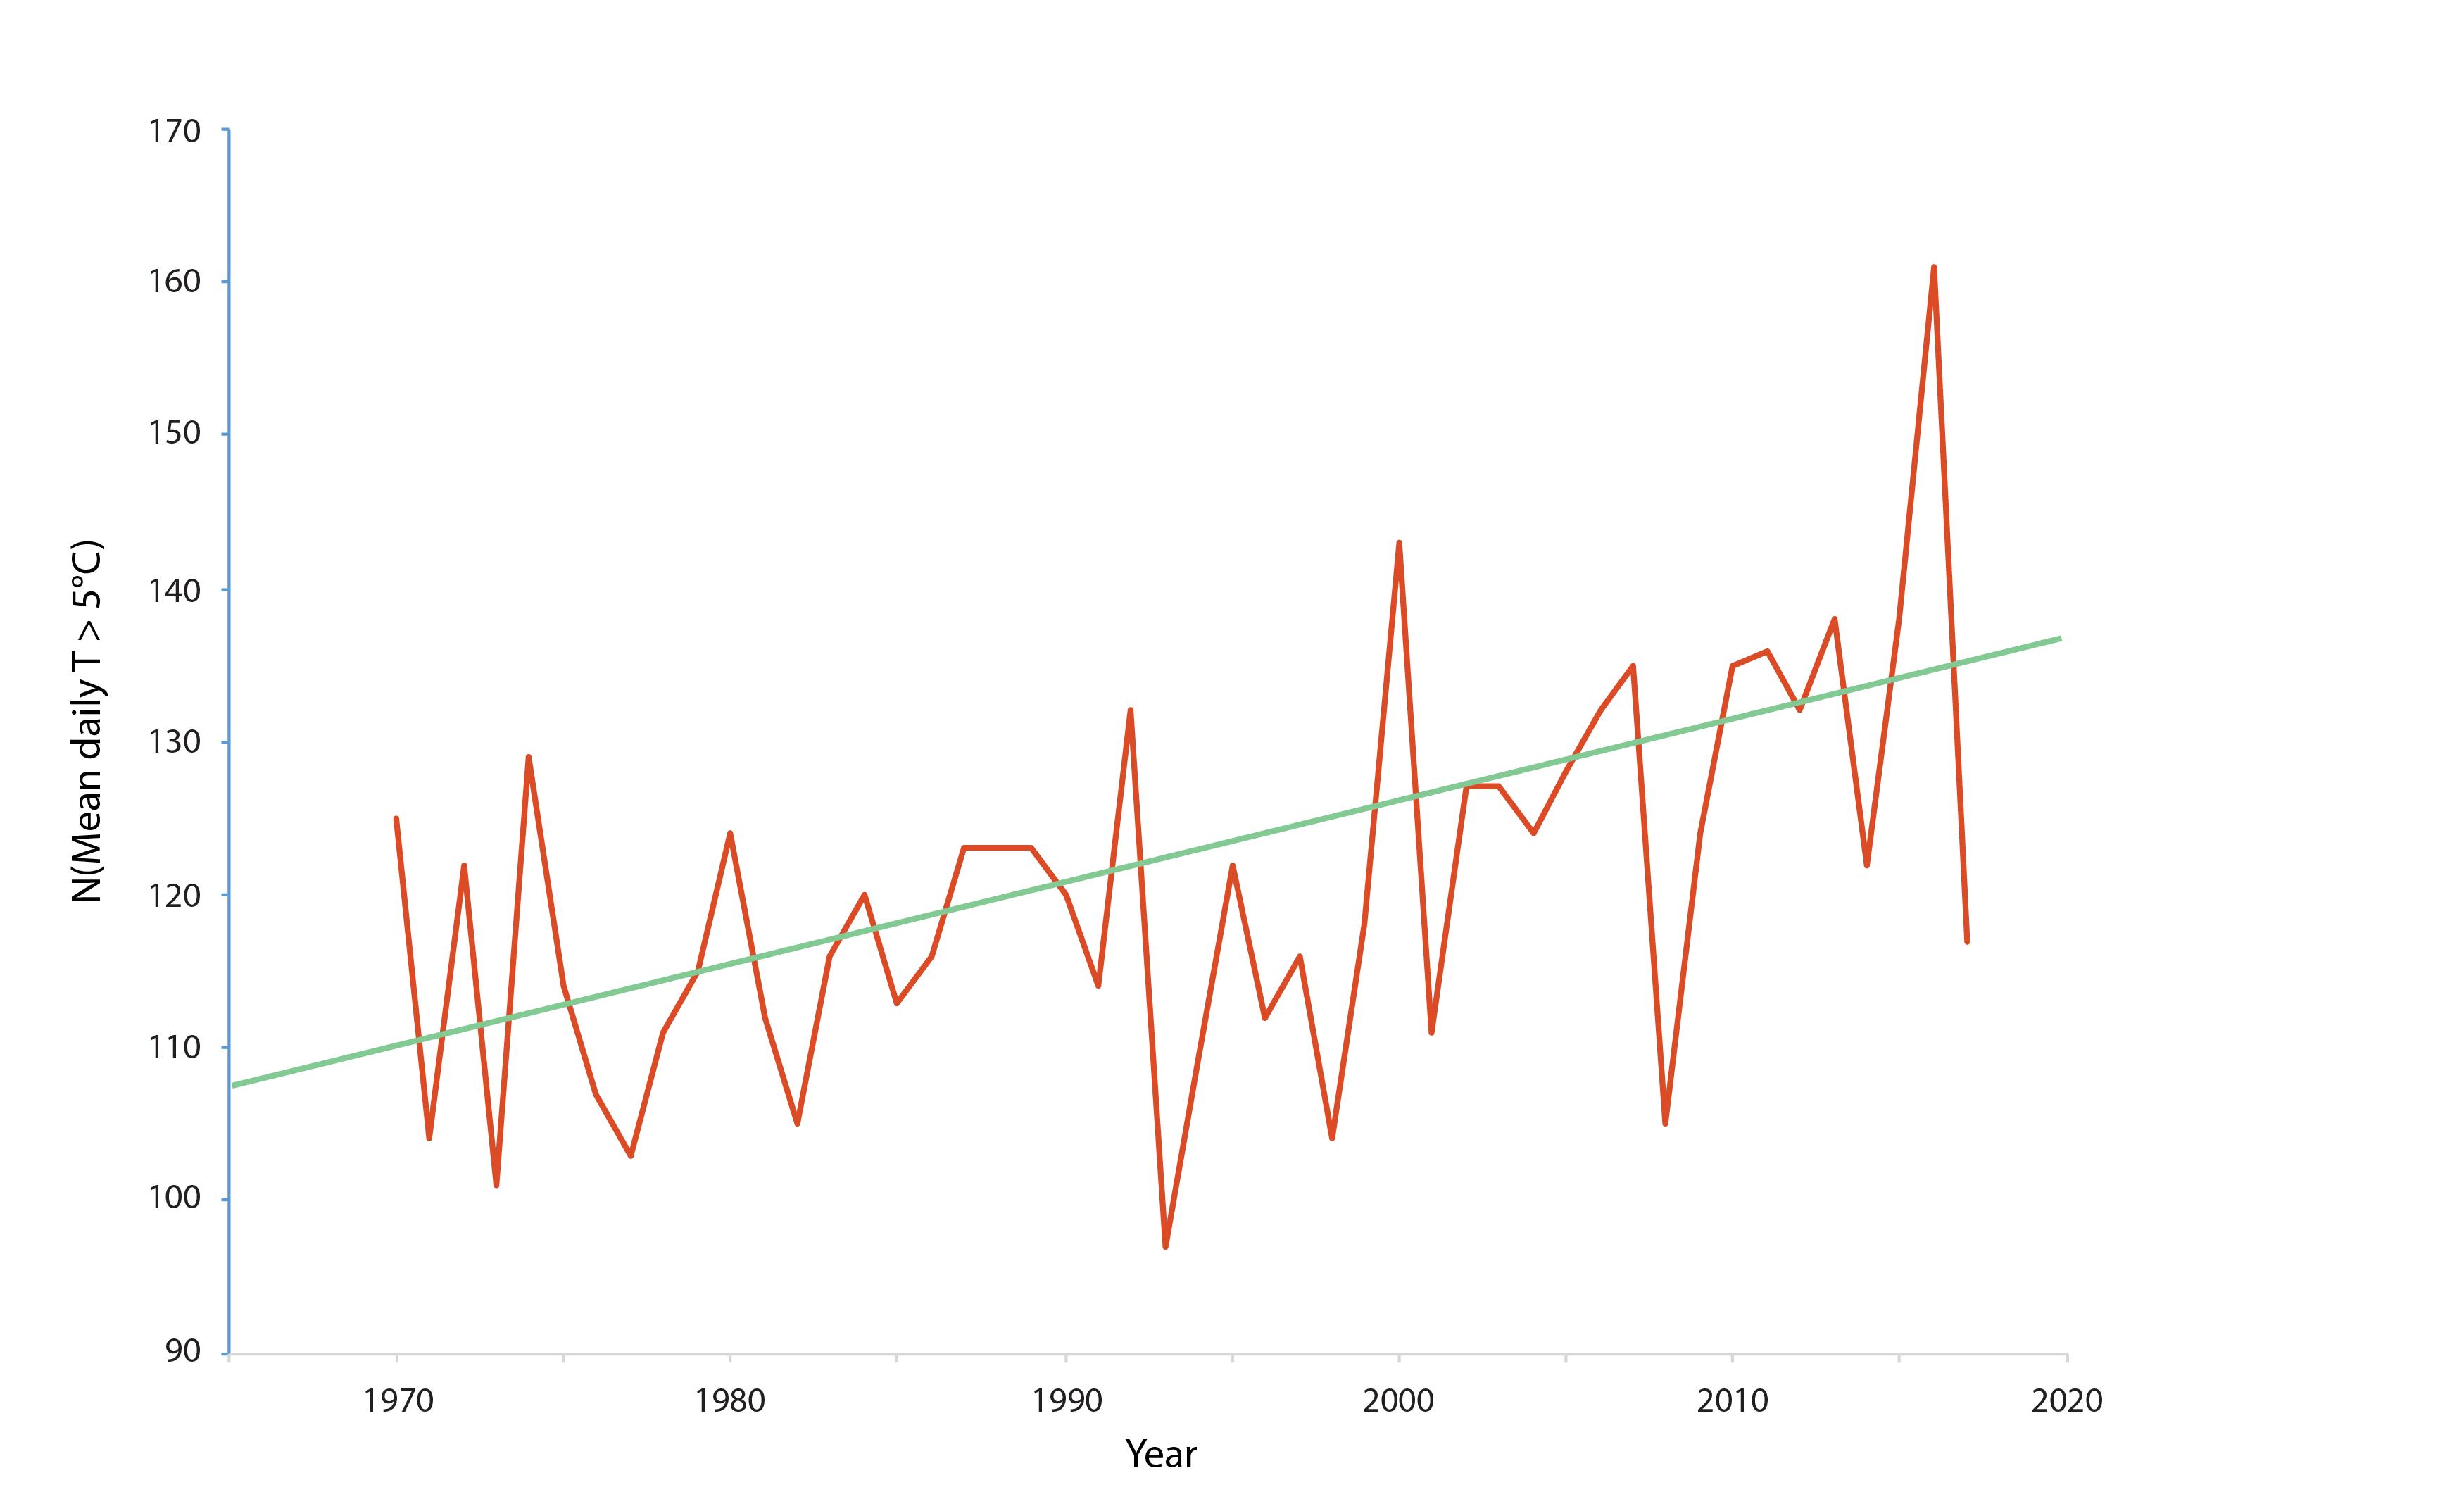
SAFBR - Figure 3.2 - Long-term water temperature trends (1970–2017)
Figure 3-2 Long-term water temperature trends (1970–2017) for the Utsjoki Nuorgam station in the River Tana (69°N in Finland). The diagram shows the number of days per year with a mean temperature exceeding 5°C. The data show that from 1995 to 2017, this indicator increased by over 0.5 days per year. Data source: Finnish Meteorological Institute.
State of the Arctic Freshwater Biodiversity Report - Chapter 3 - Page 15 - Figure 2-1
Simple
- Date (Publication)
- 2019-05
- Status
- Completed
http://caff.is
- Hours of service
-
08:00 - 16:00 GMT
- Maintenance and update frequency
- Unknown
- Theme
-
-
SAFBR
-
CAFF
-
Freshwater
-
River
-
- Place
-
-
temperature
-
- Access constraints
- Copyright
- Use constraints
- otherRestictions
- Spatial representation type
- Vector
- Language
- English
- Character set
- UTF8
- Topic category
-
- Inland waters
))
- Supplemental Information
-
You can customize the template to suit your needs. You can add
and remove fields and fill out default information (e.g. contact details).
Fields you can not change in the default view may be accessible in the more
comprehensive (and more complex) advanced view. You can even use the XML editor
to create custom structures, but they have to be validated by the system, so
know what you do :-)
- Reference system identifier
- WGS 1984
- Protocol
-
WWW:LINK-1.0-http--link
- Protocol
-
OGC:WMS-1.1.1-http-get-map
- OnLine resource
-
Figure 3-2 Scatterplot with trend line.xlsx
(
WWW:DOWNLOAD-1.0-http--download
)
Excel file
- Hierarchy level
- Dataset
Conformance result
- Date (Publication)
- File identifier
- aa7e20d4-9bdc-46ce-b2fe-5993322ac8ef XML
- Metadata language
- English
- Character set
- UTF8
- Date stamp
- 2023-02-13T13:59:37
- Metadata standard name
-
ISO 19115:2003/19139
- Metadata standard version
-
1.0
Overviews
Spatial extent
Provided by
