 Arctic Biodiversity Data Service - ABDS Catalog
Arthropods
Type of resources
Available actions
Topics
Keywords
Contact for the resource
Provided by
Representation types
Update frequencies
status
-
Known species from the High Arctic, Low Arctic, and Sub-Arctic, based on records from 1990 to 2022. Additional unknown species are likely present. Geographical Distribution Includes Arctic regions of eight political jurisdictions. Associated article is published in the 2022 Arctic Report Card essay entitled Arctic Pollinators by Burns et al.
-

Temporal trends of arthropod abundance, 1996–2009. Estimated by the number of individuals caught per trap per day during the season from four different pitfall trap plots, each consisting of eight (1996–2006) or four (2007–2009) traps. Modified from Høye et al. 2013. STATE OF THE ARCTIC TERRESTRIAL BIODIVERSITY REPORT - Chapter 3 - Page 41 - Figure 3.16
-

Trends in total abundance of moths and species richness, from two locations in Iceland, 1995–2016. Trends differ between locations. The solid and dashed straight lines represent linear regression lines which are significant or non-significant, respectively. Modified from Gillespie et al. 2020a. STATE OF THE ARCTIC TERRESTRIAL BIODIVERSITY REPORT - Chapter 3 - Page 41 - Figure 3.14
-
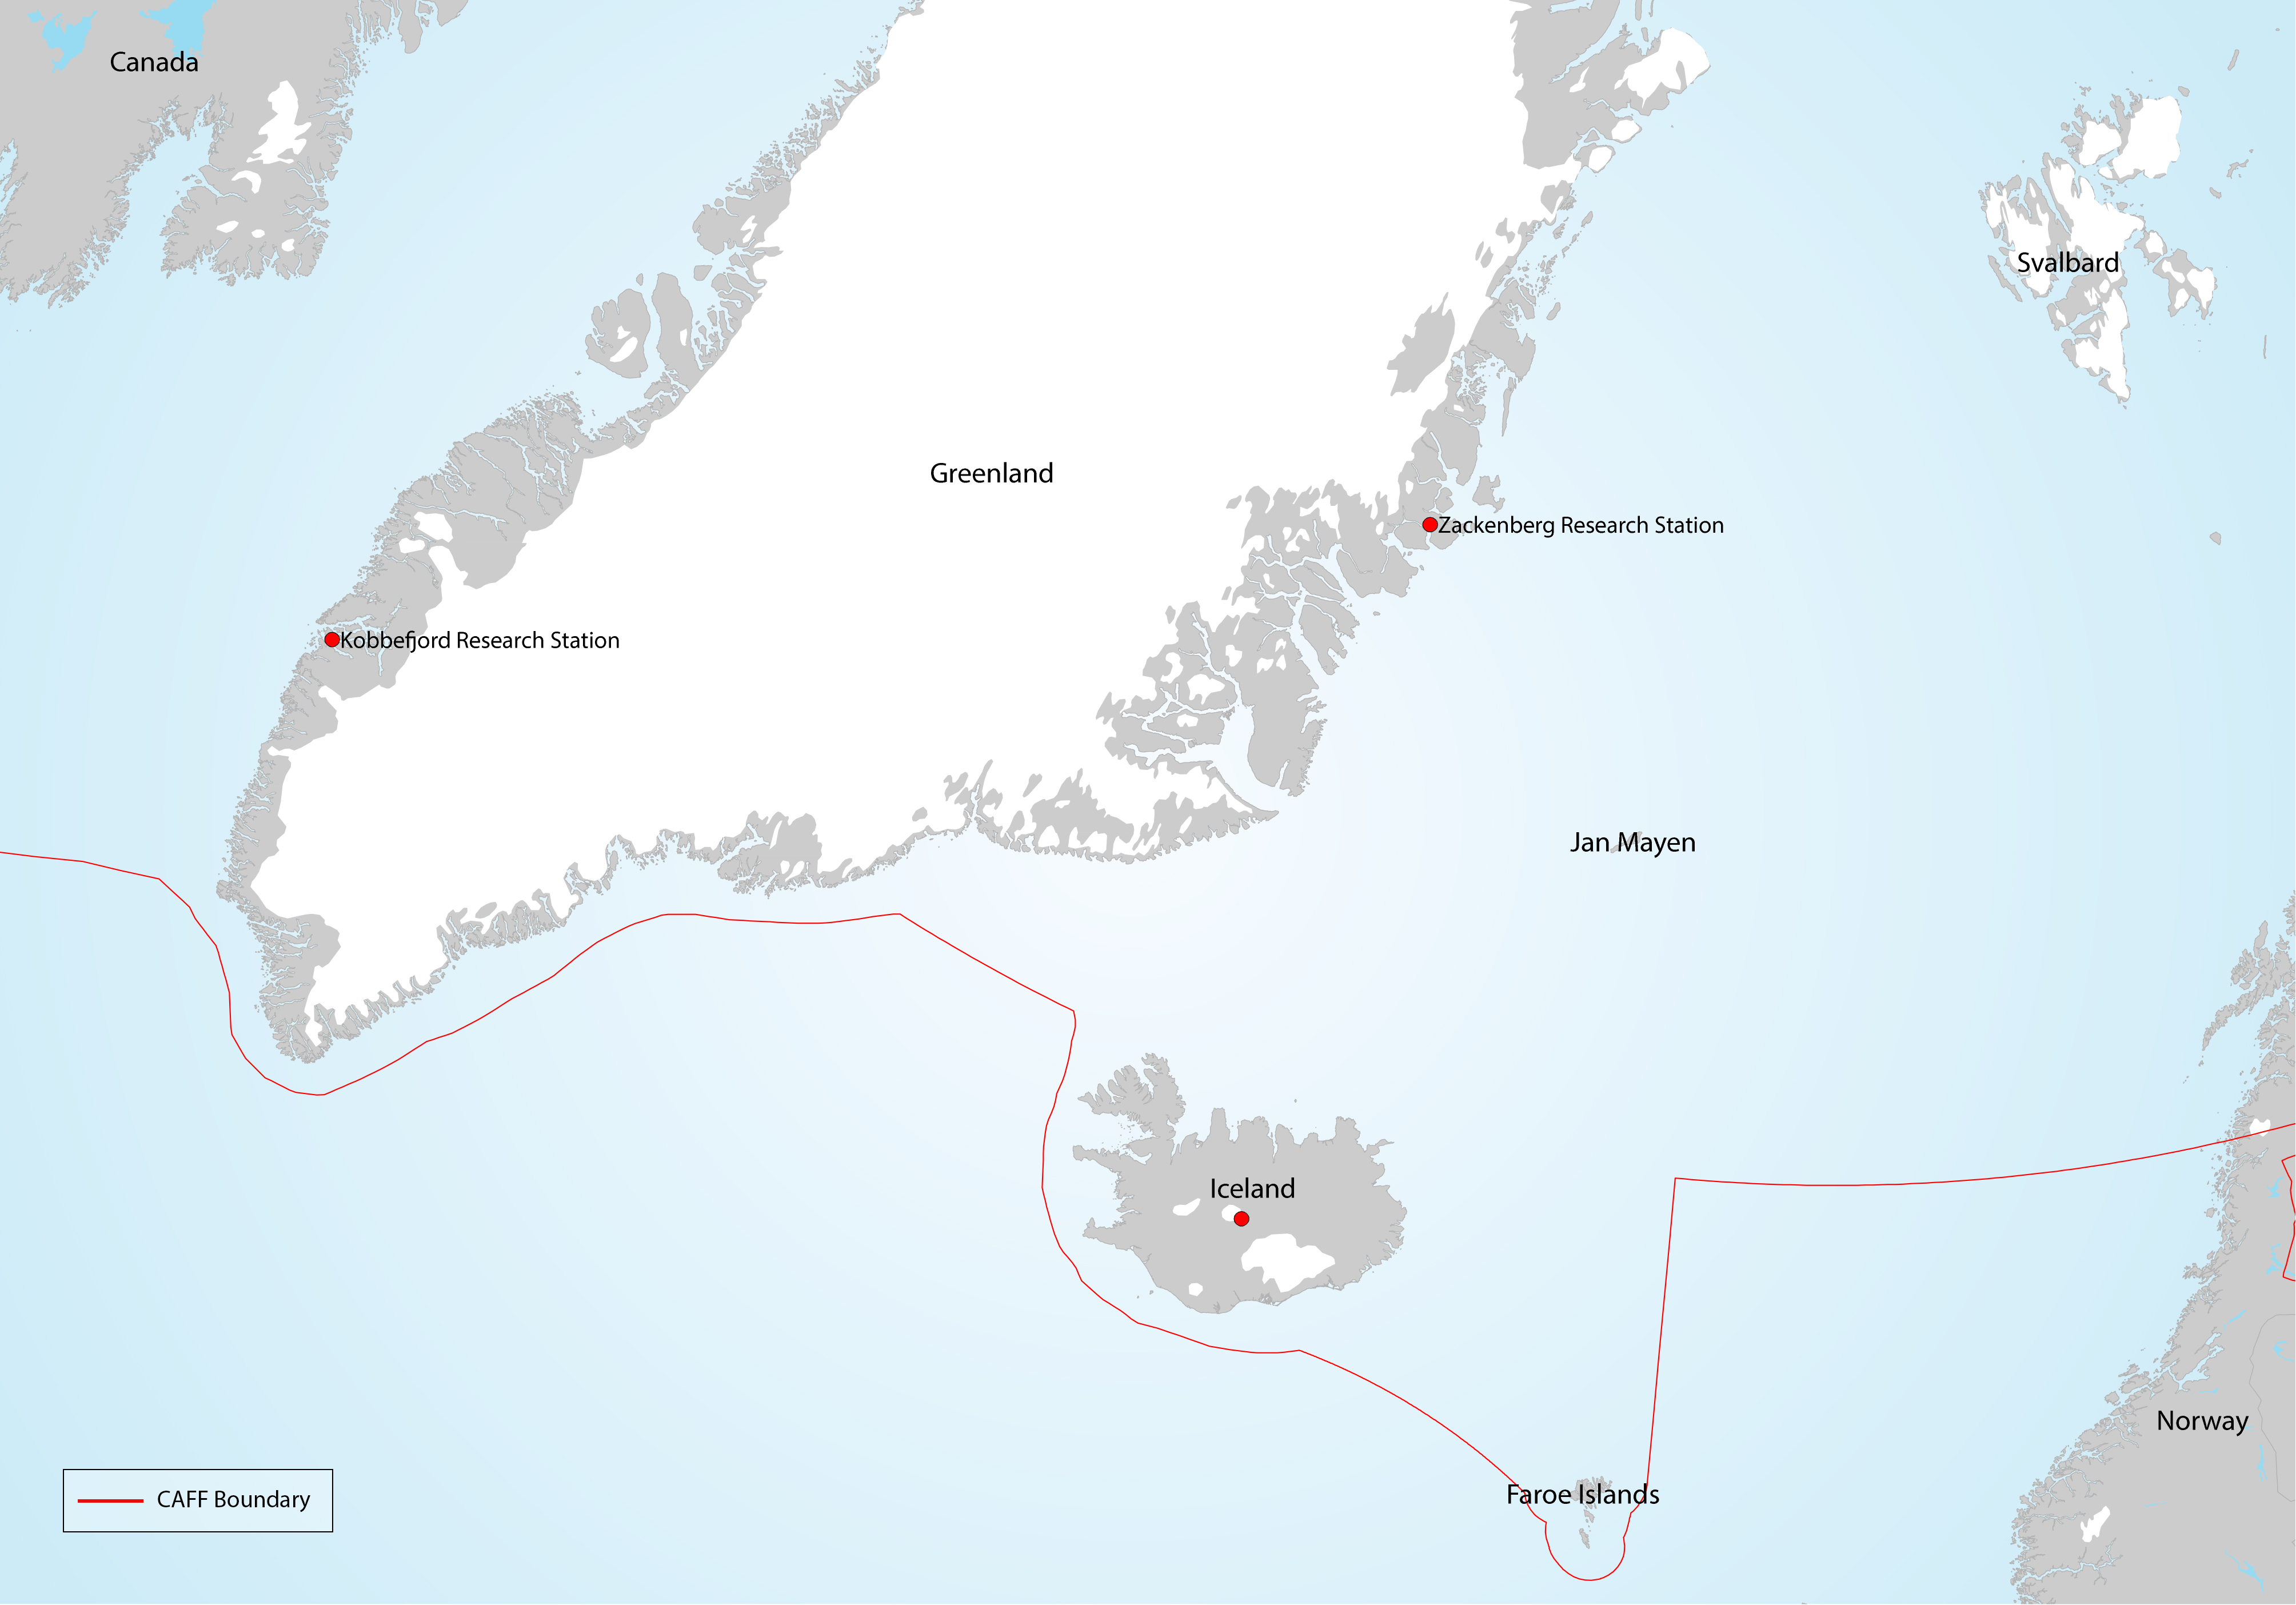
Temporal trends of arthropod abundance for three habitat types at Zackenberg Research Station, Greenland, 1996–2016. Data are grouped as the FEC ‘arthropod prey for vertebrates’ and separated by habitat type. Solid lines indicate significant regression lines at the p<0.05. Modified from Gillespie et al. 2020a. STATE OF THE ARCTIC TERRESTRIAL BIODIVERSITY REPORT - Chapter 3 - Page 39 - Figure 3.9
-
Population trends for springtails in Empetrum nigrum plant community in Kobbefjord, Greenland, 2007–2017. (a) mean population abundance of total Collembola in individuals per square metre, (b) mean number of species per sample, and (c) Shannon-Wiener diversity index per sample. Vertical error bars are standard errors of the mean. Solid lines indicate significant regression lines. Modified from Gillespie et al. 2020a. STATE OF THE ARCTIC TERRESTRIAL BIODIVERSITY REPORT - Chapter 3 - Page 40 - Figure 3.13
-
Trends in four muscid species occurring at Zackenberg Research Station, east Greenland, 1996–2014. Declines were detected in several species over five or more years. Significant regression lines drawn as solid. Non-significant as dotted lines. Modified from Gillespie et al. 2020a. (in the original figure six species showed a statistically significant decline, seven a non-significant decline and one species a non-significant rise) STATE OF THE ARCTIC TERRESTRIAL BIODIVERSITY REPORT - Chapter 3 - Page 39 - Figure 3.11
-
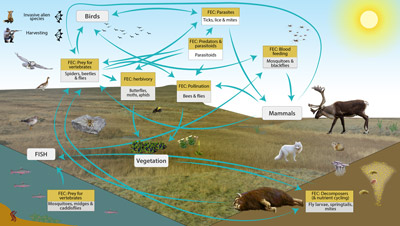
Conceptual model of the FECs and processes mediated by more than 2,500 species of Arctic arthropods known from Greenland, Iceland, Svalbard, and Jan Mayen. STATE OF THE ARCTIC TERRESTRIAL BIODIVERSITY REPORT - Chapter 3 - Page 37- Figure 3.7
-
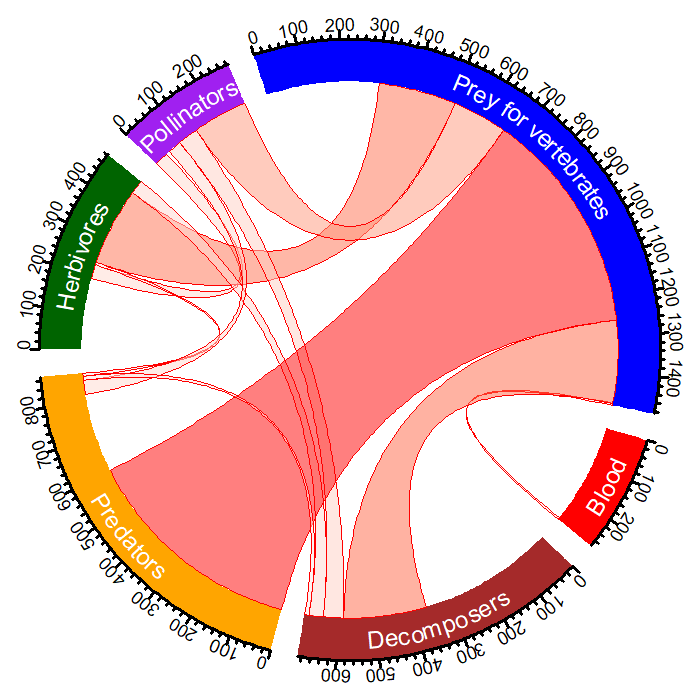
The diagram indicates the number of species in each FEC for the North Atlantic region of the Arctic (circular outline) and the overlap between the five CBMP–Terrestrial Plan FECs and the additional ‘predators’ FEC. The link width indicates the number of species linking two FECs. The larger the link the more species that are found in linking FECs. Modified from Gillespie et al. 2020a. STATE OF THE ARCTIC TERRESTRIAL BIODIVERSITY REPORT - Chapter 3 - Page 38 - Figure 3.8
-
The baseline survey and ongoing monitoring required to adequately describe Arctic arthropod biodiversity and to identify trends is largely lacking. Although some existing publications reporting long-term and extensive sampling exist, they are limited in species level information, taxonomic coverage and/or geographic location/extent (Figure 3-19) STATE OF THE ARCTIC TERRESTRIAL BIODIVERSITY REPORT - Chapter 3 - Page 44 - Figure 3.19