 Arctic Biodiversity Data Service - ABDS Catalog
Meiofauna
Type of resources
Available actions
Topics
Keywords
Contact for the resource
Provided by
Representation types
Update frequencies
status
-
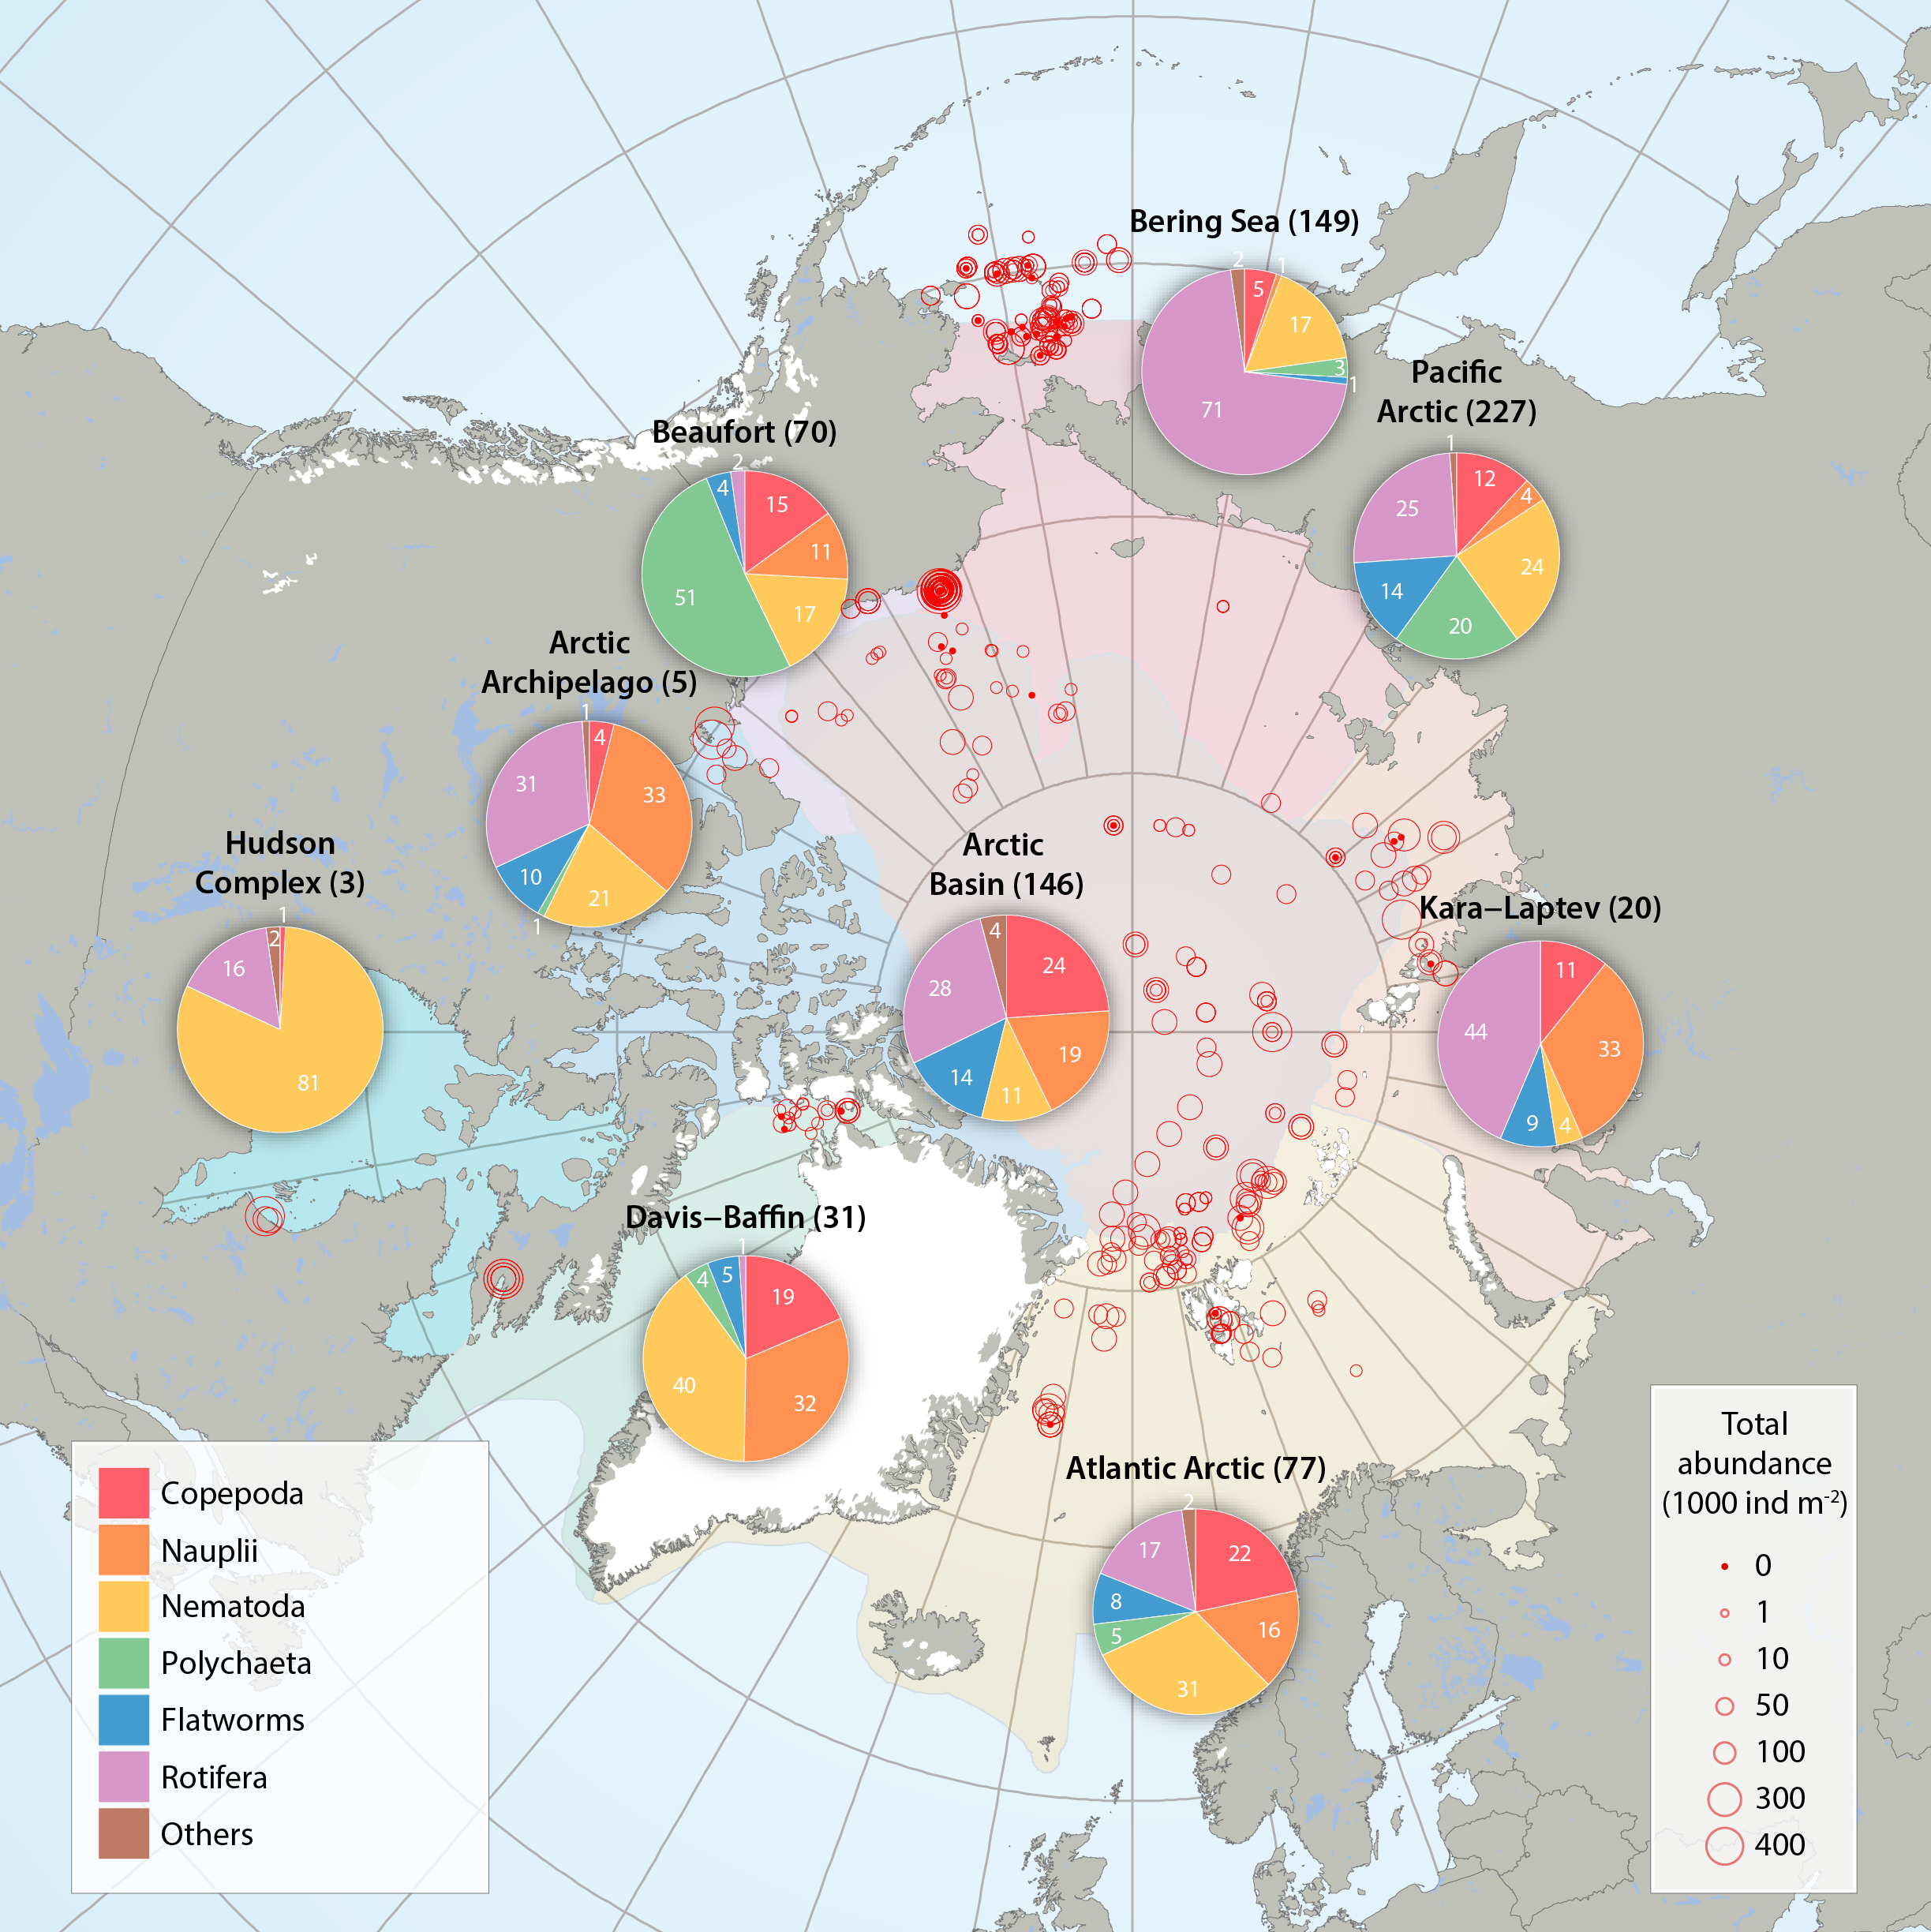
Sea ice meiofauna composition (pie charts) and total abundance (red circles) across the Arctic, compiled by the CBMP Sea Ice Biota Expert Network from 27 studies between 1979 and 2015. Scaled circles show total abundance per individual ice core while pie charts show average relative contribution by taxon per Arctic Marine Area (AMA). Number of ice cores for each AMA is given in parenthesis after region name. Note that studies were conducted at different times of the year, with the majority between March and August (see 3.1 Appendix). The category ‘other’ includes young stages of bristle worms (Polychaeta), mussel shrimps (Ostracoda), forams (Foraminifera), hydroid polyps (Cnidaria), comb jellies (Ctenophora), sea butterflies (Pteropoda), marine mites (Acari) and unidentified organisms. STATE OF THE ARCTIC MARINE BIODIVERSITY REPORT - <a href="https://arcticbiodiversity.is/findings/sea-ice-biota" target="_blank">Chapter 3</a> - Page 40 - Figure 3.1.4 From the report draft: "Here, we synthesized 19 studies across the Arctic conducted between 1979 and 2015, including unpublished sources (B. Bluhm, R. Gradinger, UiT – The Arctic University of Norway; H. Hop, Norwegian Polar Institute; K. Iken, University of Alaska Fairbanks). These studies sampled landfast sea ice and offshore pack ice, both first- and multiyear ice (Appendix 3.1). Meiofauna abundances reported in individual data sources were converted to individuals m-2 of sea ice assuming that ice density was 95% of that in melted ice. Due to the low taxonomic resolution in the reviewed studies, ice meiofauna were grouped into: Copepoda, nauplii (for copepods as well as other taxa with naupliar stages), Nematoda, Polychaeta (mostly juveniles, but also trochophores), flatworms (Acoelomorpha and Platyhelminthes; these phyla have mostly been reported as one category), Rotifera, and others (which include meroplanktonic larvae other than Polychaeta, Ostracoda, Foraminifera, Cnidaria, Ctenophora, Pteropoda, Acari, and unidentified organisms). Percentage of total abundance for each group was calculated for each ice core, and these percentages were used for regional averages. Maximum available ice core length was used in data analysis, but 50% of these ice cores included only the bottom 10 cm of the ice, 12% the bottom 5 cm, 10% the bottom 2 cm, and 11% the entire ice-thickness. Data from 617 cores were used."
-
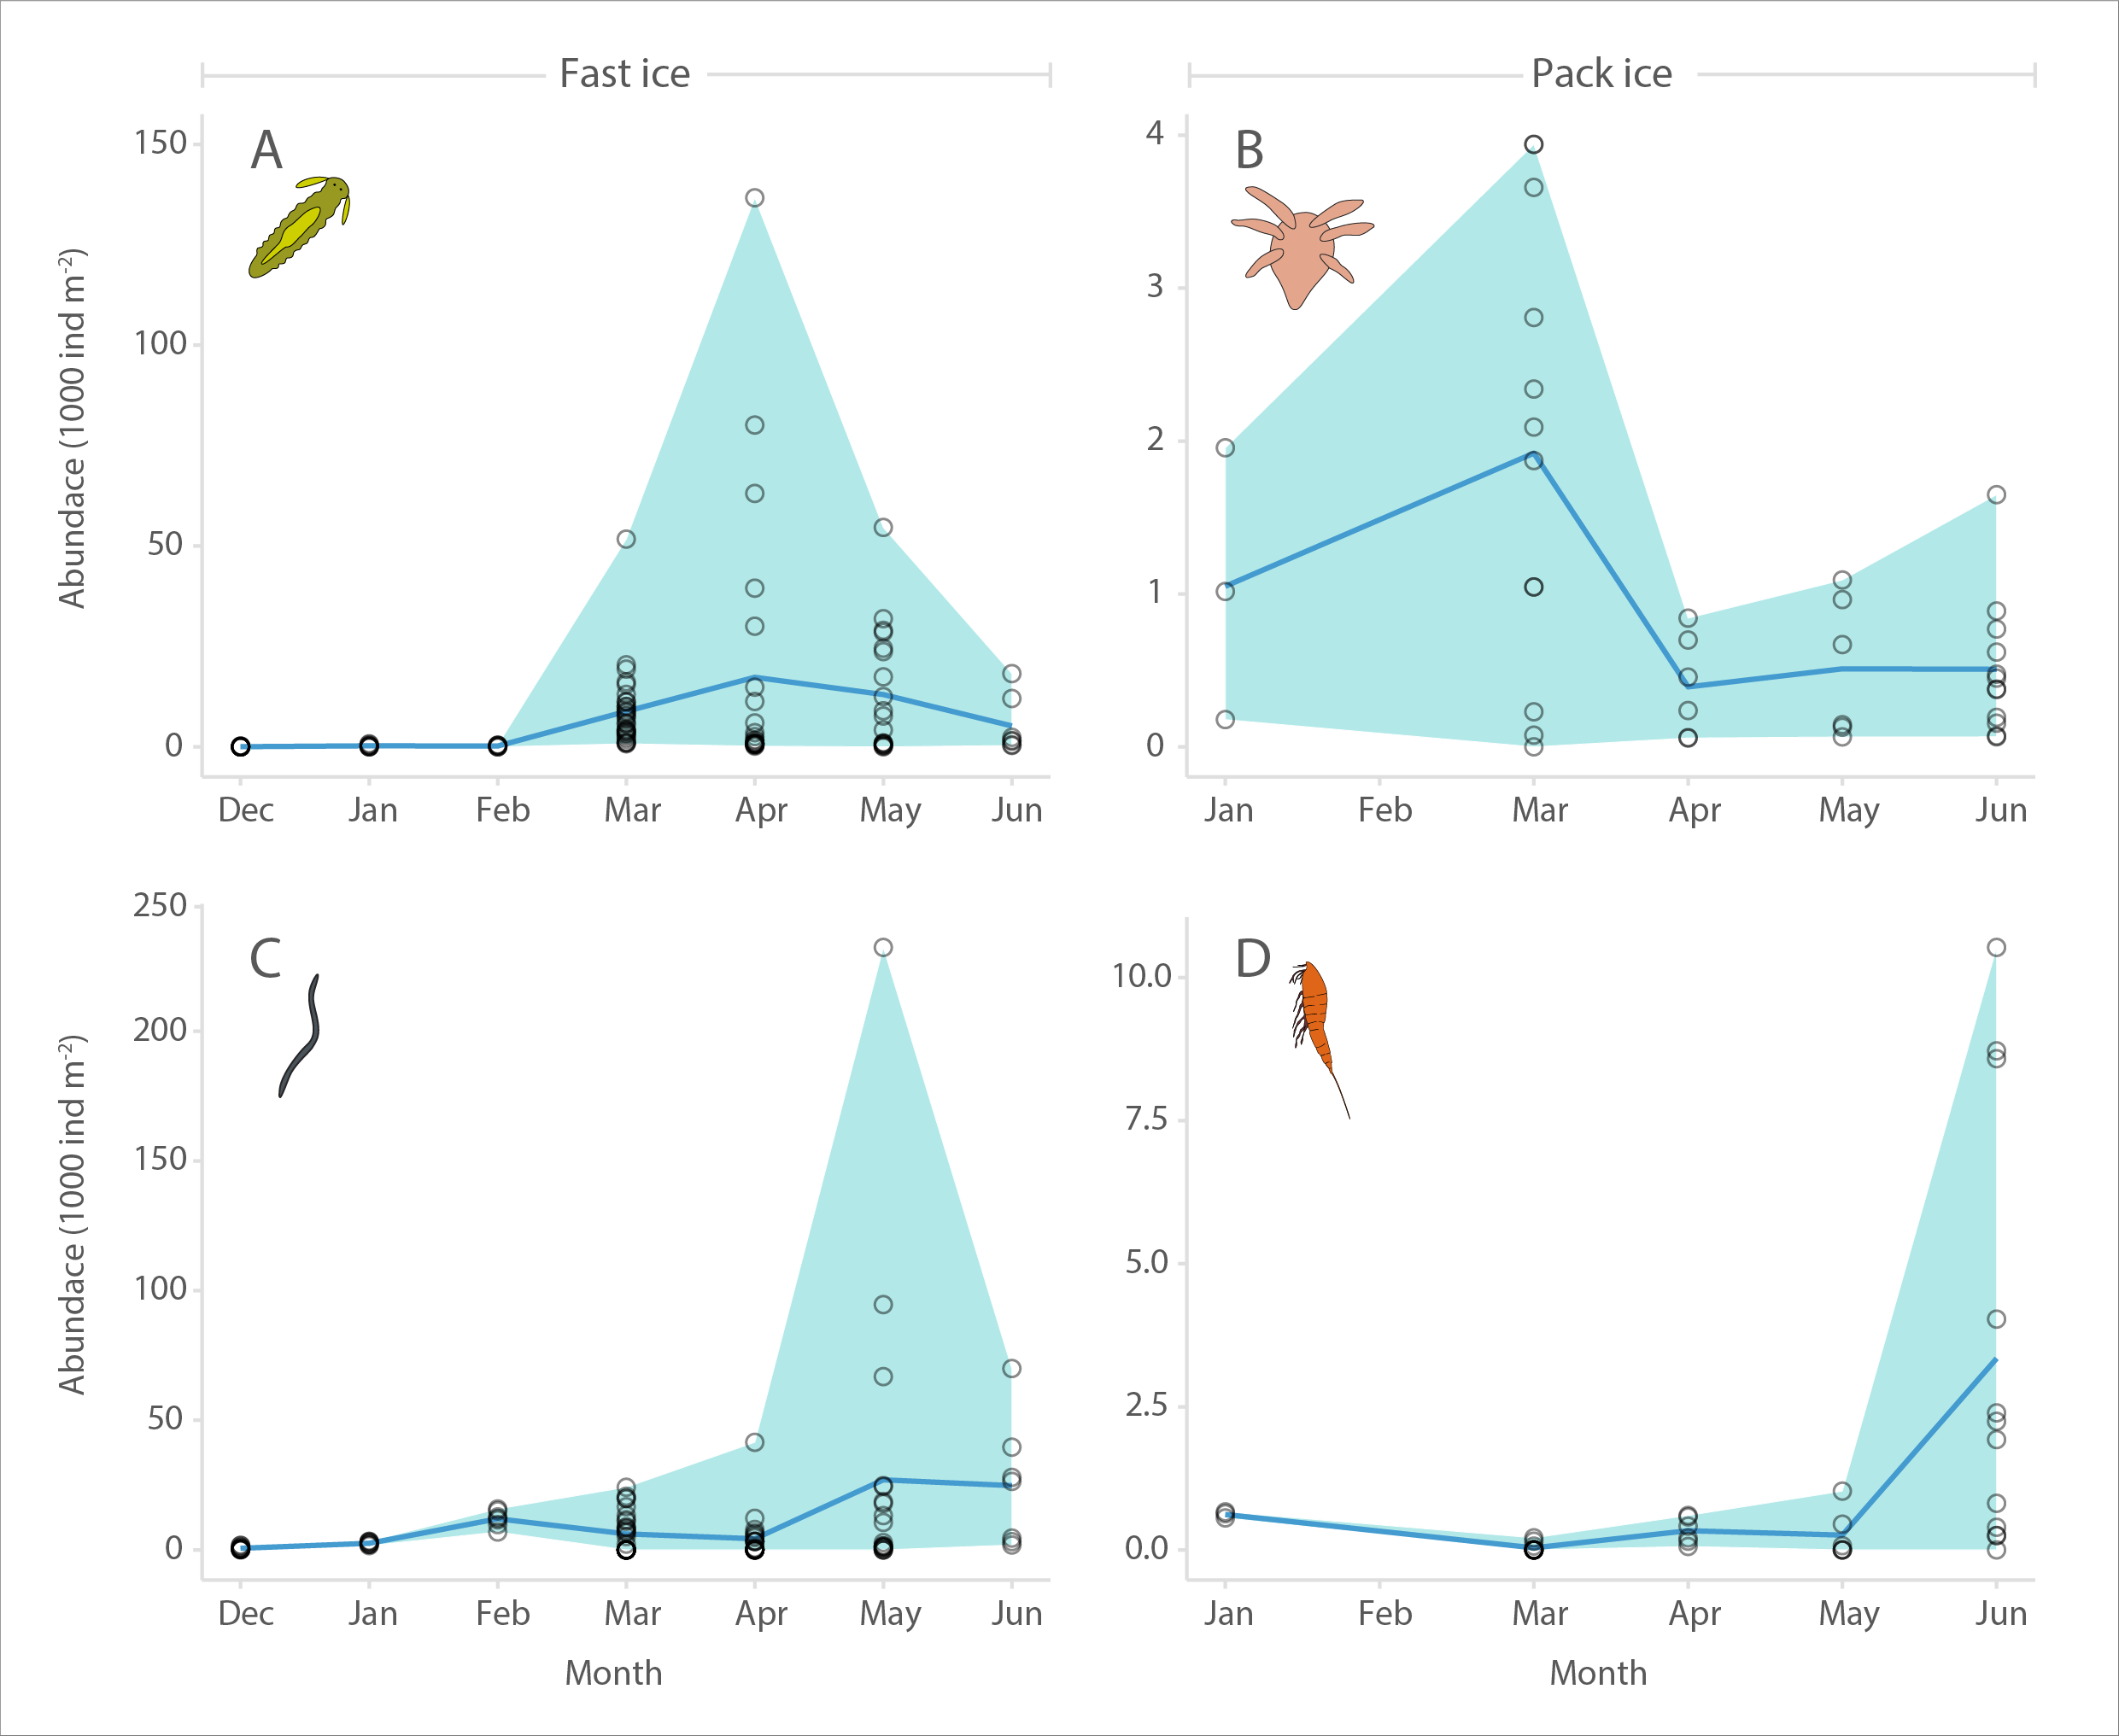
Seasonal abundance (1000 individuals m- 2) of sea ice meiofauna at landfast sea ice (Barrow, 2005-2006, A and C) and pack ice (North of Svalbard, 2015, B and D). A and B show larval stages (polychaete juveniles and nauplii, respectively), while C and D show nematodes and harpacticoid copepods, respectively. Circles represent individual cores (n = 107 for A and C, and 39 for B and D), shading the extent of minimum as well as maximum values, and blue line indicates mean values. STATE OF THE ARCTIC MARINE BIODIVERSITY REPORT - <a href="https://arcticbiodiversity.is/findings/sea-ice-biota" target="_blank">Chapter 3</a> - Page 43 - Figure 3.1.5 From the report draft: "In addition to showing composition and peak abundance ranges, we illustrate the phenology of ice meiofauna over the ice-covered season in the entire combined data set. For this purpose, the data were normalized to the daylight hours at each location during the date of sampling using R package geosphere (Hijmans 2015) and a method described in Forsythe et al. (1995). This was necessary, because ‘spring’ arrives earlier at lower latitudes than at higher latitudes, so that using month or day of year would obscure the pan-Arctic integration of the data. Other influential factors such as snow depth, ice thickness and nutrient concentrations were not accounted for in this analysis."