 Arctic Biodiversity Data Service - ABDS Catalog
Plankton
Type of resources
Available actions
Topics
Keywords
Contact for the resource
Provided by
Representation types
Update frequencies
status
-
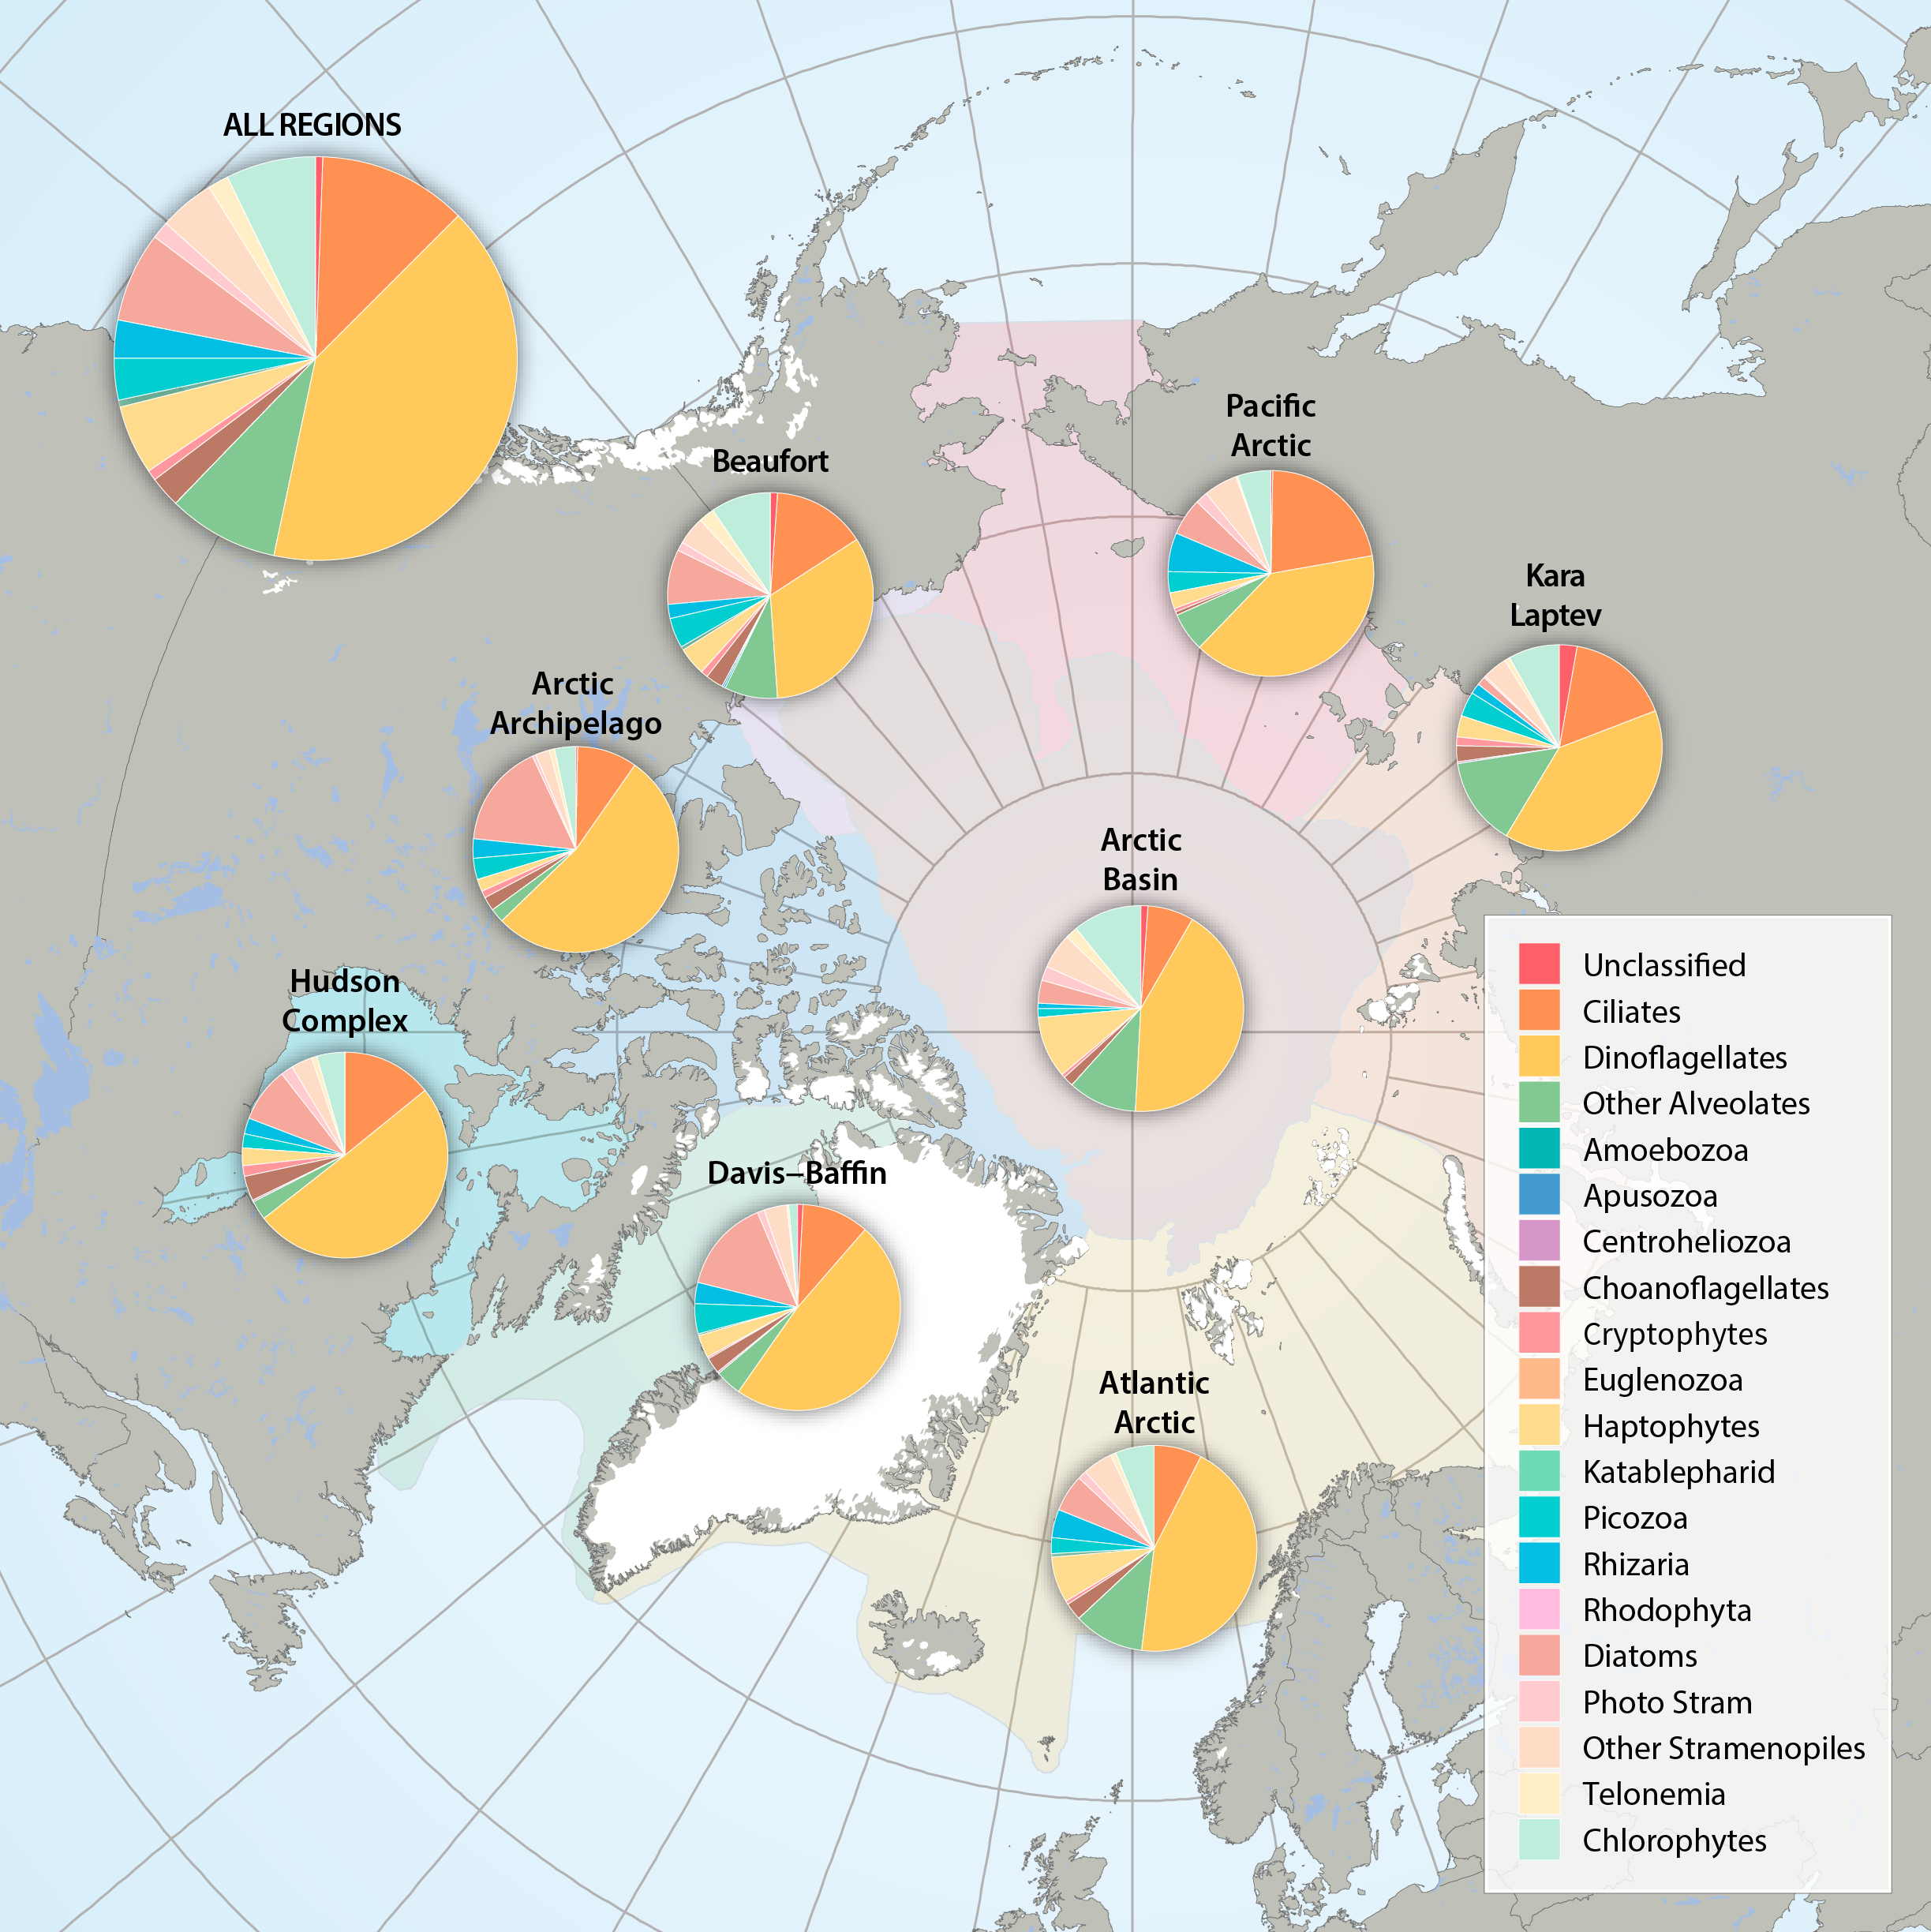
Figure 3.2.2a: Relative abundance of major eukaryote taxonomic groups found by high throughput sequencing of the small-subunit (18S) rRNA gene across Arctic Marine Areas. Figure 3.2.2b: Relative abundance of major eukaryote functional groups found by microscopy in the Arctic Marine Areas. STATE OF THE ARCTIC MARINE BIODIVERSITY REPORT - <a href="https://arcticbiodiversity.is/findings/plankton" target="_blank">Chapter 3</a> - Page 70 - Figures 3.2.2a and 3.2.2b
-
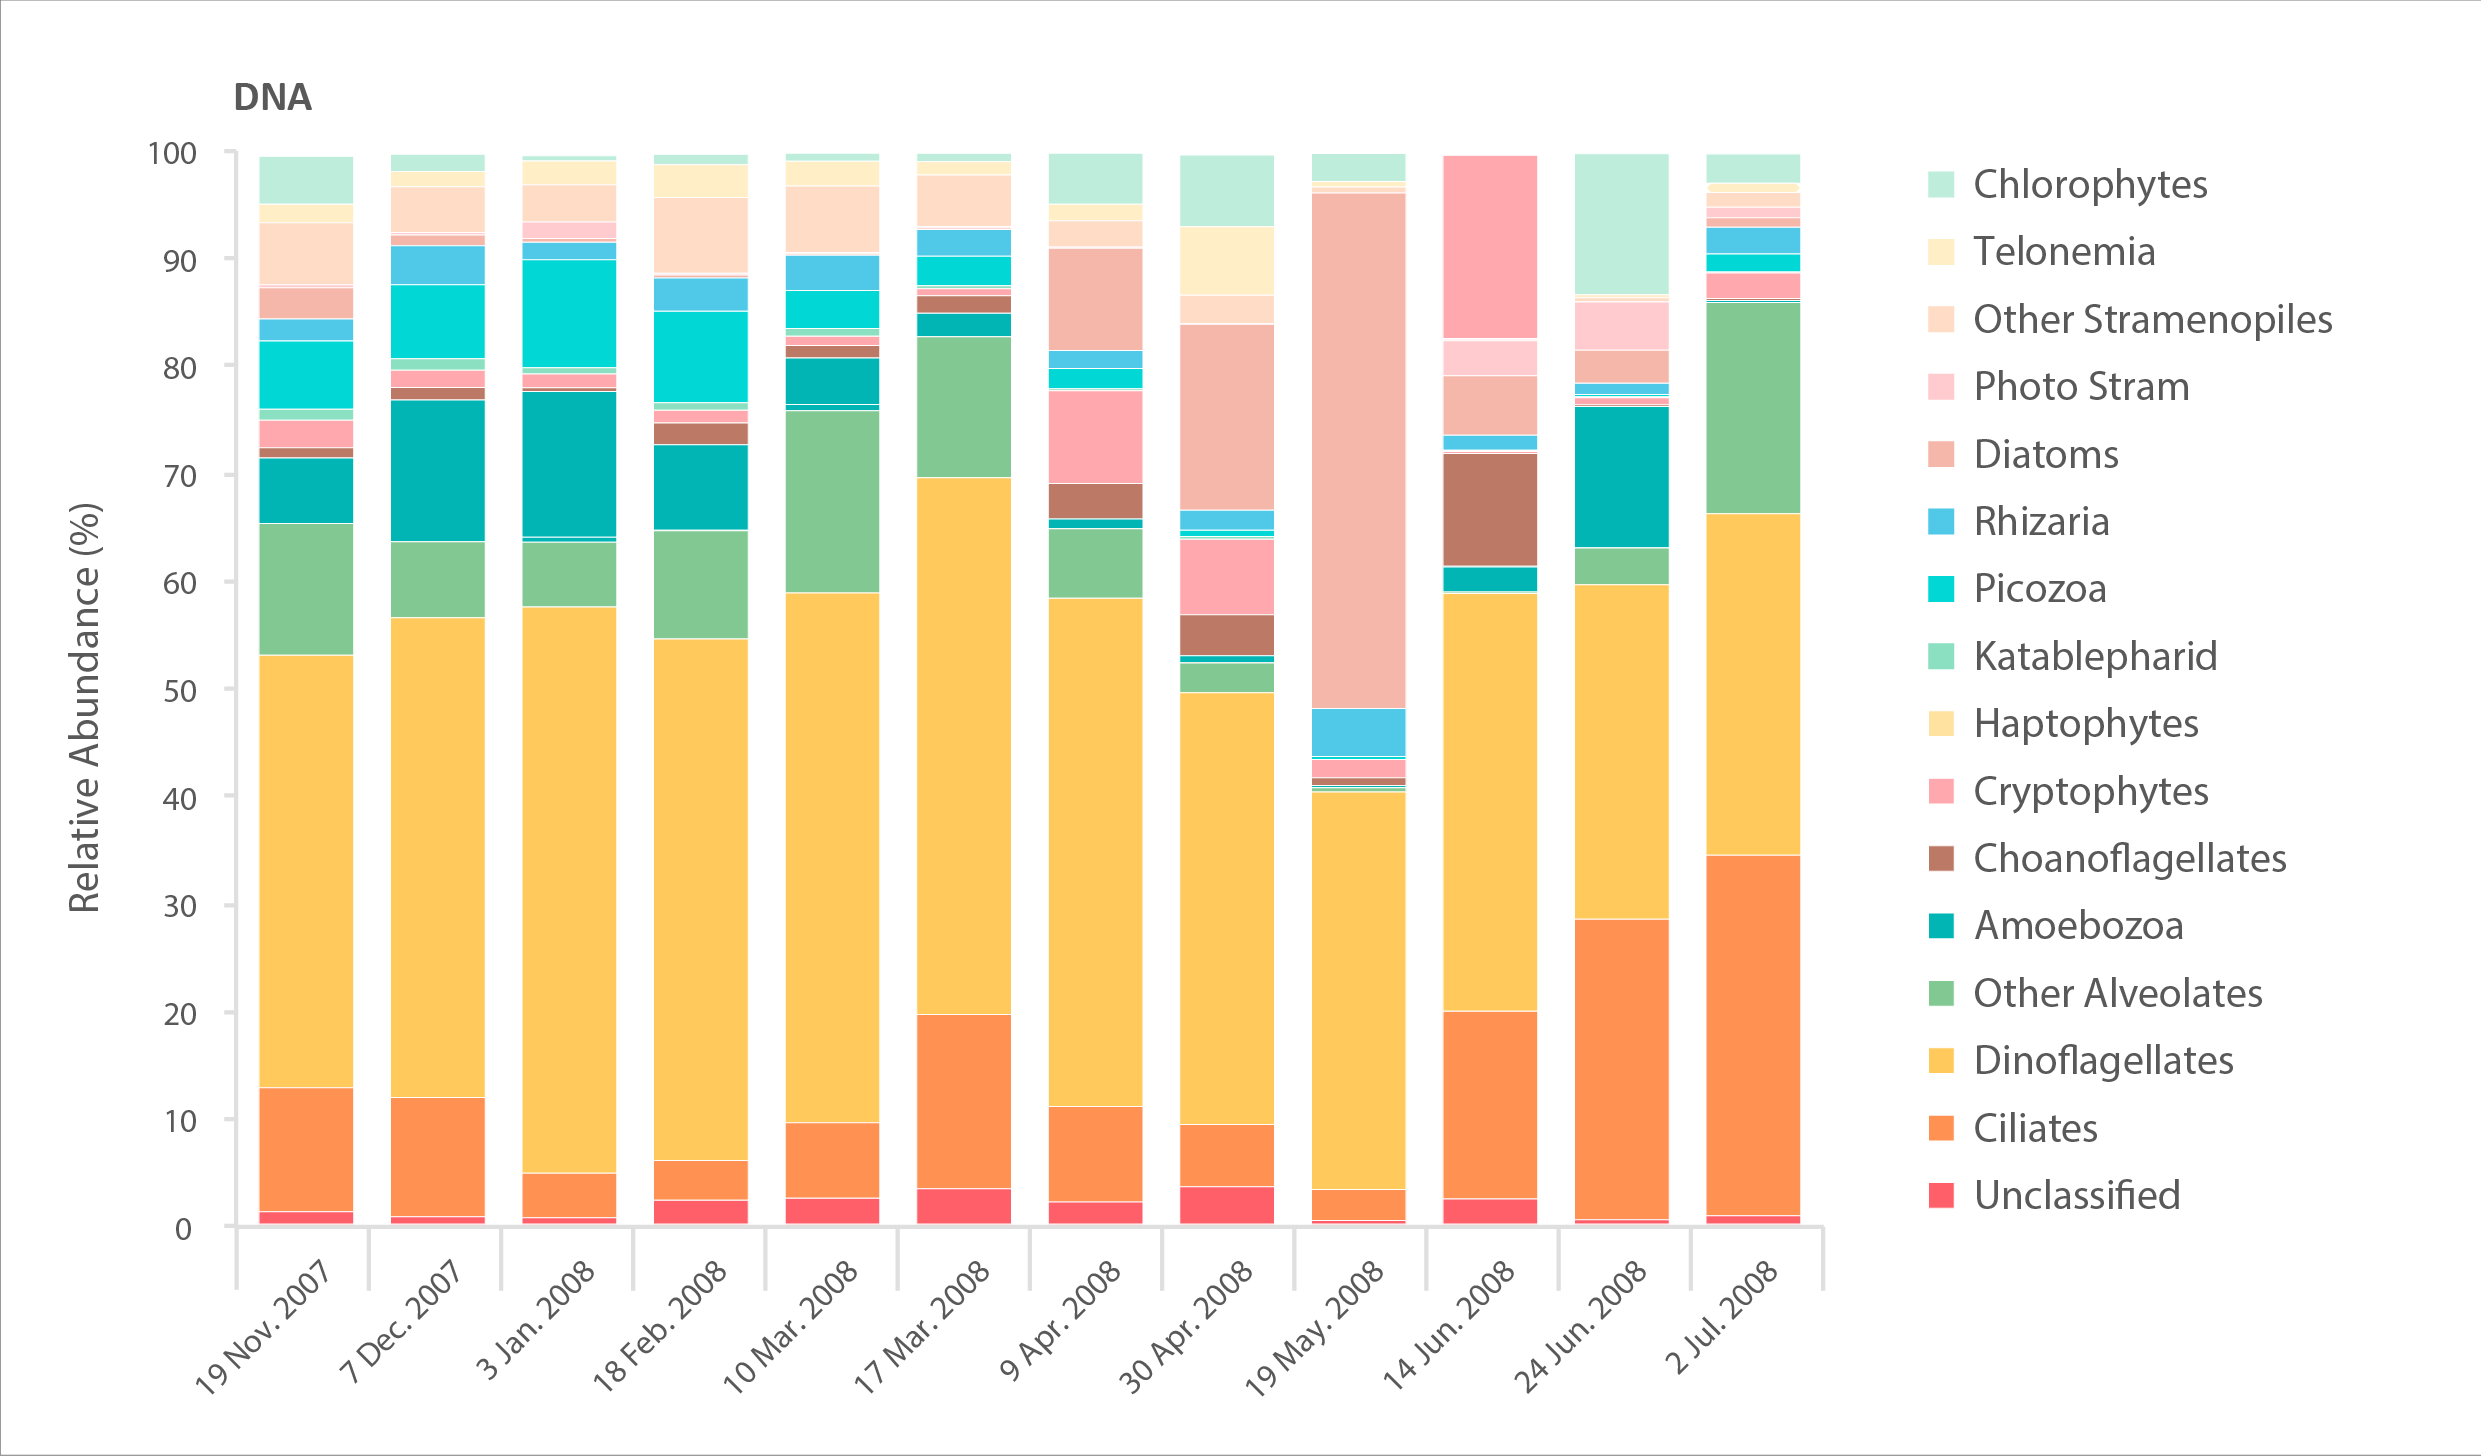
Relative abundance of major eukaryote taxonomic groups found by high throughput sequencing of the small-subunit (18S) rRNA gene. Time series collected by sampling every 2-6 weeks in Amundsen Gulf of the Beaufort Sea over the winter-spring transition in 2007–2008. Sampling DNA gives information about presence/absence, while sampling RNA gives information about the state of activity of different taxa. STATE OF THE ARCTIC MARINE BIODIVERSITY REPORT - <a href="https://arcticbiodiversity.is/findings/plankton" target="_blank">Chapter 3</a> - Page 72 - Figures 3.2.3
-
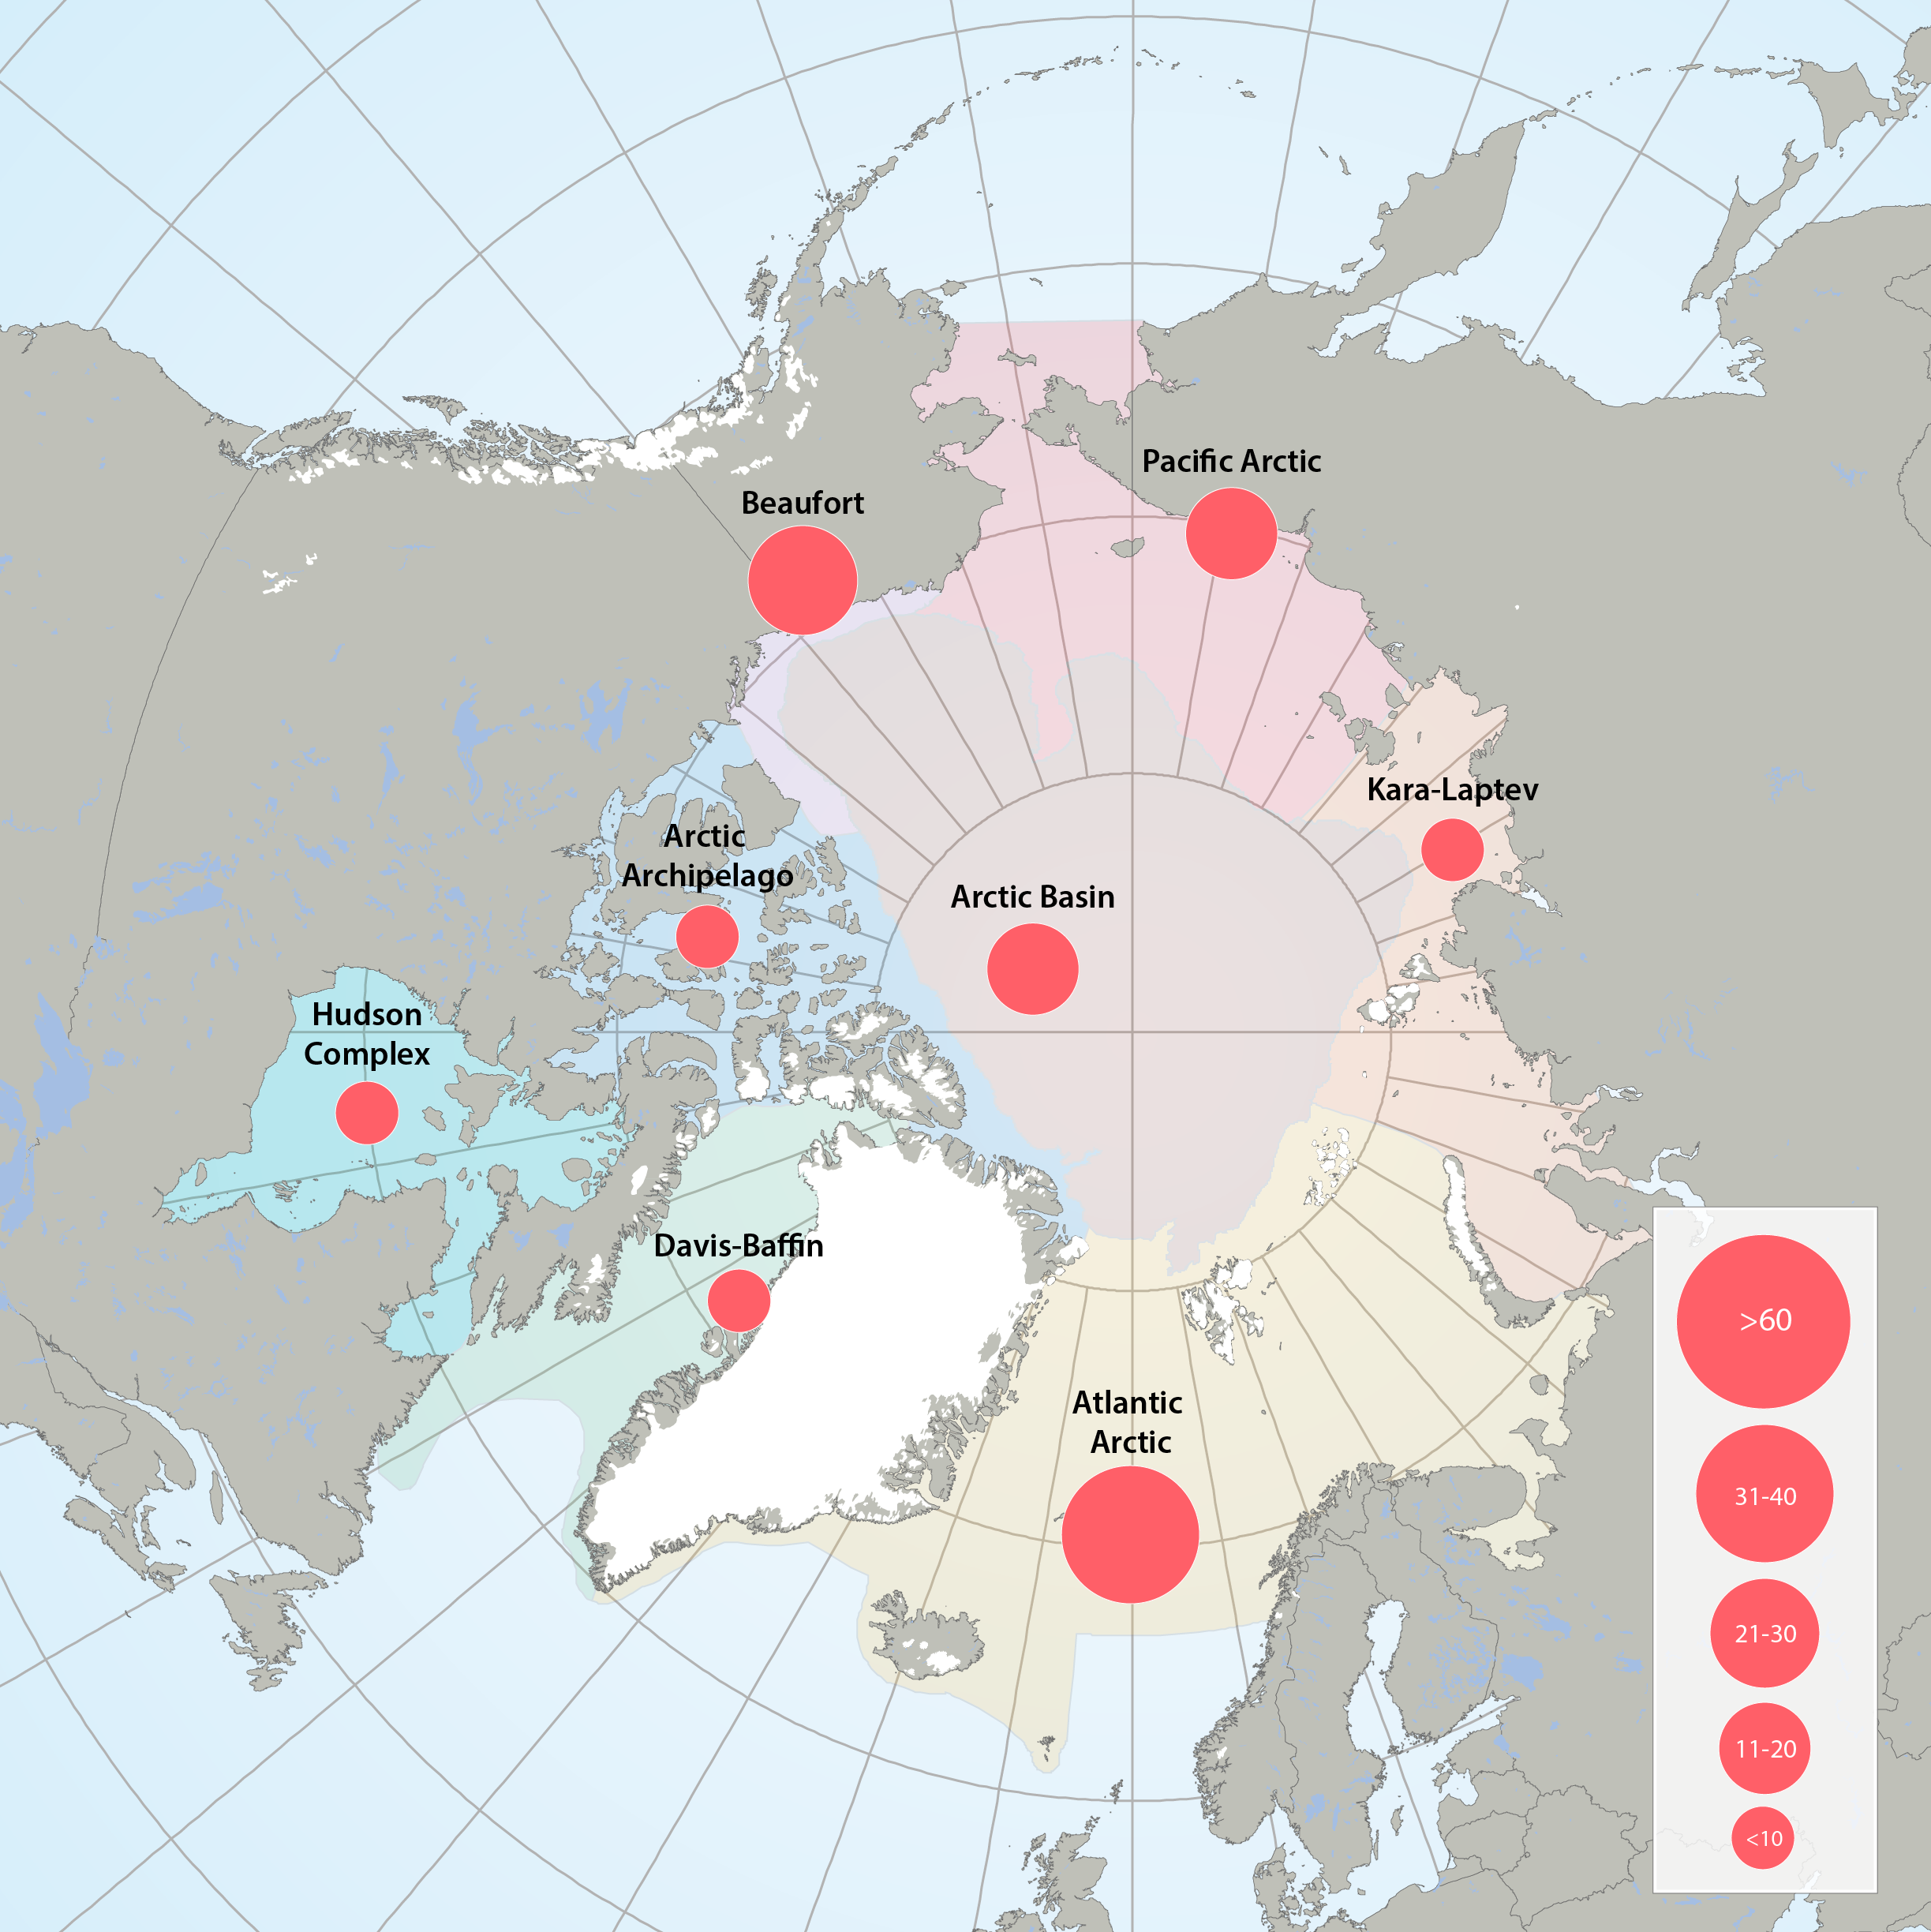
Figure 3.2.1a: Map of high throughput sequencing records from the Arctic Marine Areas. Figure 3.2.1b: Map of records of phytoplankton taxa using microscopy from the Arctic Marine Areas. STATE OF THE ARCTIC MARINE BIODIVERSITY REPORT - <a href="https://arcticbiodiversity.is/findings/plankton" target="_blank">Chapter 3</a> - Page 35 - Figure 3.2.1a and Figure 3.2.1b In terms of stations sampled, the greatest sampling effort of high-throughput sequencing in Arctic marine water columns, by far, has been in the Beaufort Sea/Amundsen Gulf region and around Svalbard. High through-put sequencing has also been used on samples from the Chukchi Sea, Canadian Arctic Archipelago, Baffin Bay, Hudson Bay, the Greenland Sea and Laptev Sea.
-
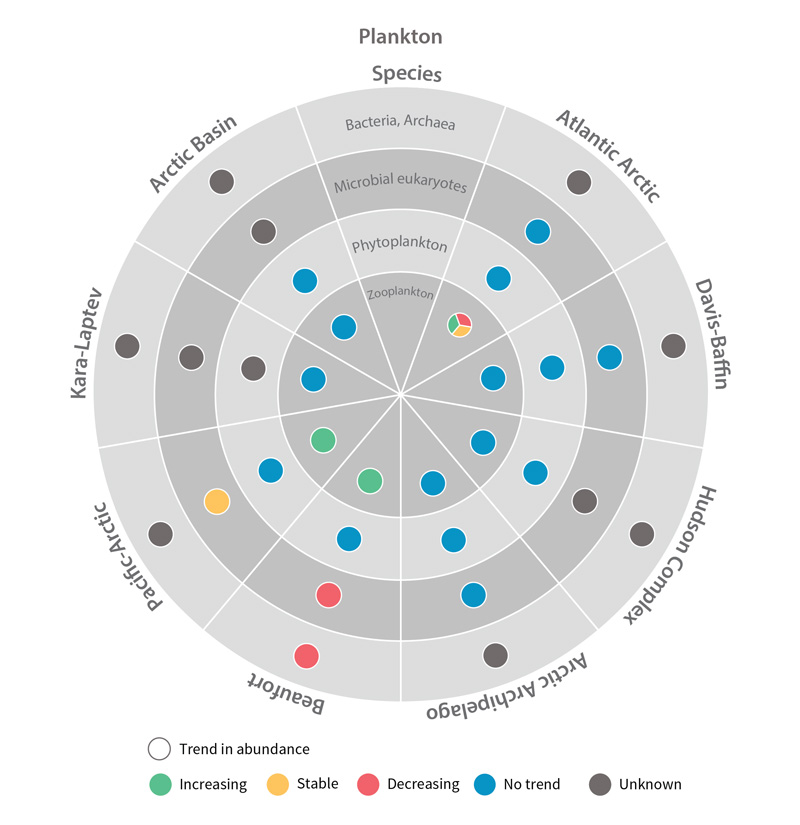
Trends in abundance of plankton Focal Ecosystem Components across each Arctic Marine Area. STATE OF THE ARCTIC MARINE BIODIVERSITY REPORT - Chapter 4 - Page 178 - Figure 4.2
-
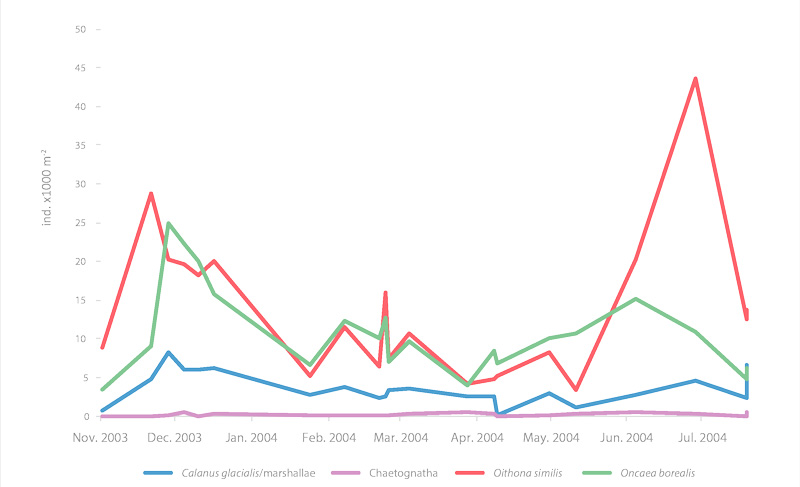
Seasonal time series of the major zooplankton in Franklin Bay, Canada STATE OF THE ARCTIC MARINE BIODIVERSITY REPORT - <a href="https://arcticbiodiversity.is/findings/plankton" target="_blank">Chapter 3</a> - Page 78 - Figure 3.2.9 Mesozooplankton abundance, integrated from 10 m above the seafloor to the surface (ind m-2), in Franklin Bay during the CASES 2003-04 overwintering expedition. Most of the sampling was done at the overwintering station and a few stations were close to this site in autumn 2003 and summer 2004.
-
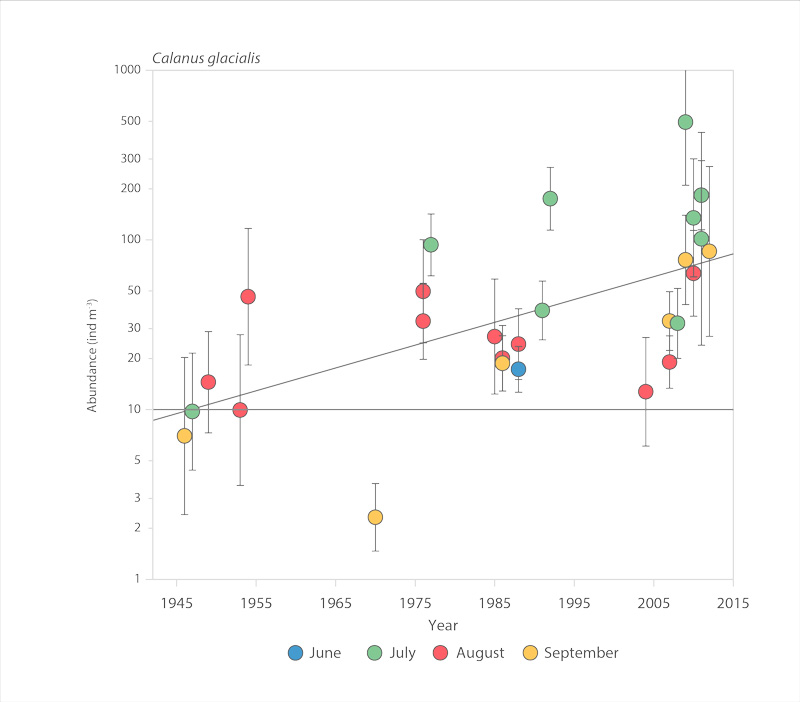
Abundance of the copepod Calanus glacialis in the Chukchi Sea, 1945-2012 (after Ershova et al. 2015b). STATE OF THE ARCTIC MARINE BIODIVERSITY REPORT - <a href="https://arcticbiodiversity.is/findings/plankton" target="_blank">Chapter 3</a> - Page 75 - Figure 3.2.6
-

Interannual differences in taxonomic composition of phytoplankton during summer in a) Kongsfjorden and b) Rijpfjorden (Source: MOSJ, Norwegian Polar Institute). STATE OF THE ARCTIC MARINE BIODIVERSITY REPORT - <a href="https://arcticbiodiversity.is/findings/plankton" target="_blank">Chapter 3</a> - Page 74 - Figure 3.2.5
-
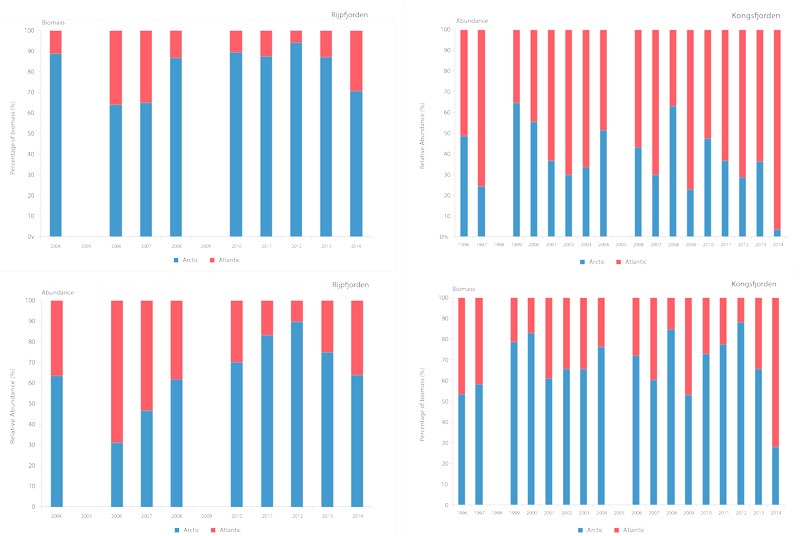
Time series of relative proportions of Arctic and Atlantic Calanus species in Kongsfjorden (top) and Rijpfjorden (bottom) (Source: MOSJ, Norwegian Polar Institute). STATE OF THE ARCTIC MARINE BIODIVERSITY REPORT - <a href="https://arcticbiodiversity.is/findings/plankton" target="_blank">Chapter 3</a> - Page 77 - Figure 3.2.8
-
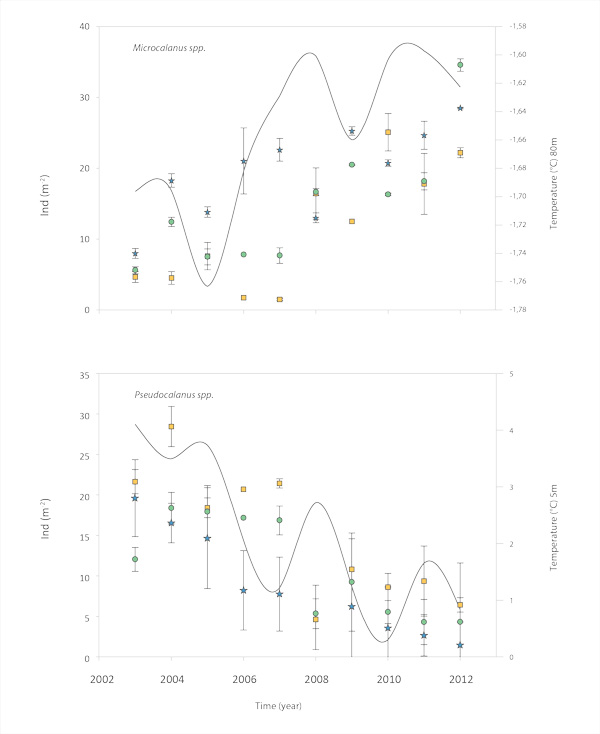
Temperature and copepod abundance in Zackenberg, northeastern Greenland. Temperature is measured at 80 m for Microcalanus and 5 m for Pseudocalanus (Arendt et al. 2016). STATE OF THE ARCTIC MARINE BIODIVERSITY REPORT - <a href="https://arcticbiodiversity.is/findings/plankton" target="_blank">Chapter 3</a> - Page 76 - Figure 3.2.7
-
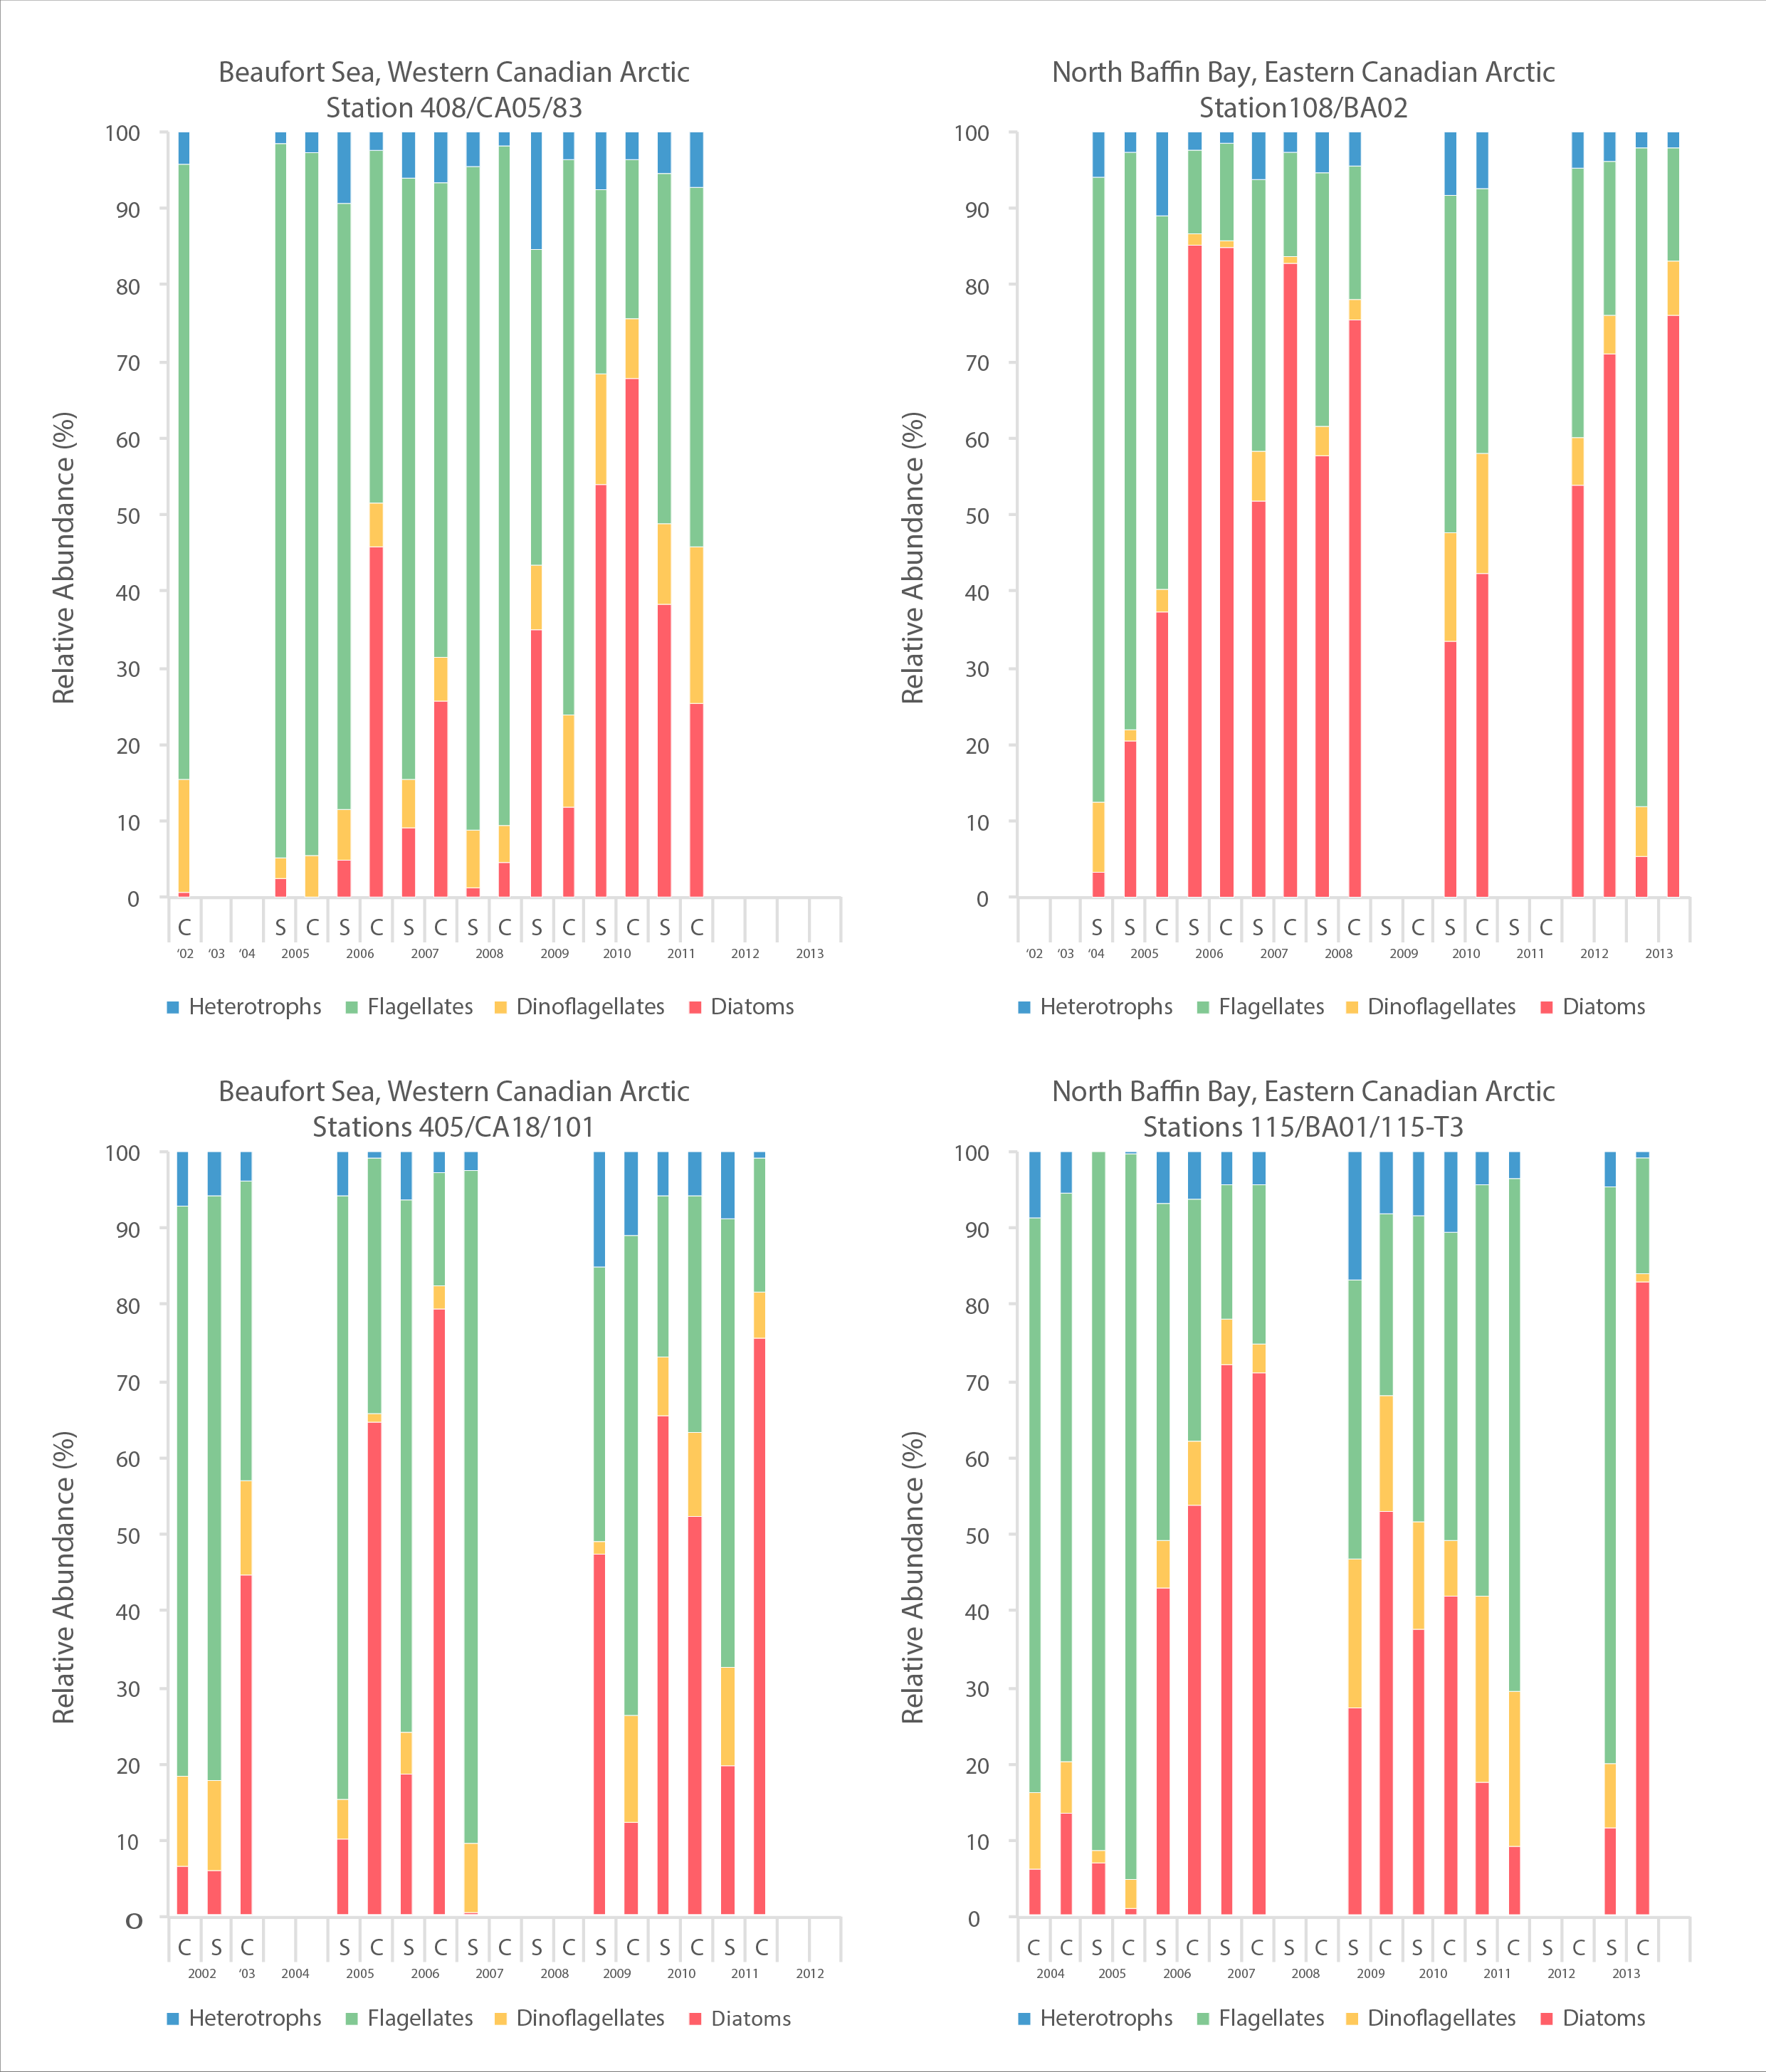
A time series of cell abundances, as determined by microscopy, of major phytoplankton groups from 2002-2013 for four sites, two in an east-west transect in Amundsen Gulf, Beaufort Sea and two in an east-west transect in northern Baffin Bay. STATE OF THE ARCTIC MARINE BIODIVERSITY REPORT - <a href="https://arcticbiodiversity.is/findings/plankton" target="_blank">Chapter 3</a> - Page 73 - Figure 3.2.4 A time series of cell abundances, as determined by microscopy, of major phytoplankton groups from 2002-2013 for four sites, 2 in the Beaufort Sea and 2 in northern Baffin Bay. Cell abundances are given as cells per liter. On most sampling dates, there is data from surface water and from the subsurface chlorophyll maximum (Cmax in the spreadsheet). Some additional information is included in the column headings, such as the percent of light at the sample depth; however, this should not be included in the figure. You may or may not want to include a map element in this figure, and rough coordinates of the sampling sites are included. The second sheet of the excel file presents the same data but at a finer scale of taxonomic resolution. It is the first sheet that should be used.