 Arctic Biodiversity Data Service - ABDS Catalog
Seaicebiota
Type of resources
Available actions
Topics
Keywords
Contact for the resource
Provided by
Representation types
Update frequencies
status
Scale
-
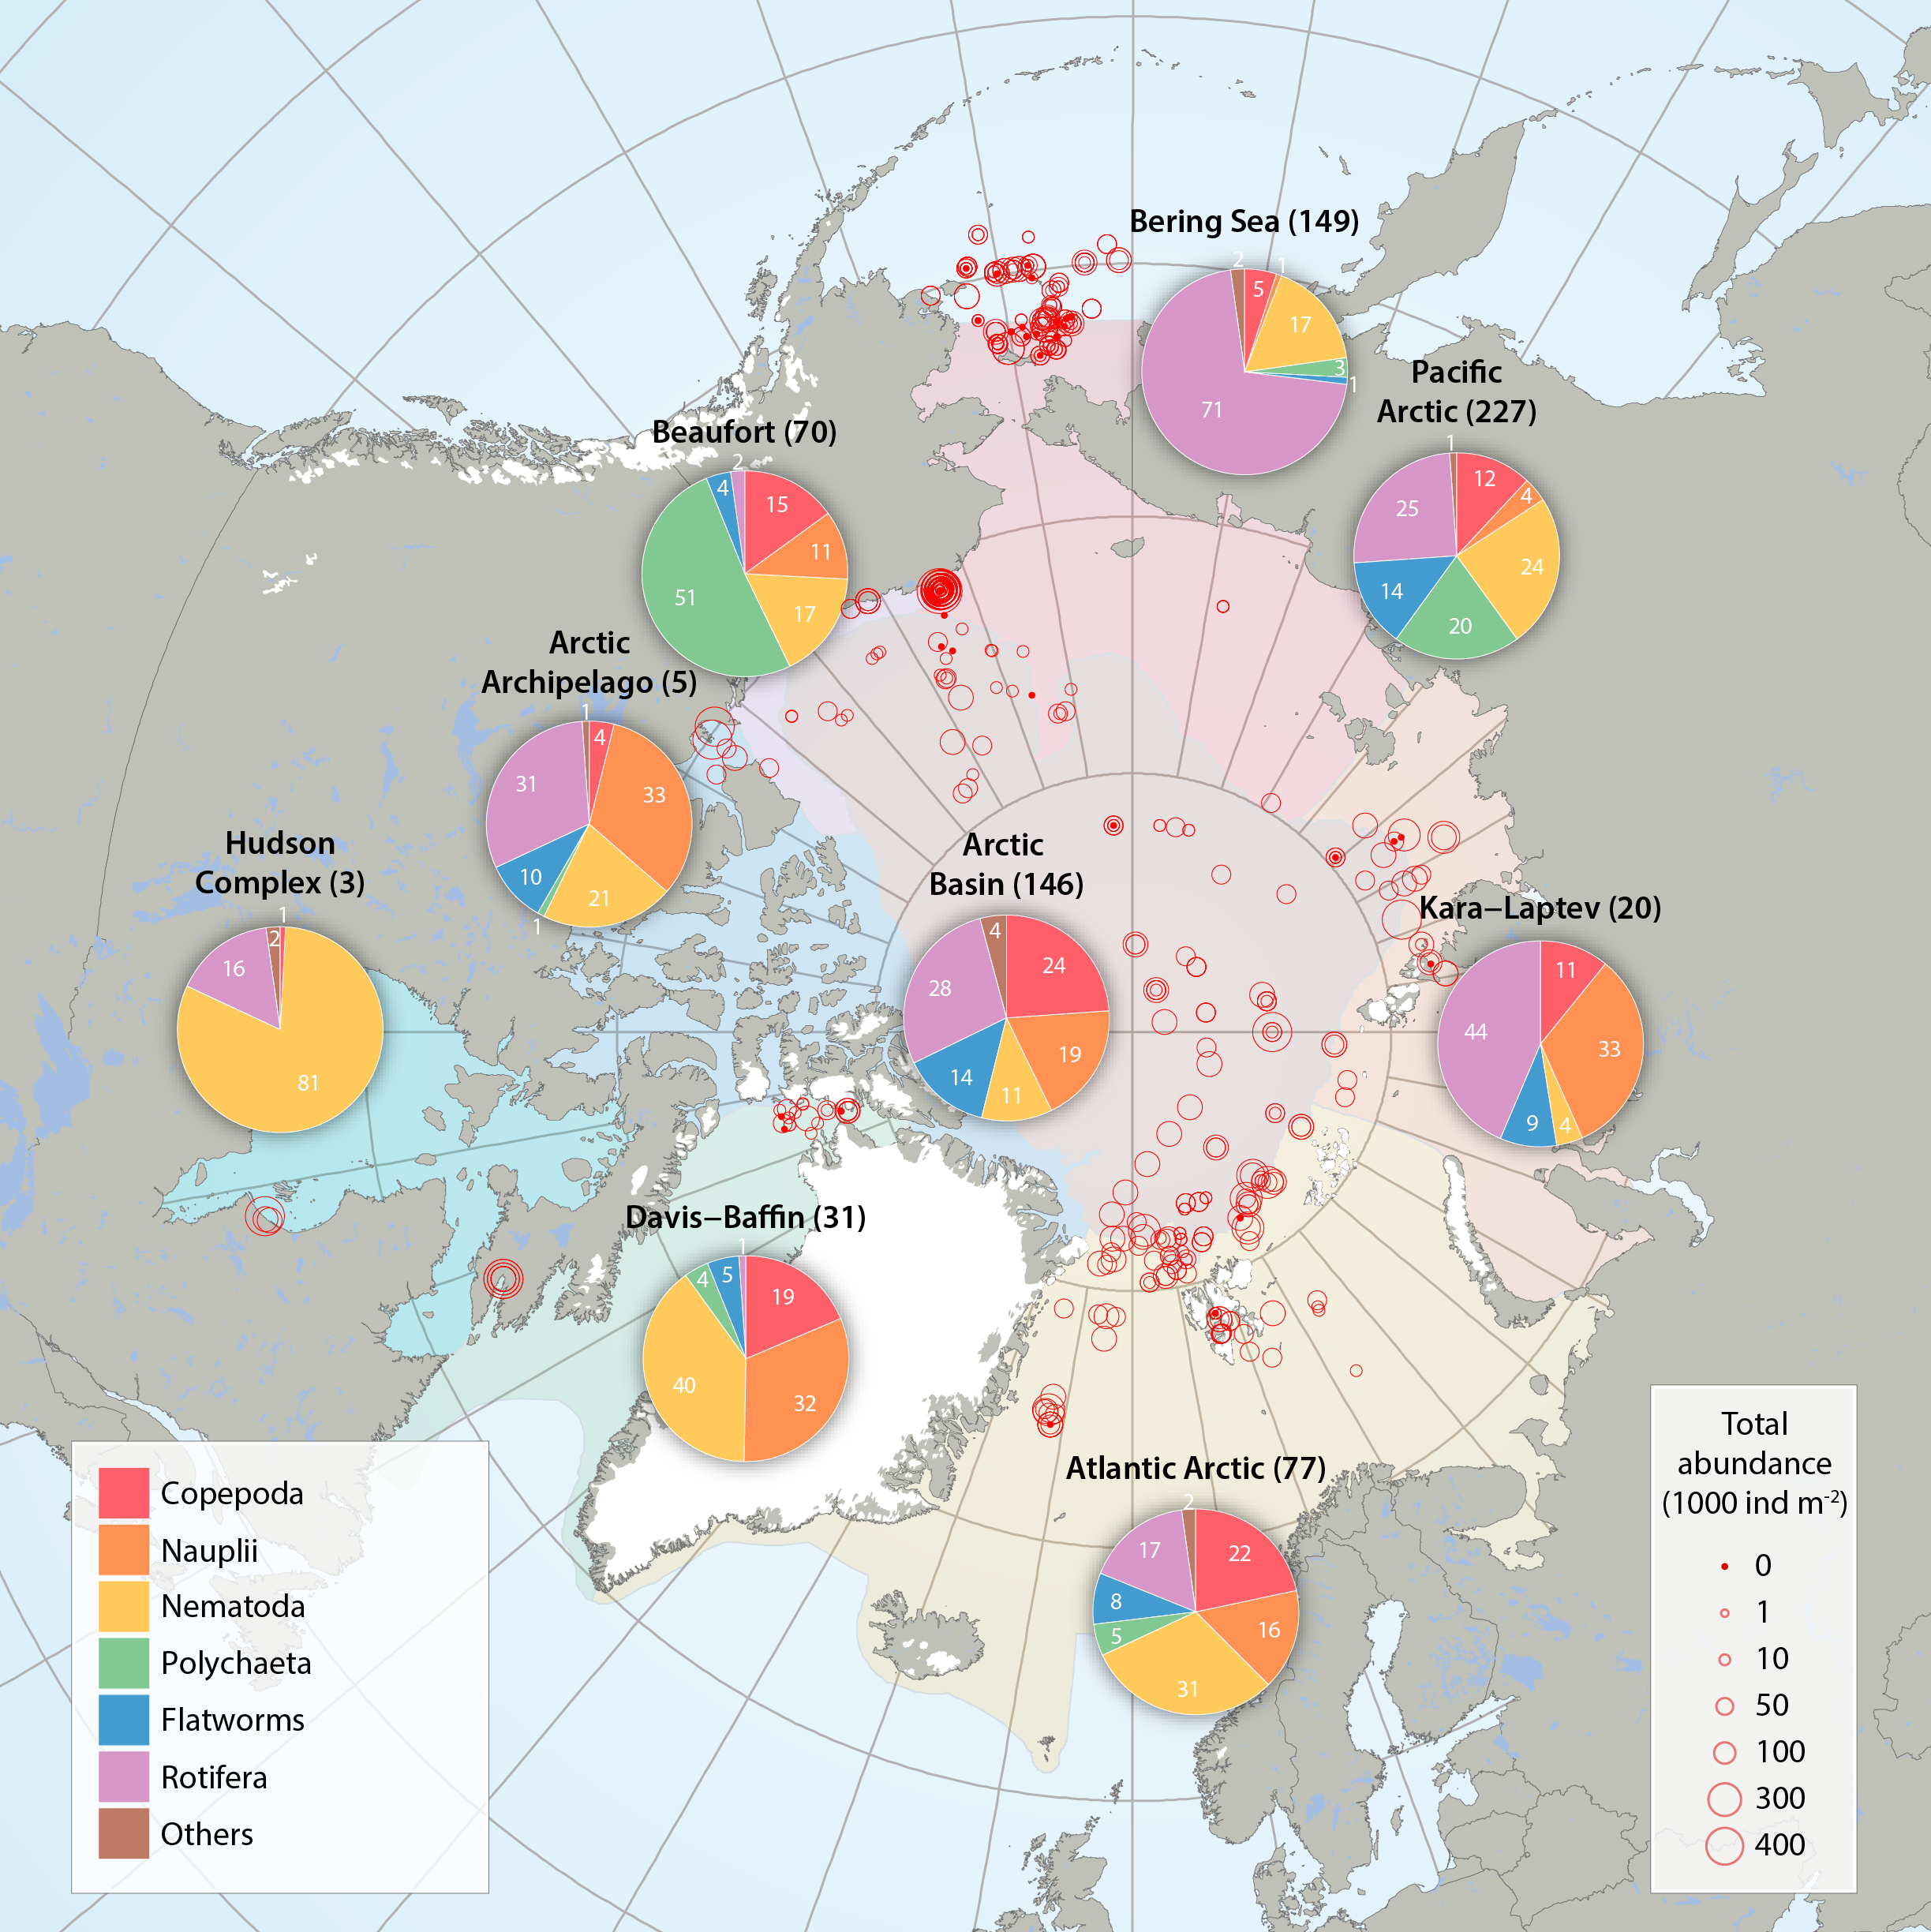
Sea ice meiofauna composition (pie charts) and total abundance (red circles) across the Arctic, compiled by the CBMP Sea Ice Biota Expert Network from 27 studies between 1979 and 2015. Scaled circles show total abundance per individual ice core while pie charts show average relative contribution by taxon per Arctic Marine Area (AMA). Number of ice cores for each AMA is given in parenthesis after region name. Note that studies were conducted at different times of the year, with the majority between March and August (see 3.1 Appendix). The category ‘other’ includes young stages of bristle worms (Polychaeta), mussel shrimps (Ostracoda), forams (Foraminifera), hydroid polyps (Cnidaria), comb jellies (Ctenophora), sea butterflies (Pteropoda), marine mites (Acari) and unidentified organisms. STATE OF THE ARCTIC MARINE BIODIVERSITY REPORT - <a href="https://arcticbiodiversity.is/findings/sea-ice-biota" target="_blank">Chapter 3</a> - Page 40 - Figure 3.1.4 From the report draft: "Here, we synthesized 19 studies across the Arctic conducted between 1979 and 2015, including unpublished sources (B. Bluhm, R. Gradinger, UiT – The Arctic University of Norway; H. Hop, Norwegian Polar Institute; K. Iken, University of Alaska Fairbanks). These studies sampled landfast sea ice and offshore pack ice, both first- and multiyear ice (Appendix 3.1). Meiofauna abundances reported in individual data sources were converted to individuals m-2 of sea ice assuming that ice density was 95% of that in melted ice. Due to the low taxonomic resolution in the reviewed studies, ice meiofauna were grouped into: Copepoda, nauplii (for copepods as well as other taxa with naupliar stages), Nematoda, Polychaeta (mostly juveniles, but also trochophores), flatworms (Acoelomorpha and Platyhelminthes; these phyla have mostly been reported as one category), Rotifera, and others (which include meroplanktonic larvae other than Polychaeta, Ostracoda, Foraminifera, Cnidaria, Ctenophora, Pteropoda, Acari, and unidentified organisms). Percentage of total abundance for each group was calculated for each ice core, and these percentages were used for regional averages. Maximum available ice core length was used in data analysis, but 50% of these ice cores included only the bottom 10 cm of the ice, 12% the bottom 5 cm, 10% the bottom 2 cm, and 11% the entire ice-thickness. Data from 617 cores were used."
-
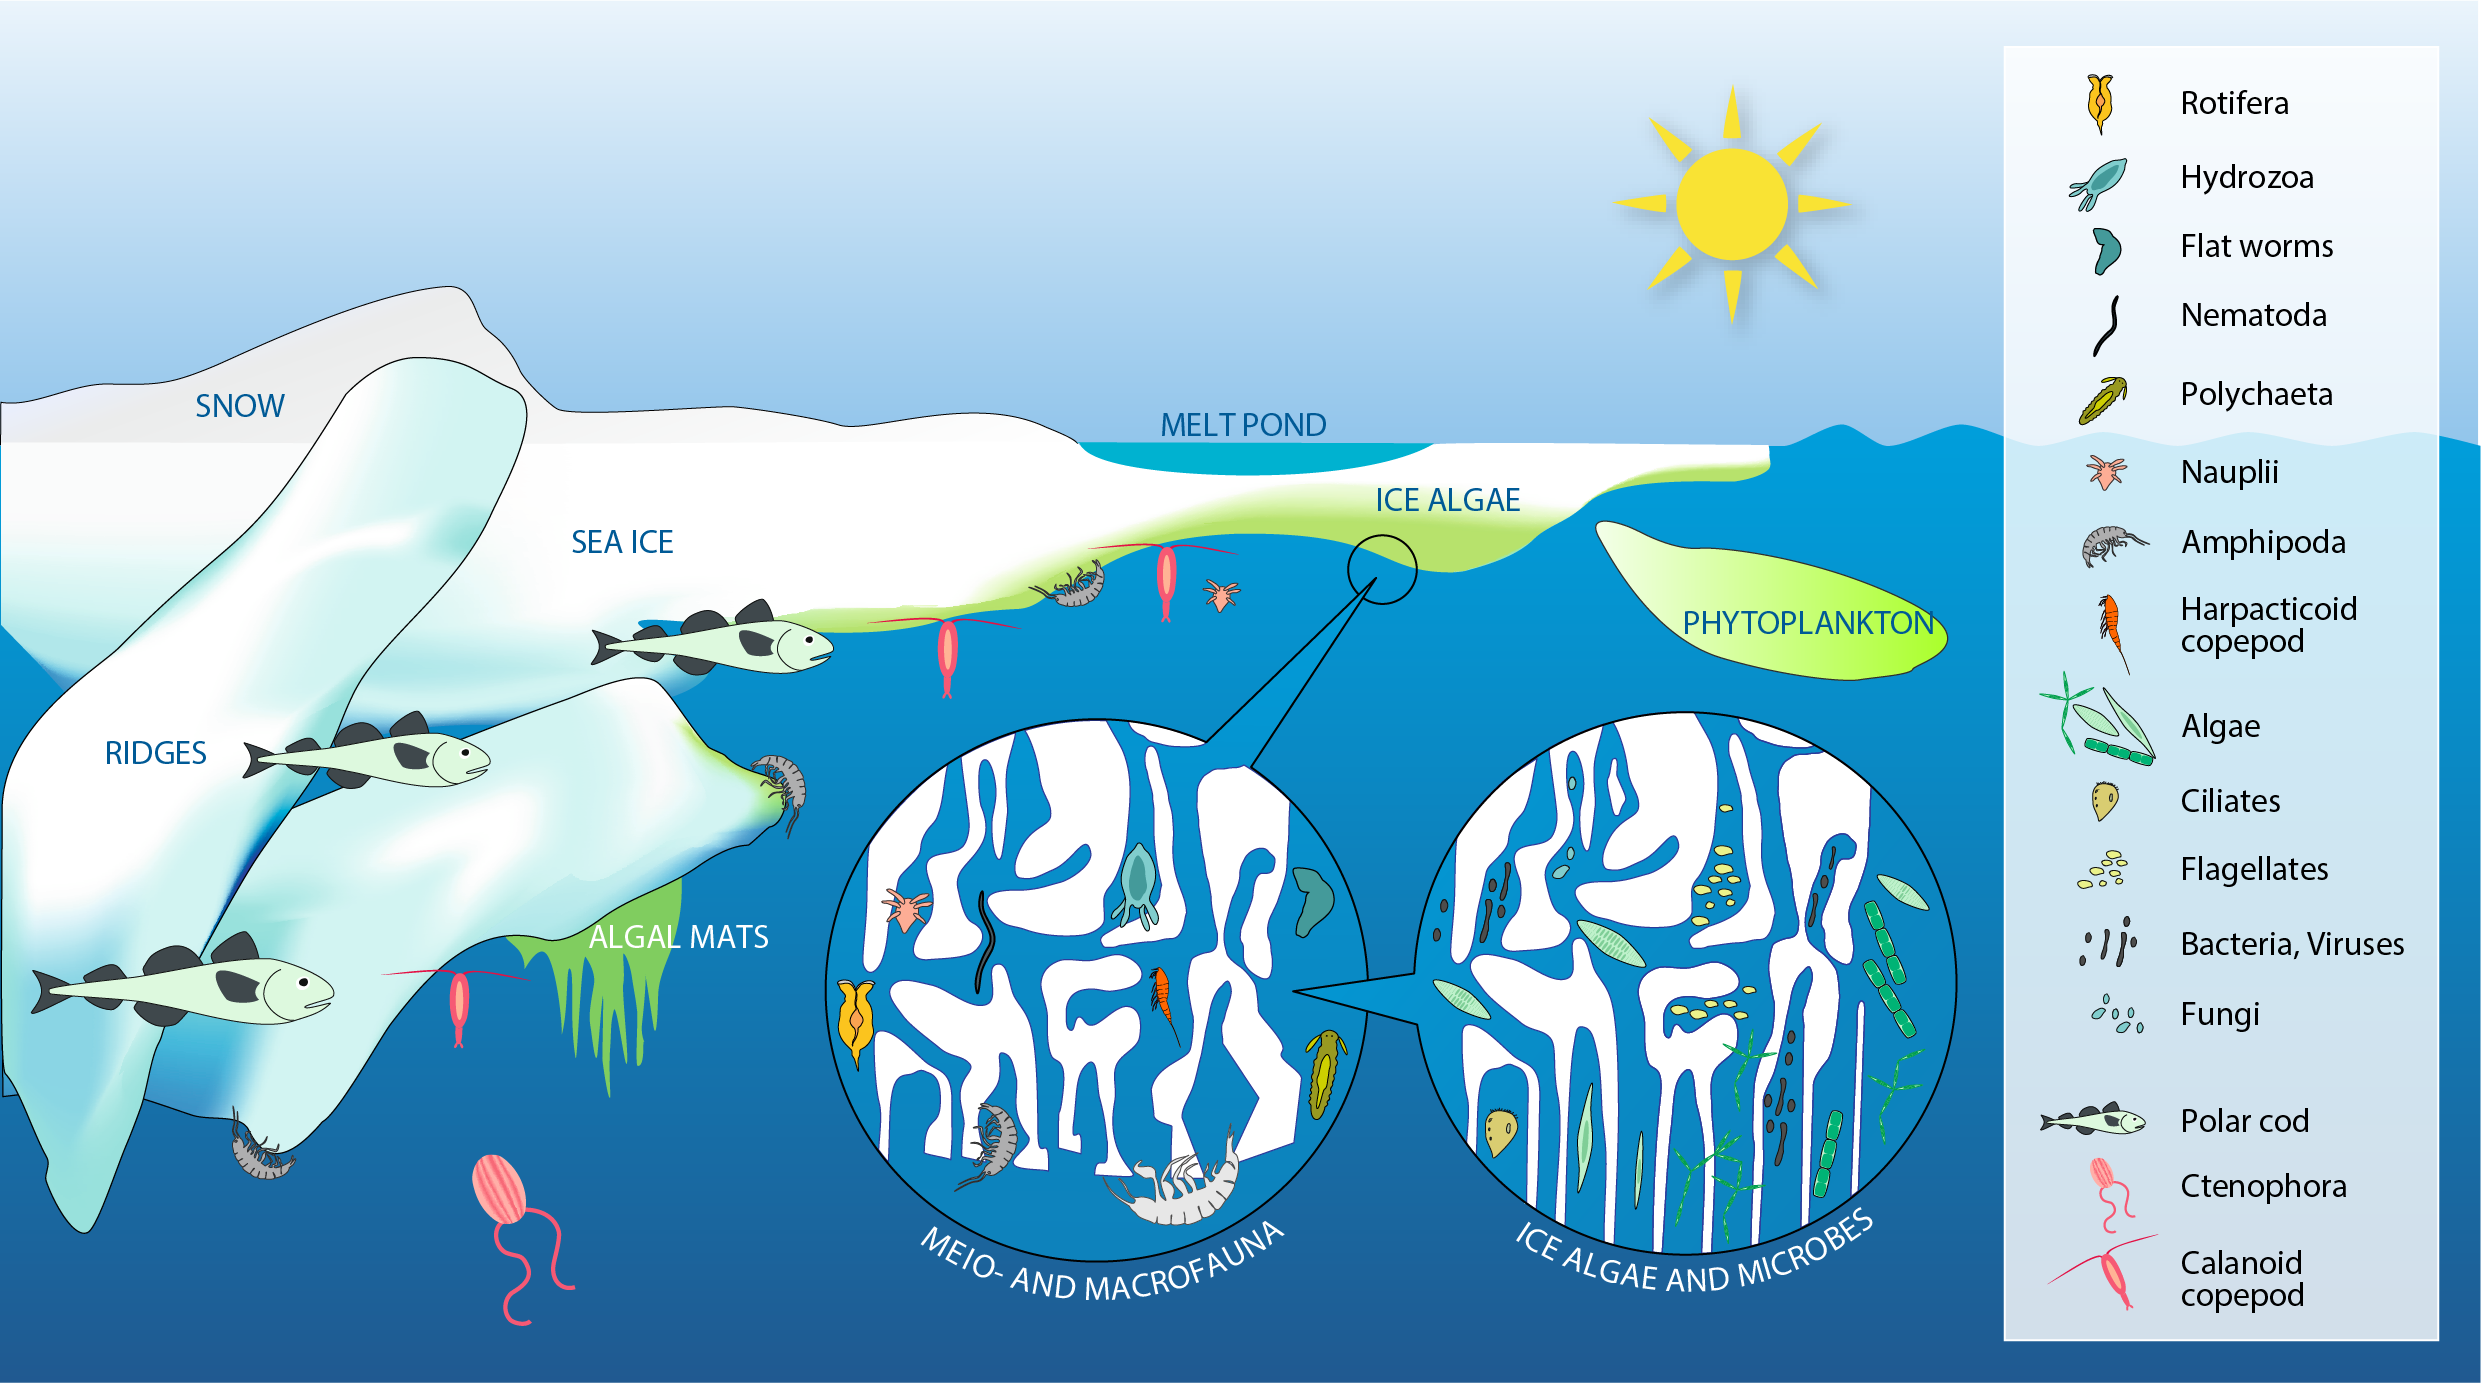
Sea ice provides a wide range of microhabitats for diverse biota including microbes, single-celled eukaryotes (labelled algae), multicellular meiofauna, larger under-ice fauna (represented by amphipods), as well as polar cod (Boreogadus saida). Modified from Bluhm et al. (2017). STATE OF THE ARCTIC MARINE BIODIVERSITY REPORT - <a href="https://arcticbiodiversity.is/findings/sea-ice-biota" target="_blank">Chapter 3</a> - Page 35 - Figure 3.1.1
-
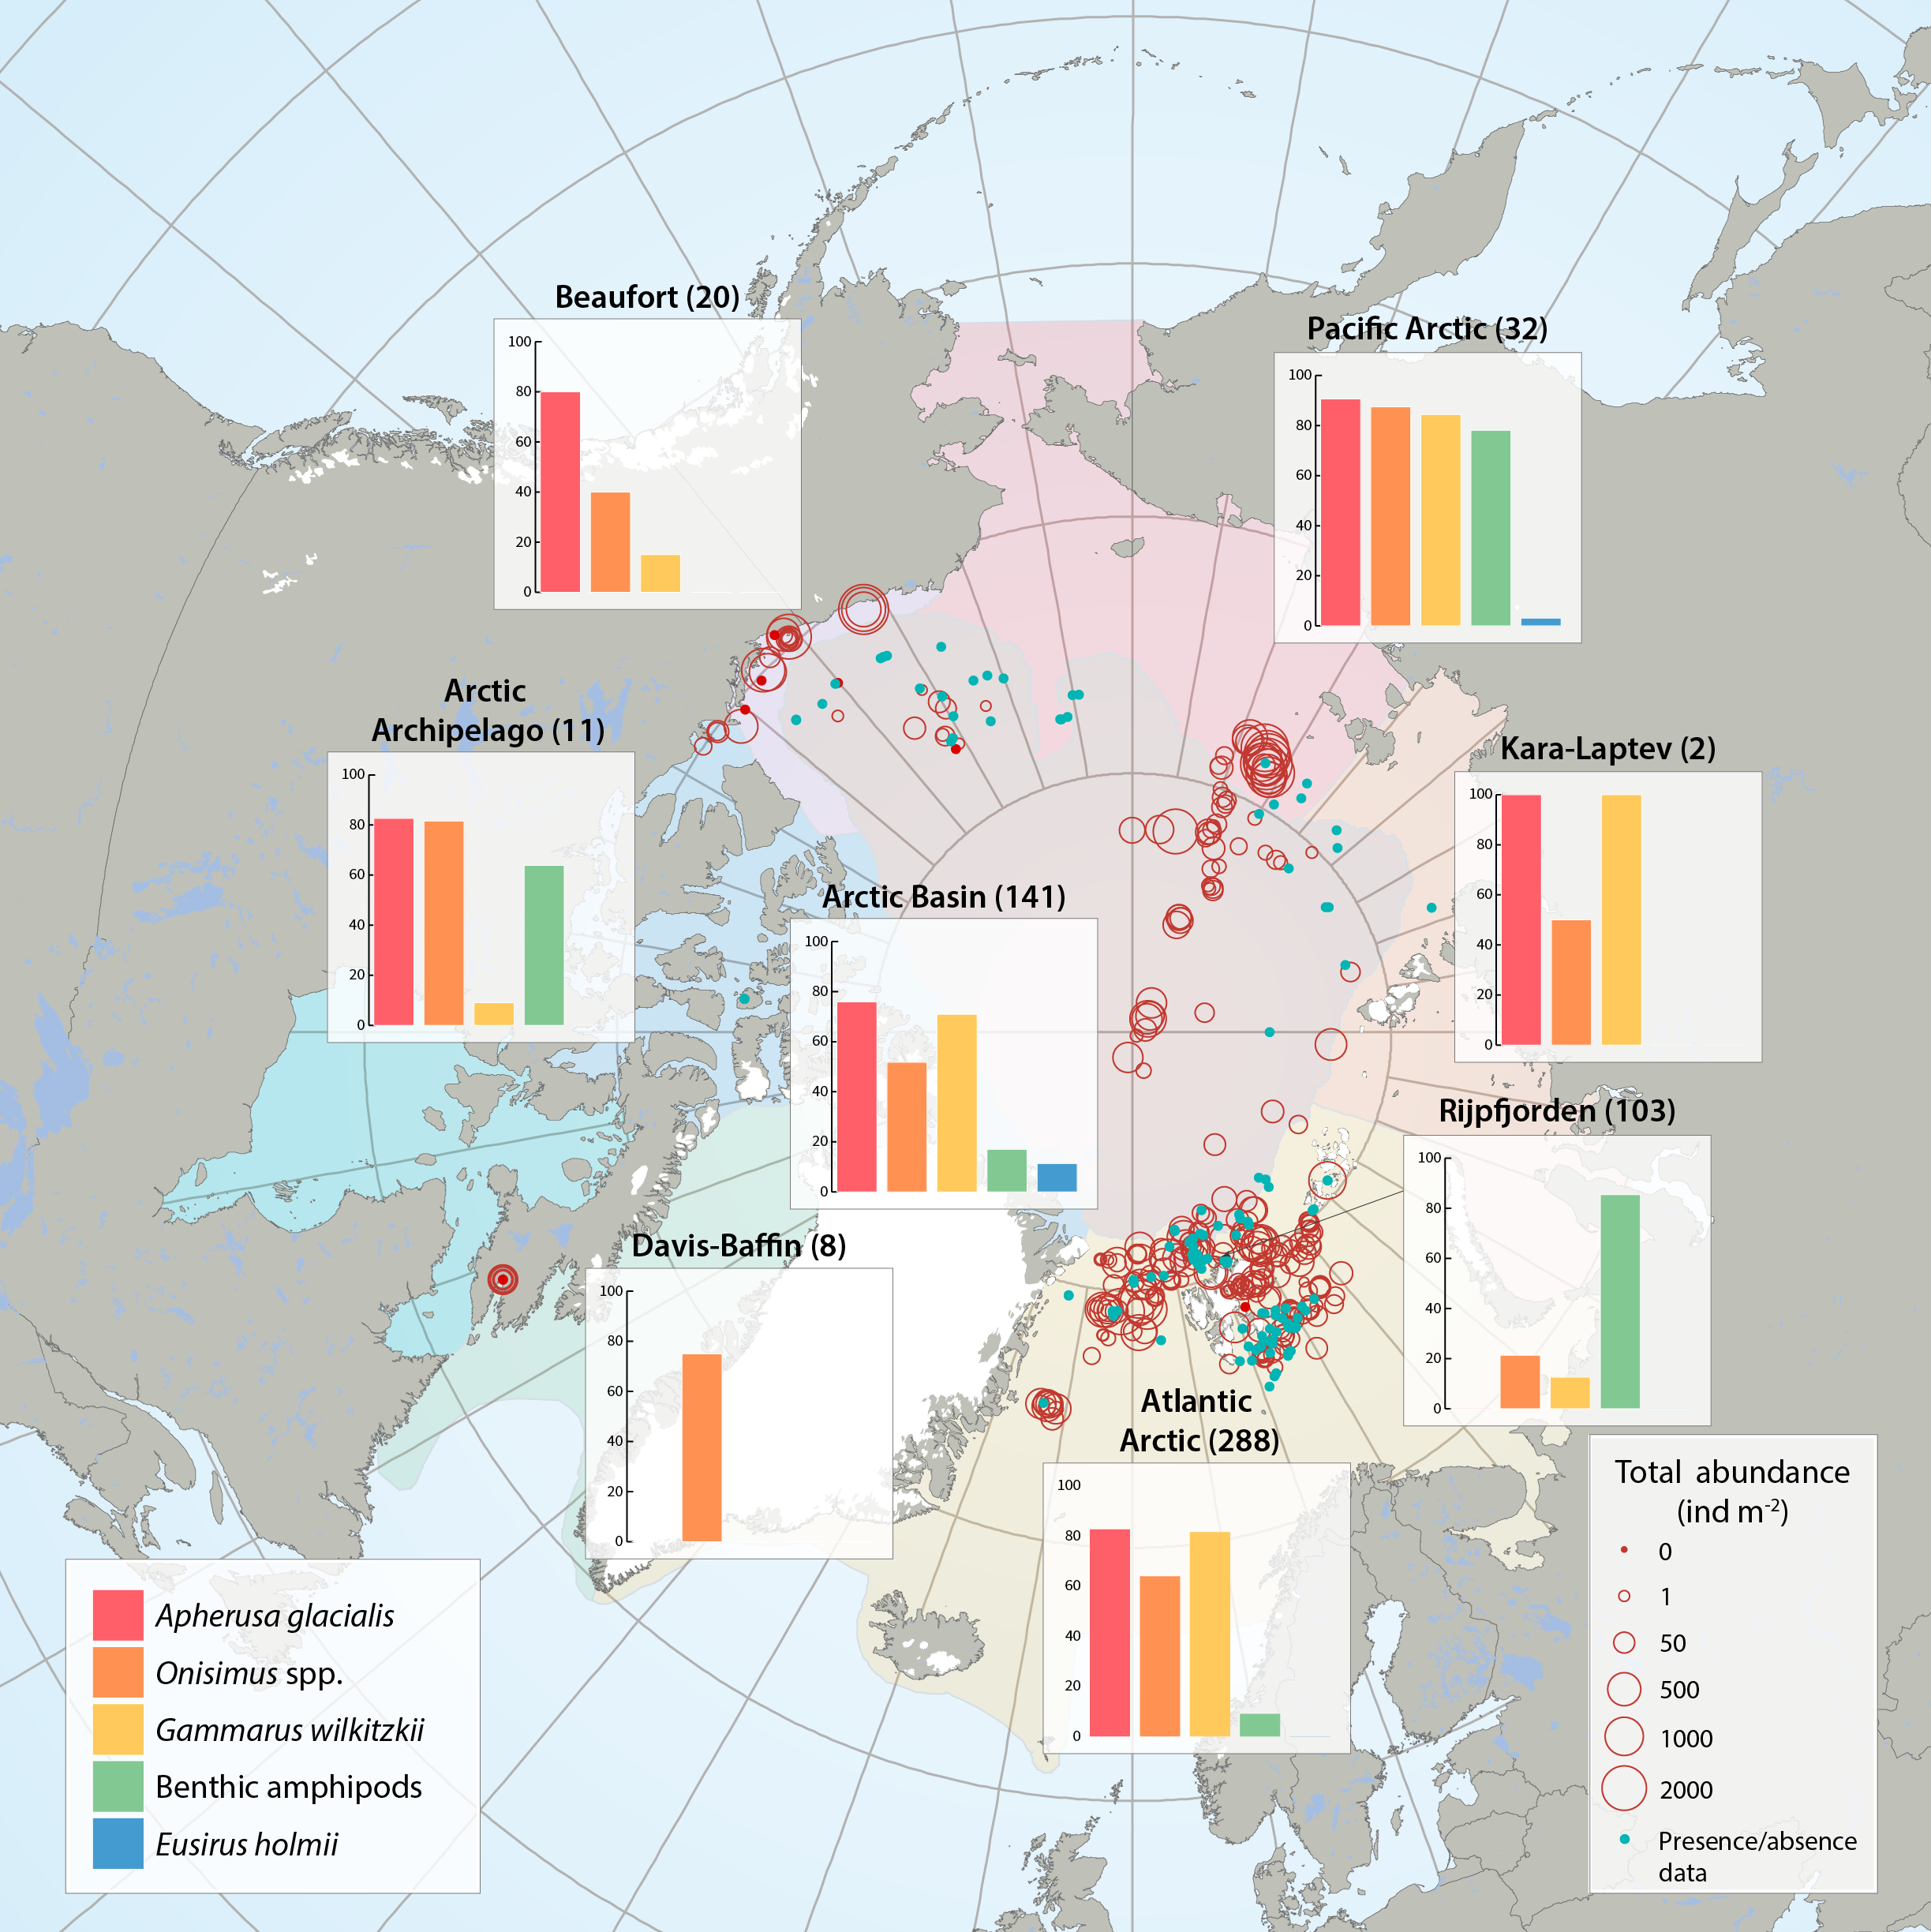
Sea ice amphipod (macrofauna) distribution and abundance across the Arctic aggregated from 47 sources between 1977 and 2012 by the CBMP Sea Ice Biota Expert Network. Bar graphs illustrate the frequency of occurrence (%) of amphipods in samples that contained at least one ice-associated amphipod. Red circles illustrate the total abundances of all ice-associated amphipods in quantitative samples (individuals m-2) at locations of sampling for each Arctic Marine Area (AMA). Number of sampling efforts for each region is given in parenthesis after region name. Blue dots represent samples where only presence/ absence data were available and where amphipods were present. STATE OF THE ARCTIC MARINE BIODIVERSITY REPORT - <a href="https://arcticbiodiversity.is/findings/sea-ice-biota" target="_blank">Chapter 3</a> - Page 44 - Figure 3.1.6 From the report draft: "This summary includes 47 data sources of under-ice amphipods published between 1977 and 2012. When available, we collected information on abundance or density (ind. m-2, or ind. m-3 that were converted to ind. m-2) and biomass (g m-2, wet weight). If abundance or biomass data were not available, we examined presence/relative abundance information. Frequency of occurrence was calculated for regions across the Arctic using integrated data for all available years."
-
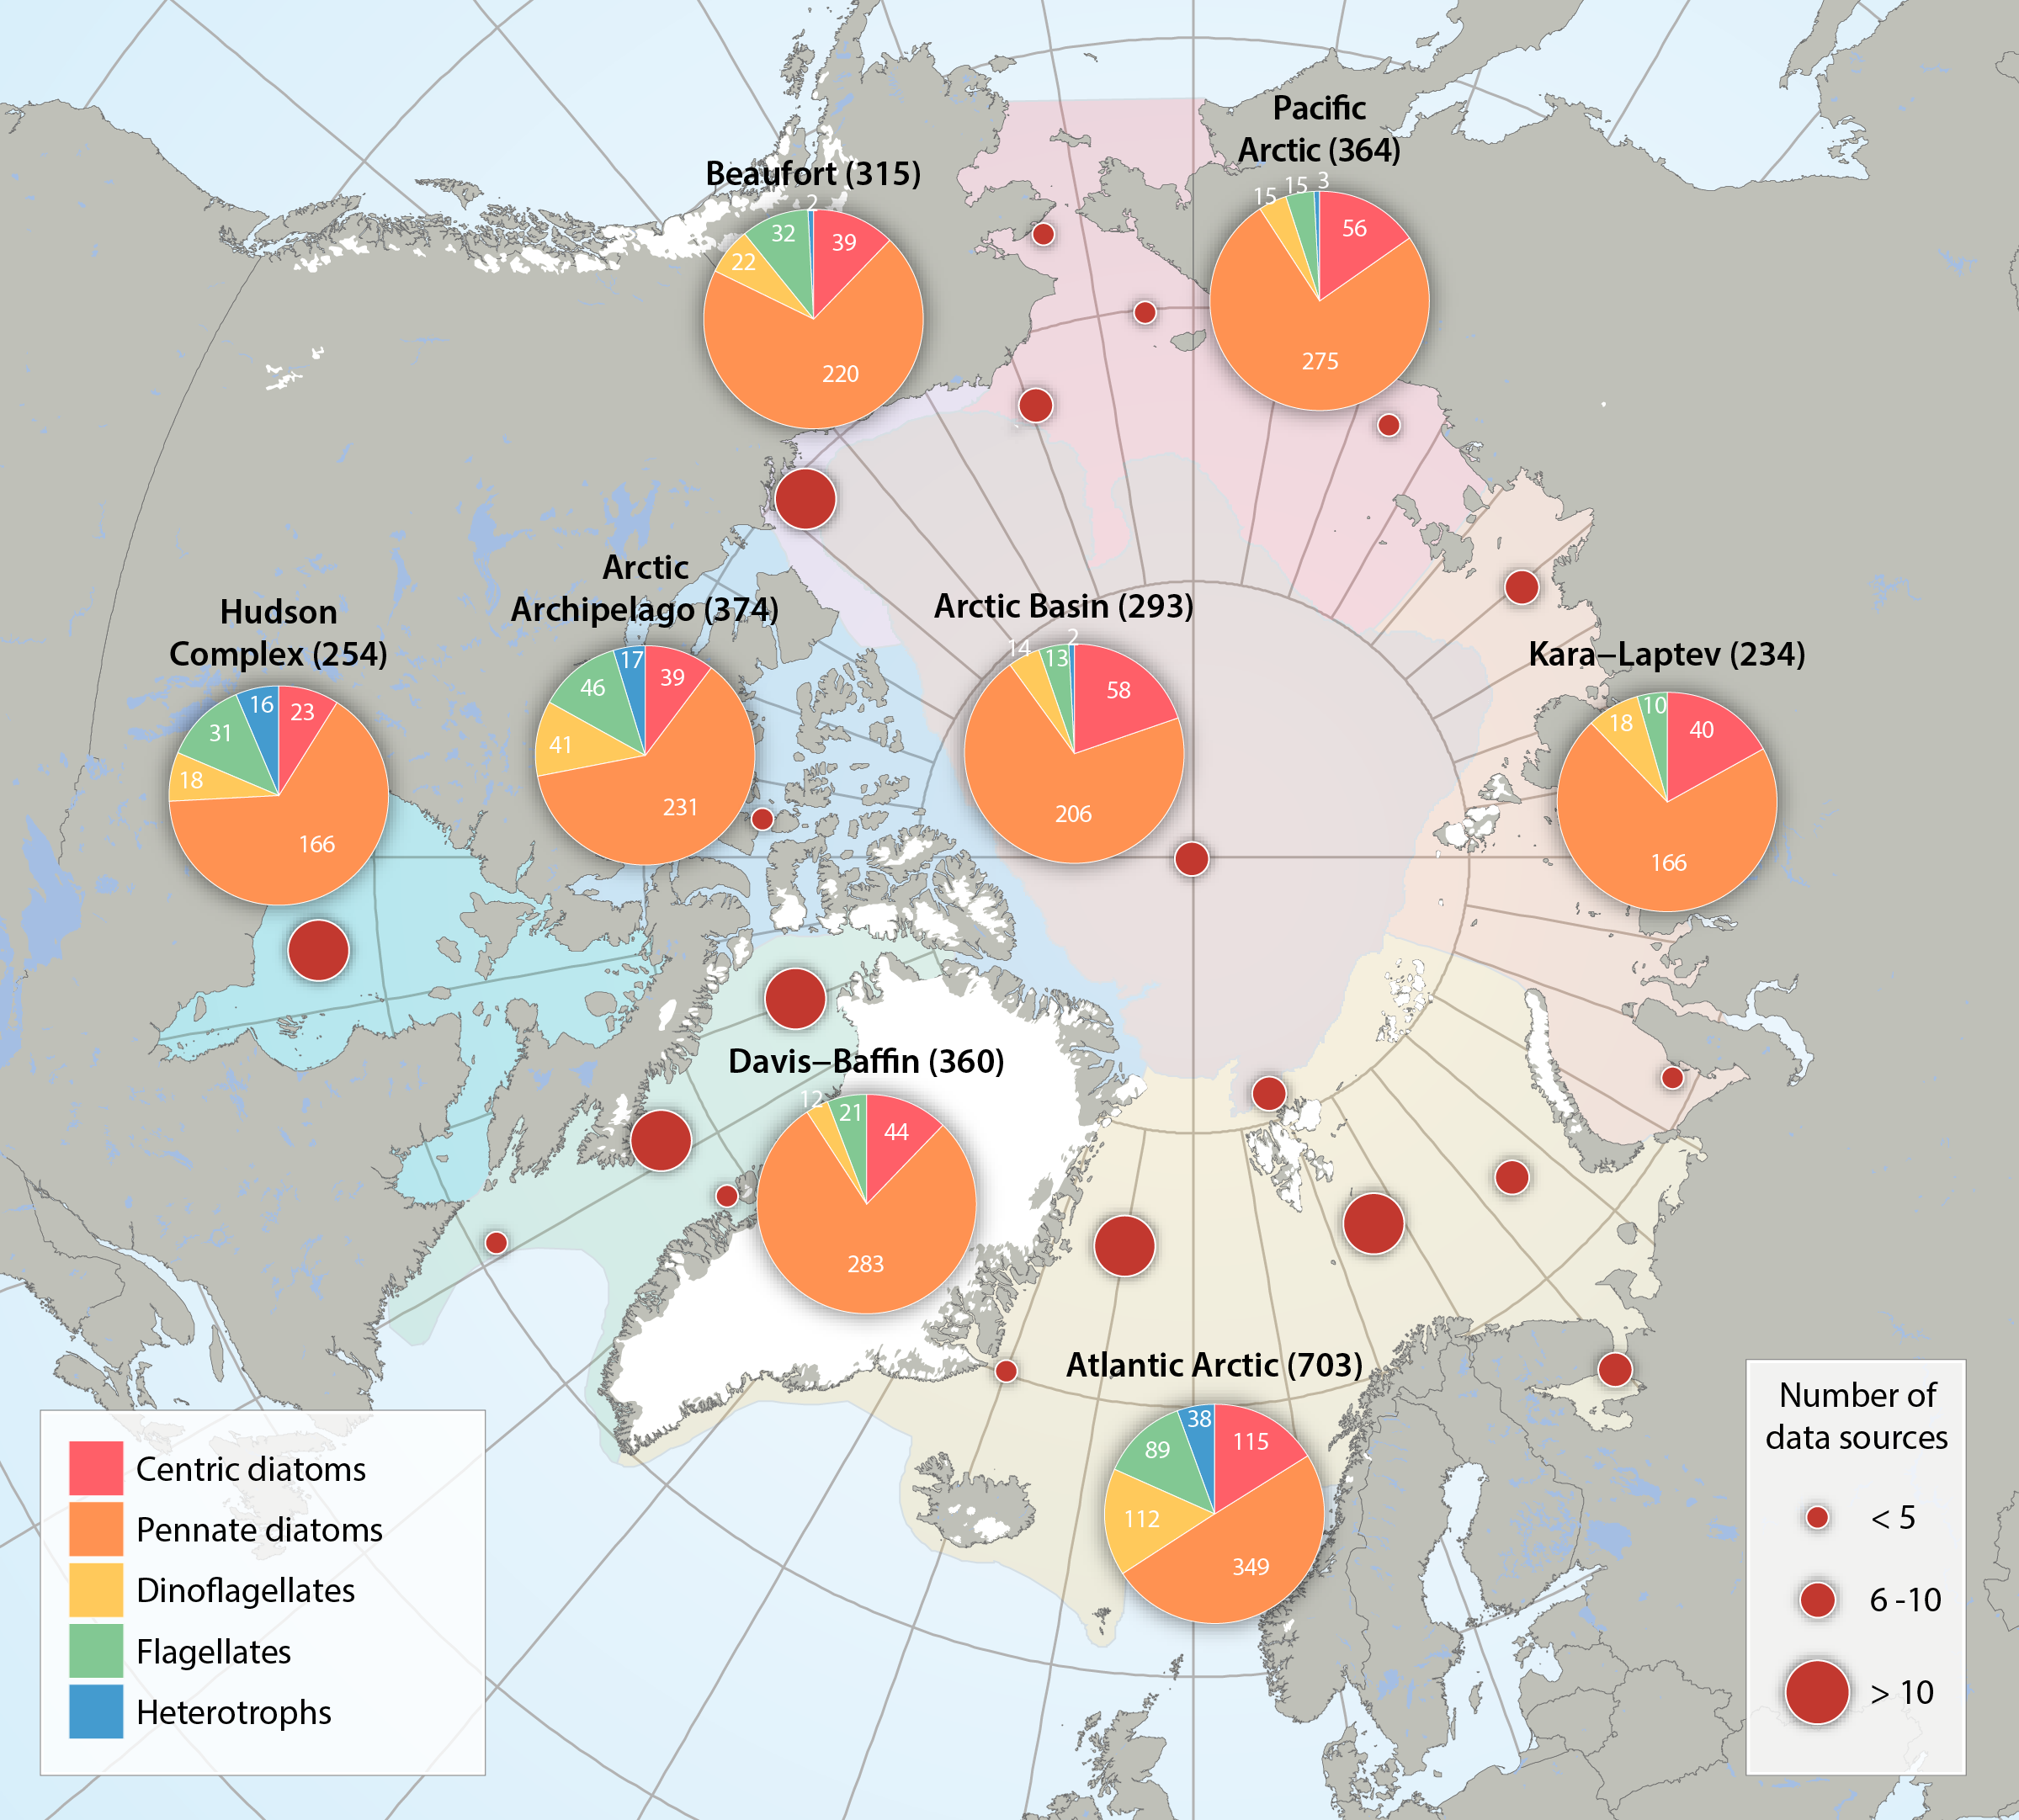
Numbers and taxonomic composition of five single-celled eukaryote groups for the regional divisions of the Arctic Marine Areas (pie charts), as well as the number of data sources reviewed across the Arctic (red circles). Total number of taxa is given in parenthesis after each region. Flagellates include: chlorophytes, chrysophytes, cryptophytes, dictyochophytes, euglenids, prasinophytes, prymnesiophytes, raphidophytes, synurales, and xanthophytes, and- for practical purposes though not flagellates - cyanophytes. Heterotrophs include: choanoflagellates, kinetoplastea, incertae sedis. Updated from Poulin et al. (2011). STATE OF THE ARCTIC MARINE BIODIVERSITY REPORT - <a href="https://arcticbiodiversity.is/findings/sea-ice-biota" target="_blank">Chapter 3</a> - Page 39- Figure 3.1.3 From the report draft: "For a pan-Arctic assessment of diversity (here defined as species richness), the first comprehensive assessments of this FEC from a few years ago (Poulin et al. 2011, Daniëls et al. 2013) have been updated for regions, with taxonomic names standardized according to the World Register of Marine Species (www.marinespecies.org). For the analysis of possible interannual trends in the ice algal community, we used a data set from the Central Arctic, the area most consistently and frequently sampled (Melnikov 2002, I. Melnikov, Shirshov Institute, unpubl. data). Multivariate community structure was analysed based on a presence-absence matrix of cores from 1980 to 2013. The analysis is biased by the varying numbers of analysed cores taken per year ranging widely from 1 to 24, ice thickness between 0.6 and 4.2 m, and including both first-year as well as multiyear sea ice. Locations included were in a bounding box within 74.9 to 90.0 °N and 179.9°W to 176.6°E and varied among years."
-
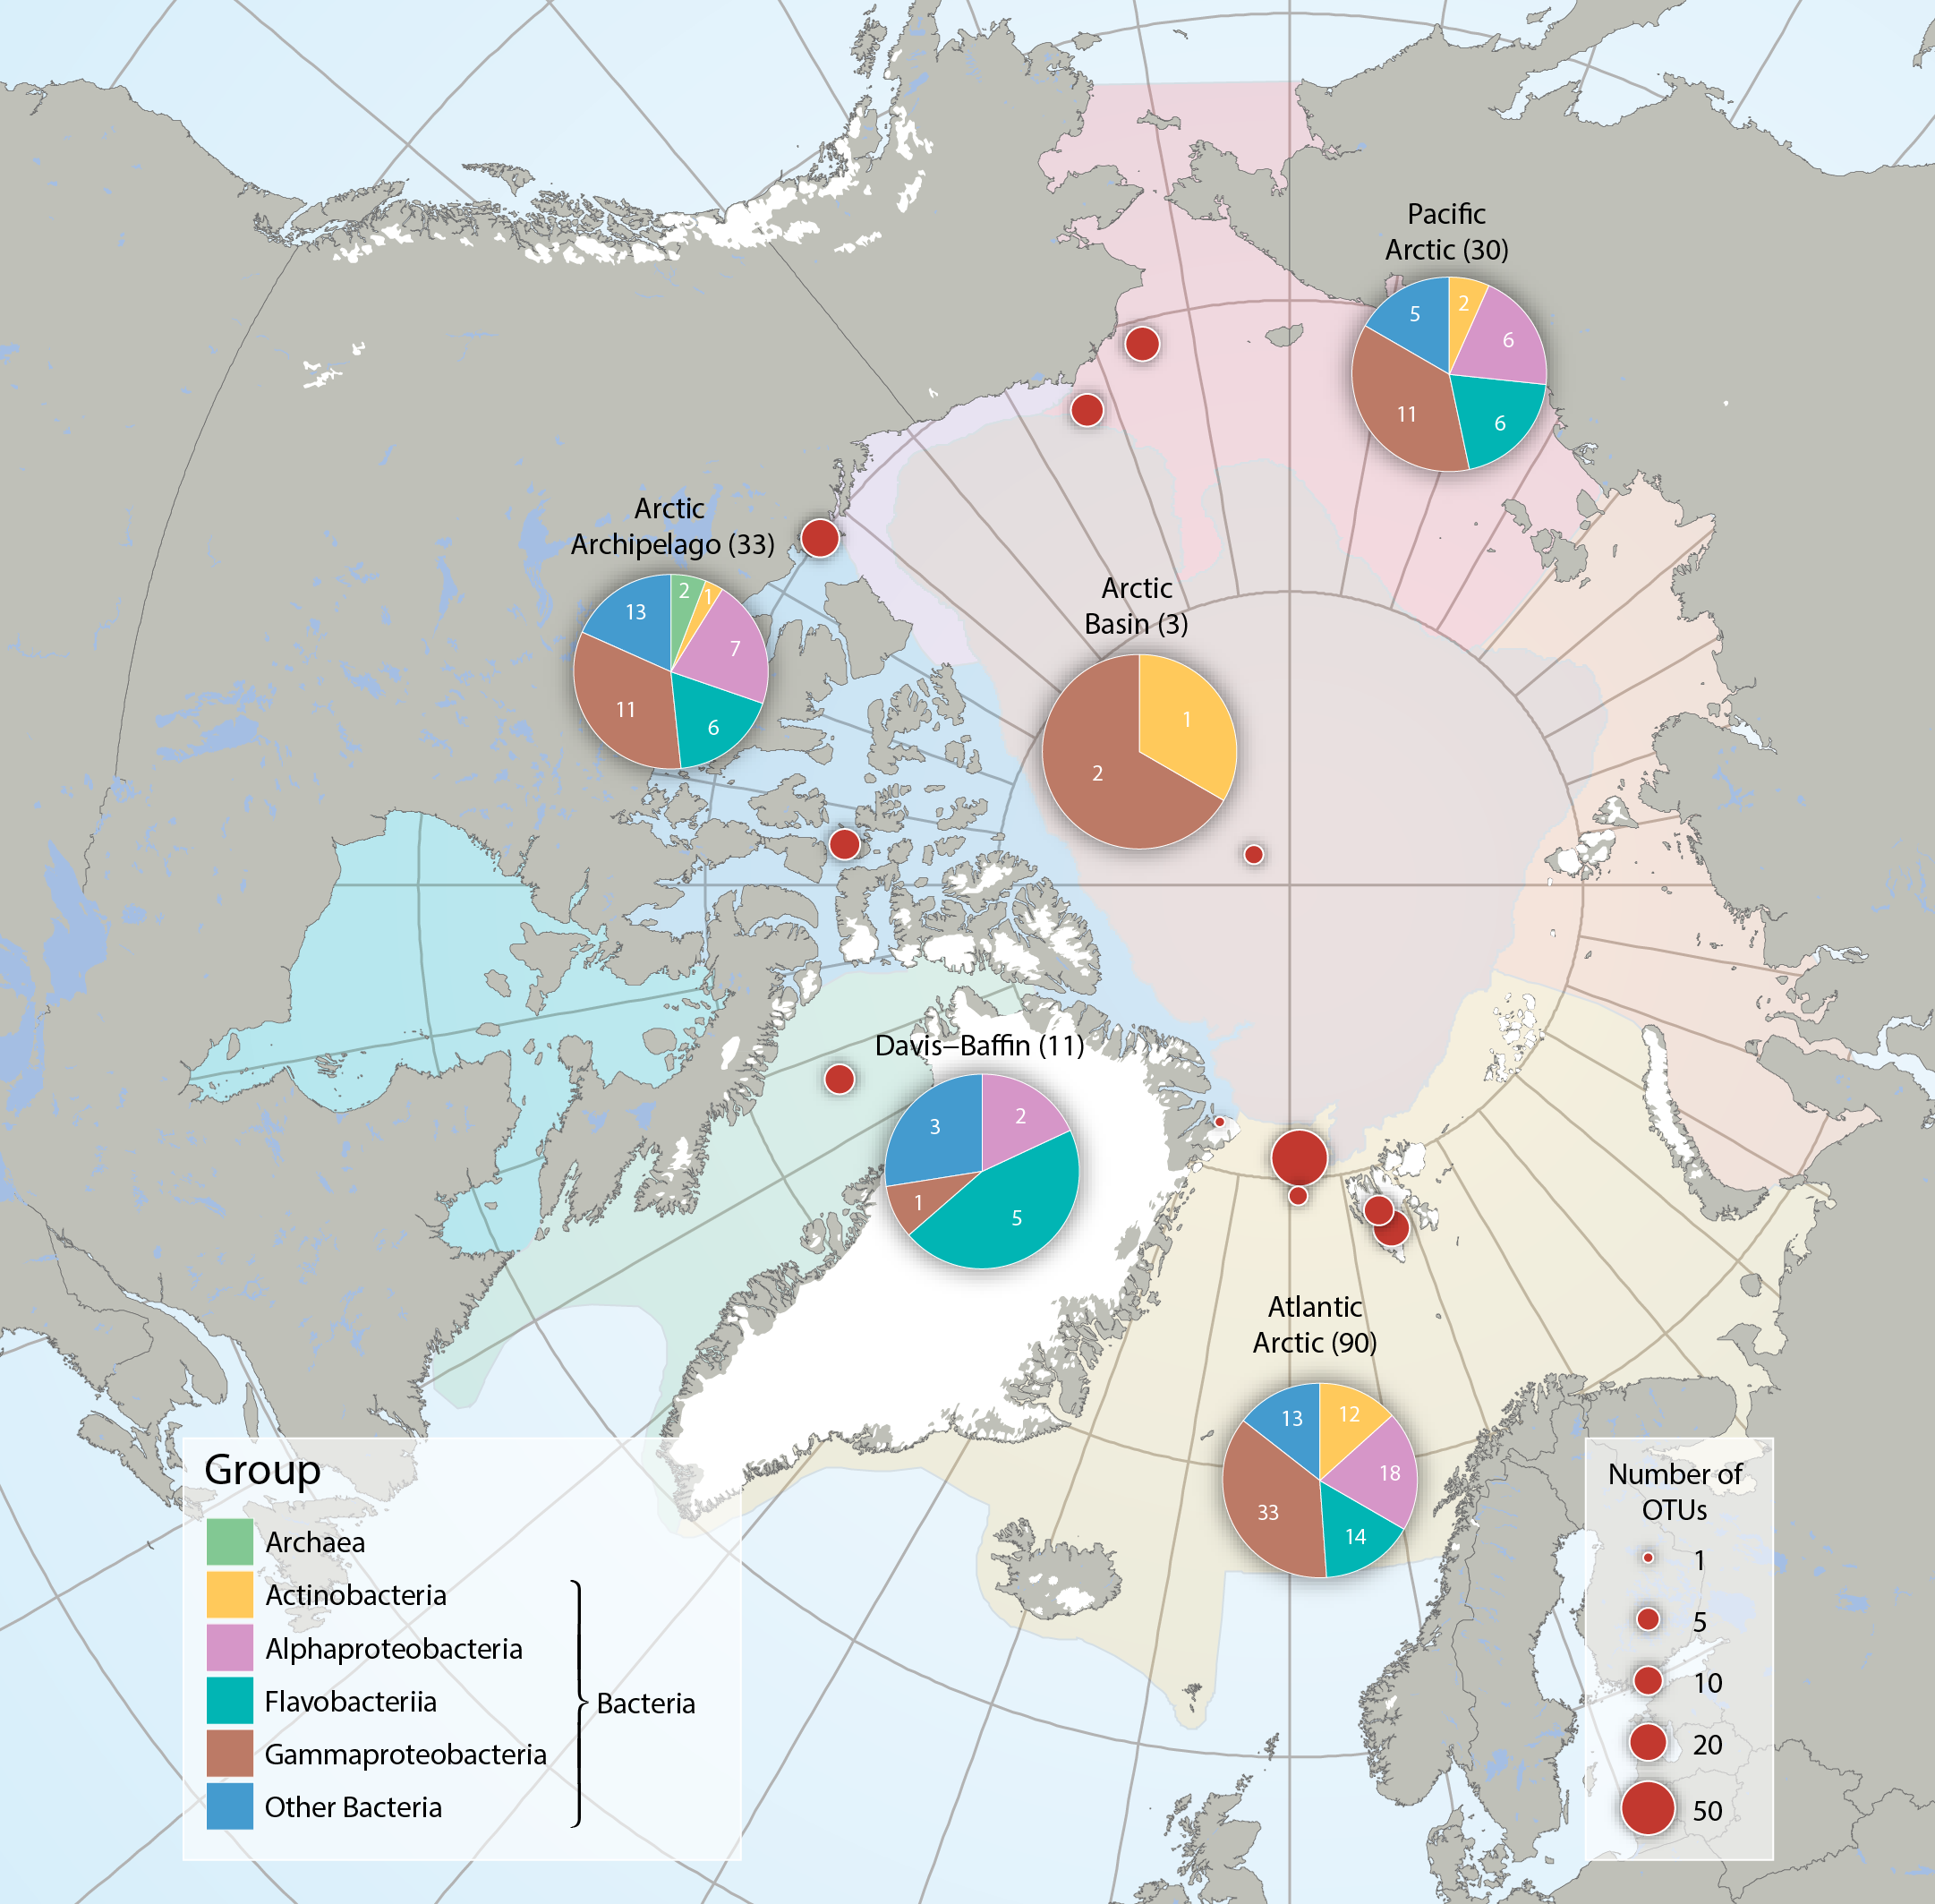
Bacteria and Archaea across five Arctic Marine Areas based on number of operational taxonomic units (OTUs), or molecular species. Composition of microbial groups, with respective numbers of OTUs (pie charts) and number of OTUs at sampling locations (red dots). Data aggregated by the CBMP Sea Ice Biota Expert Network. Data source: National Center for Biotechnology Information’s (NCBI 2017) Nucleotide and PubMed databases. STATE OF THE ARCTIC MARINE BIODIVERSITY REPORT - <a href="https://arcticbiodiversity.is/findings/sea-ice-biota" target="_blank">Chapter 3</a> - Page 38 - Figure 3.1.2 From the report draft: "Synthesis of available data was performed by using searches conducted in the National Center for Biotechnology Information’s “Nucleotide” (http://www.ncbi.nlm.nih.gov/guide/data-software/) and “PubMed” (http://www.ncbi.nlm.nih.gov/pubmed) databases. Aligned DNA sequences were downloaded and clustered into OTUs by maximum likelihood phylogenetic placement."
-
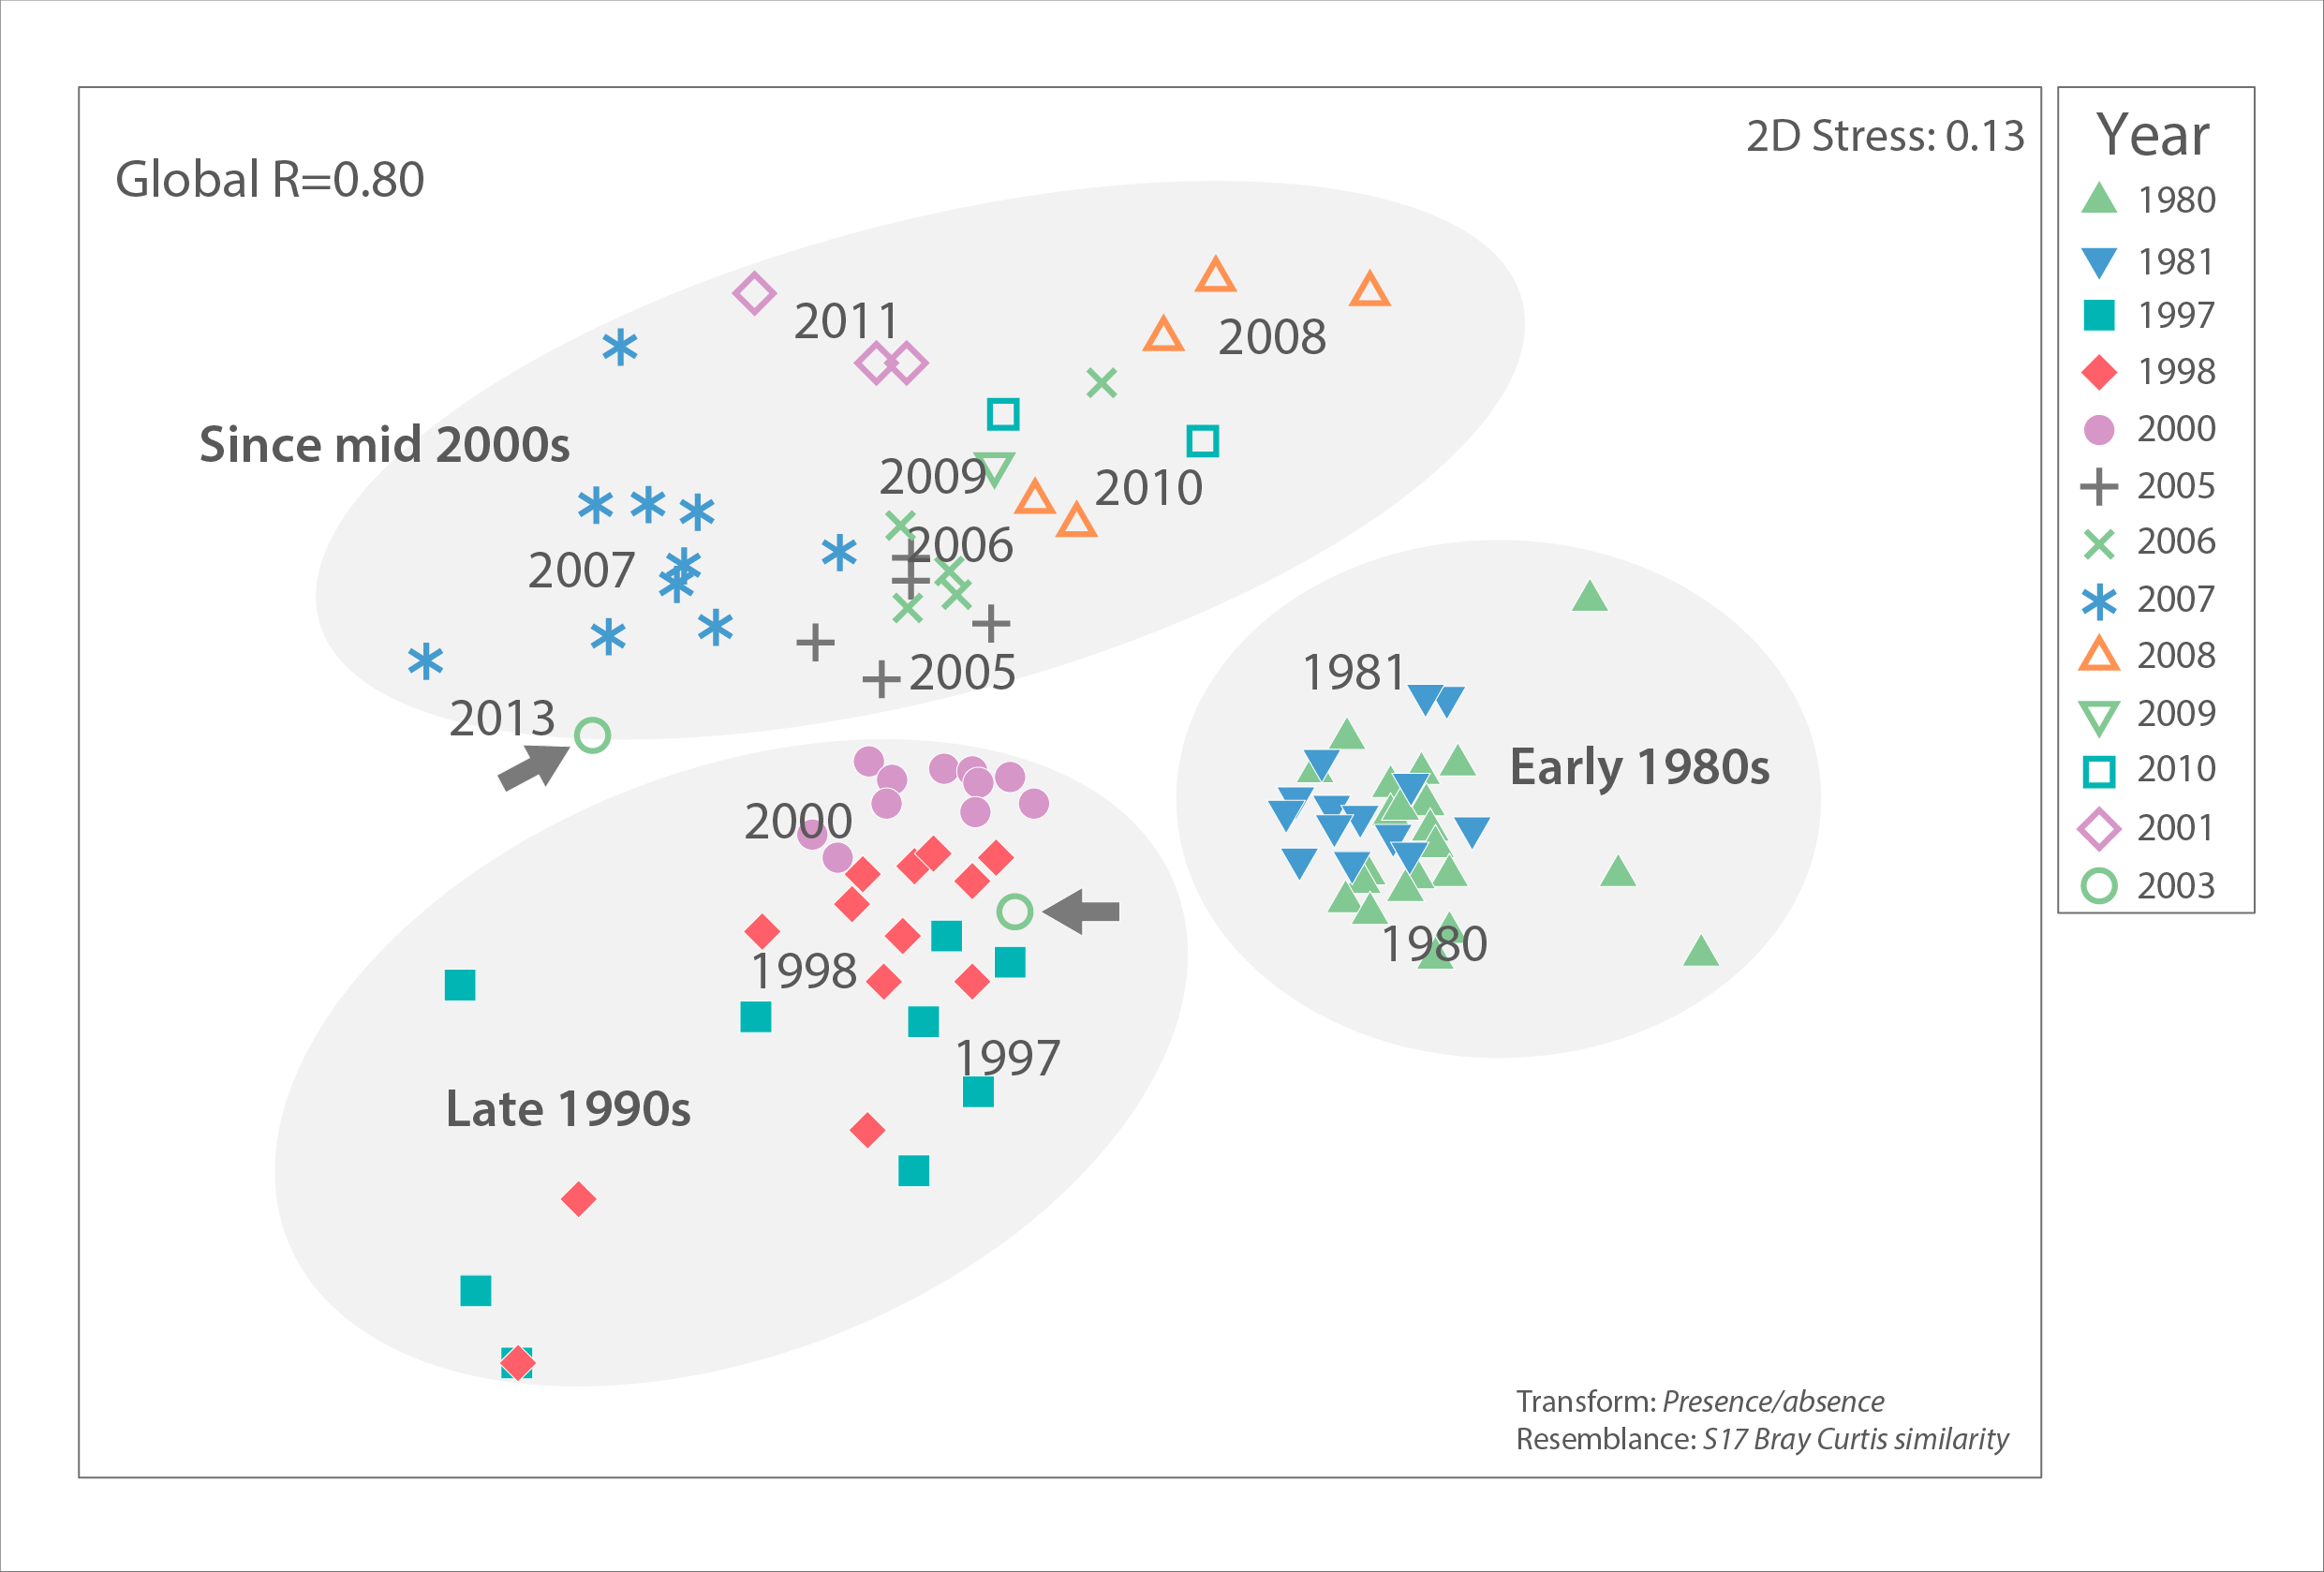
Ice algal community similarity of central Russian Arctic drifting stations from the 1980s to 2010s based on unpublished data by I.A. Melnikov, Shirshov Institute of Oceanology. The closer two samples (symbols) are to each other in this multi-dimensional scaling plot, the more similar their algal communities were, based on presence/absence of algal species. Samples from the same year tend to be similar and group together on the plot, with some exceptions. Dispersion across the plot suggests that community structure has changed over the decades, although sampling locations in the central Arctic have also shifted, thus introducing bias. An analysis of similarity (PRIMER version 6) with a high Global R=0.80 indicates strong community difference among decades (global R=0 indicates no difference, R=1 indicates complete dissimilarity). Regional differences were low (global R=0.26) and difference by ice type moderate (global R=0.38). Grey arrows point to the very different and only two samples from 2013. STATE OF THE ARCTIC MARINE BIODIVERSITY REPORT - <a href="https://arcticbiodiversity.is/findings/sea-ice-biota" target="_blank">Chapter 3</a> - Page 47 - Figure 3.1.8 "For the analysis of possible interannual trends in the ice algal community, we used a data set from the Central Arctic, the area most consistently and frequently sampled (Melnikov 2002, I. Melnikov, Shirshov Institute, unpubl. data). Multivariate community structure was analysed based on a presence-absence matrix of cores from 1980 to 2013. The analysis is biased by the varying numbers of analysed cores taken per year ranging widely from 1 to 24, ice thickness between 0.6 and 4.2 m, and including both first-year as well as multiyear sea ice. Locations included were in a bounding box within 74.9 to 90.0 °N and 179.9°W to 176.6°E and varied among years."
-
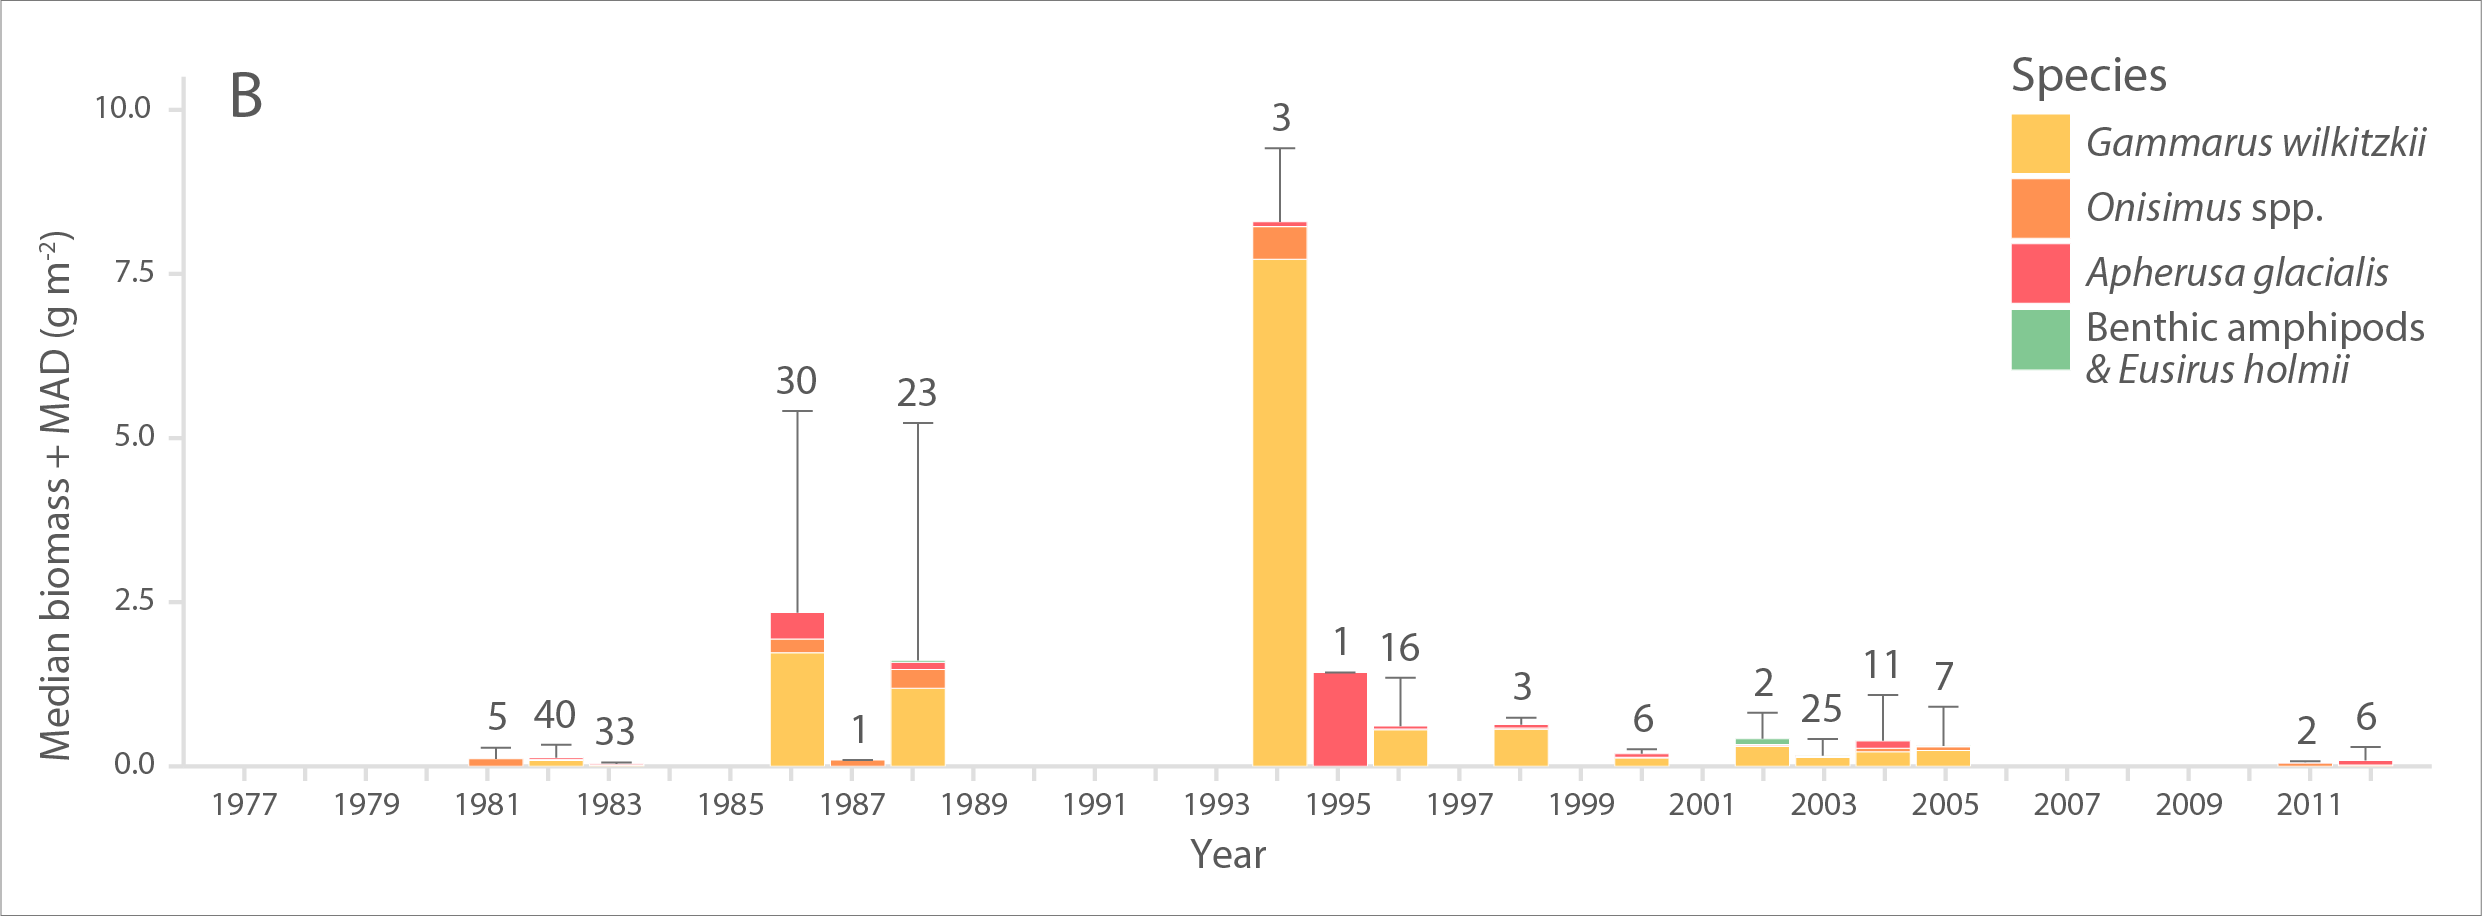
Multi-decadal time series of A) abundance (individuals m-2) and B) biomass (g wet weight m-2) of ice amphipods from 1977 to 2012 across the Arctic. Bars and error bars indicate median and median absolute deviation (MAD) values for each year, respectively. Numbers above bars represent number of sampling efforts (n). Modified from Hop et al. (2013). STATE OF THE ARCTIC MARINE BIODIVERSITY REPORT - <a href="https://arcticbiodiversity.is/findings/sea-ice-biota" target="_blank">Chapter 3</a> - Page 45 - Figure 3.1.7 From the report draft: "The only available time-series of sympagic biota is based on composite data of ice-amphipod abundance and biomass estimates from the 1980s to present across the Arctic, with most observations from the Svalbard and Fram Strait region (Hop et al. 2013). Samples were obtained by SCUBA divers who collected amphipods quantitatively with electrical suction pumps under the sea ice (Lønne & Gulliksen 1991a, b, Hop & Pavlova 2008)."
-
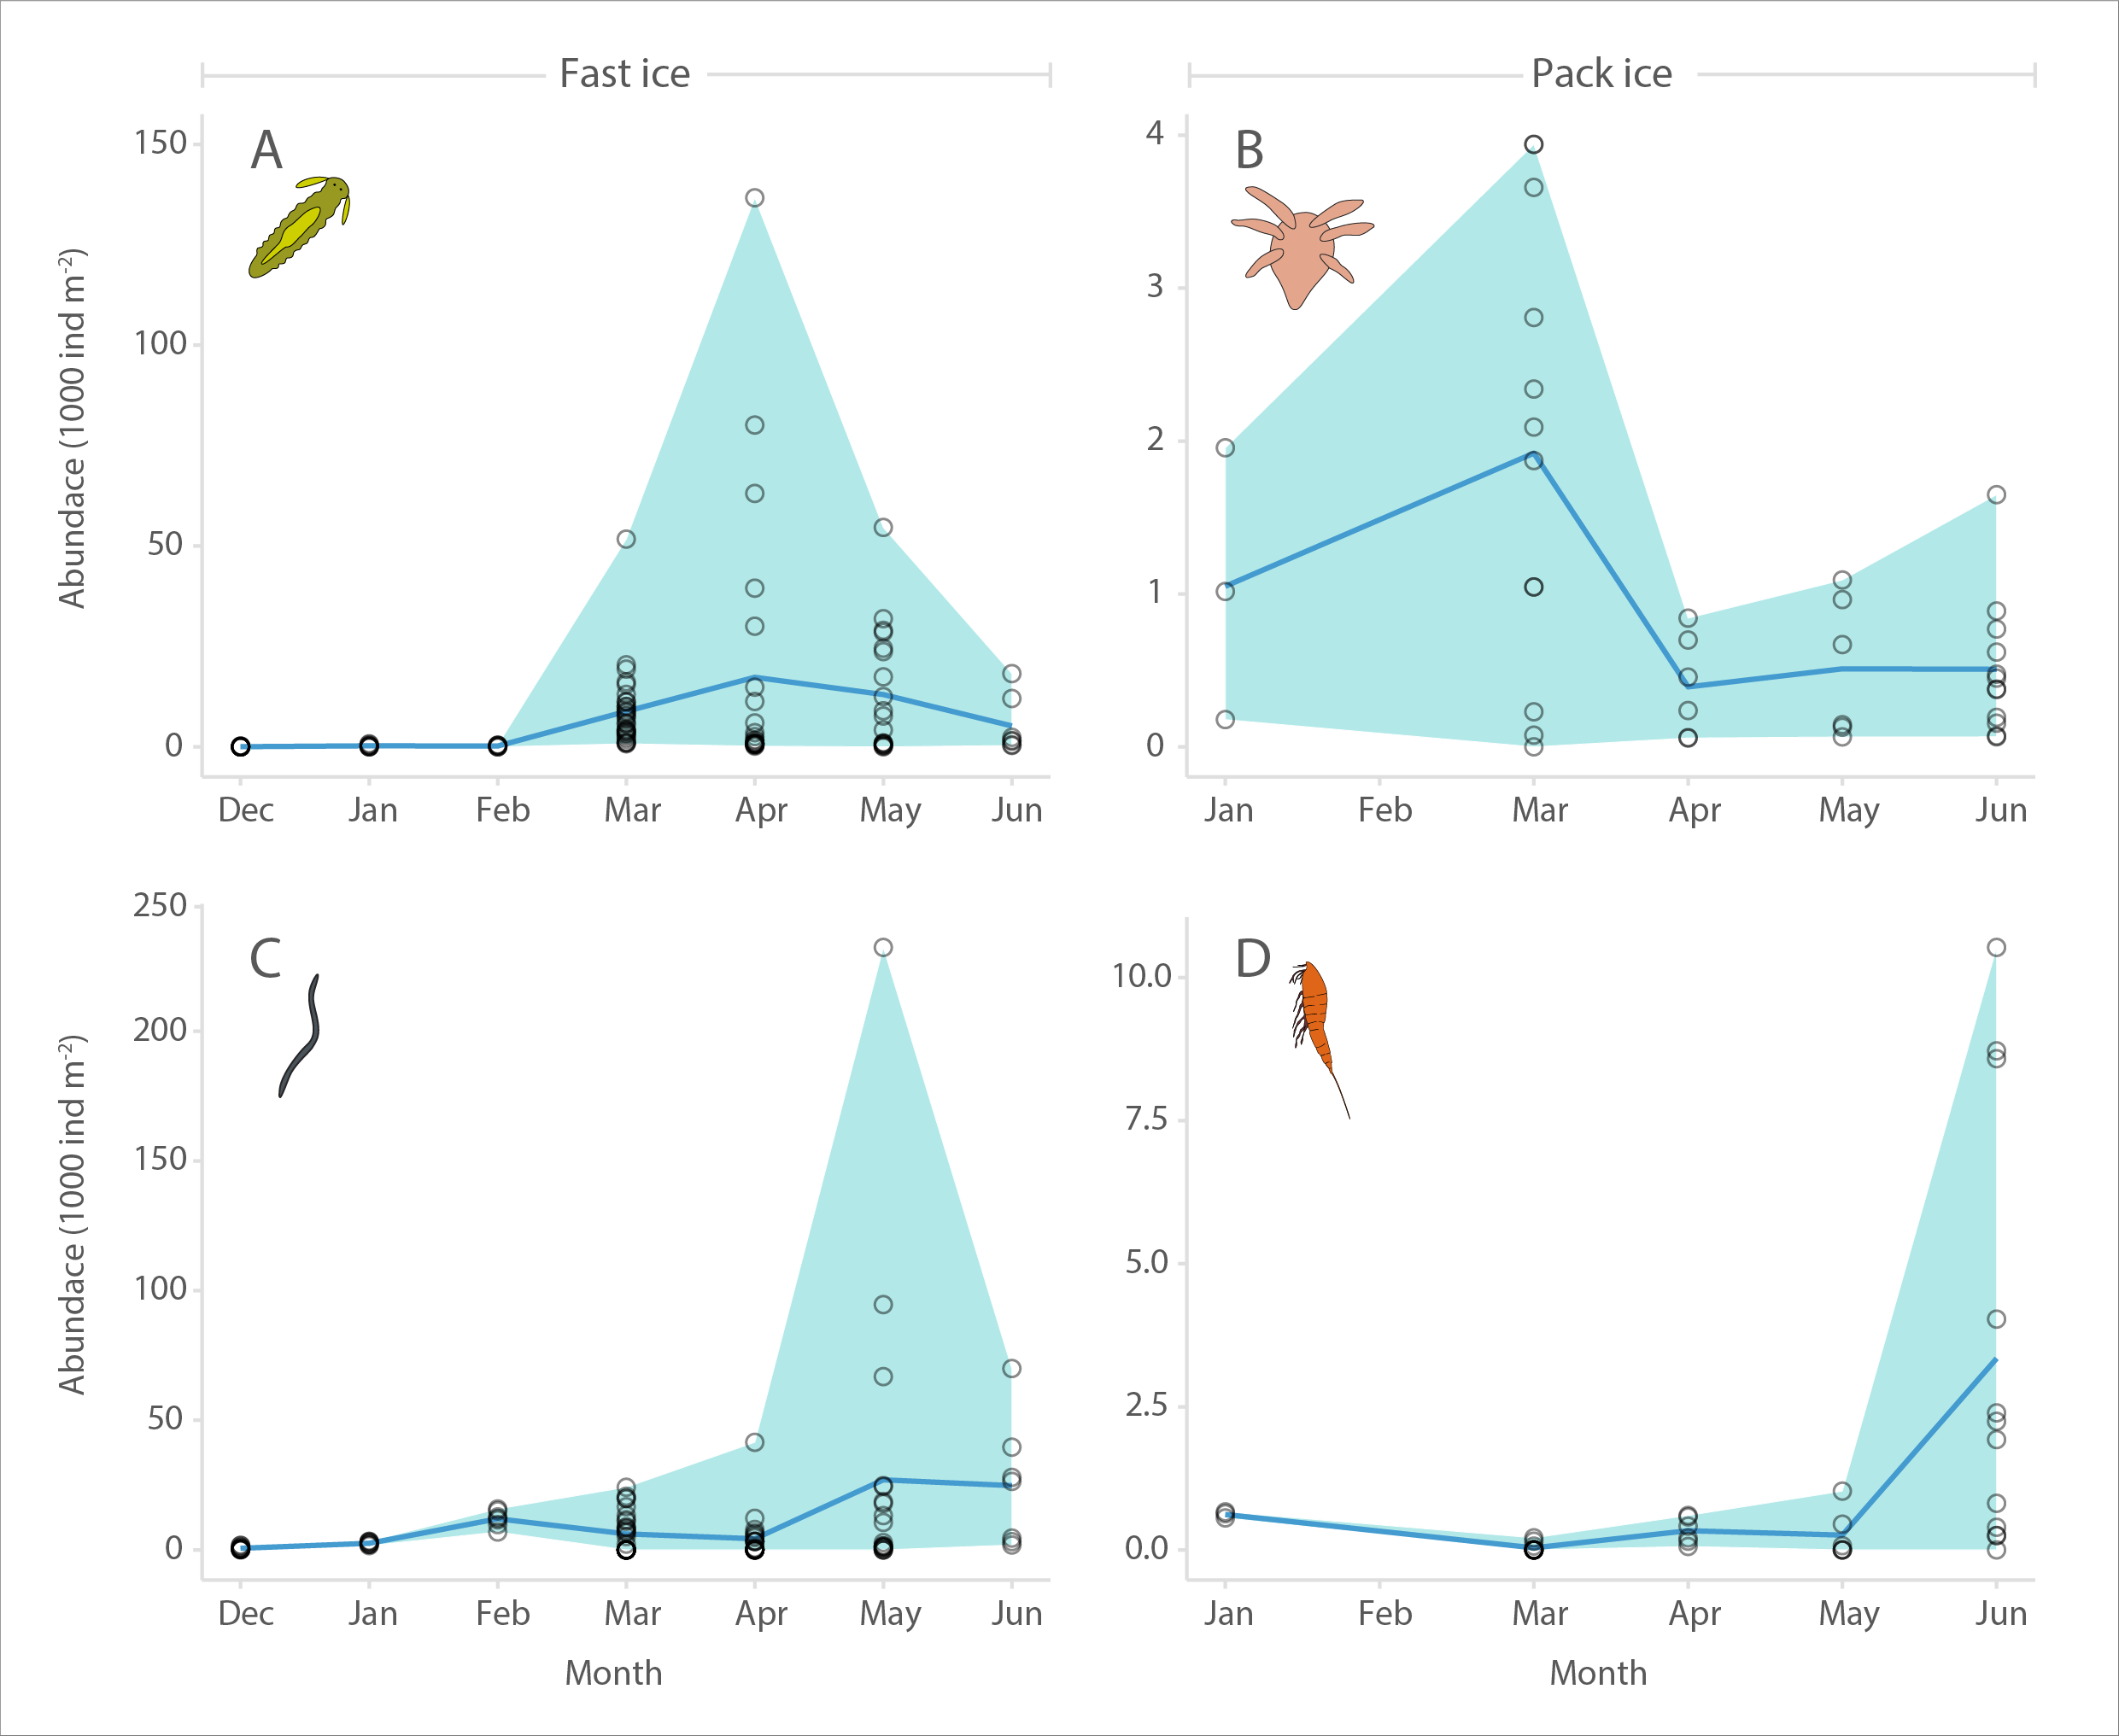
Seasonal abundance (1000 individuals m- 2) of sea ice meiofauna at landfast sea ice (Barrow, 2005-2006, A and C) and pack ice (North of Svalbard, 2015, B and D). A and B show larval stages (polychaete juveniles and nauplii, respectively), while C and D show nematodes and harpacticoid copepods, respectively. Circles represent individual cores (n = 107 for A and C, and 39 for B and D), shading the extent of minimum as well as maximum values, and blue line indicates mean values. STATE OF THE ARCTIC MARINE BIODIVERSITY REPORT - <a href="https://arcticbiodiversity.is/findings/sea-ice-biota" target="_blank">Chapter 3</a> - Page 43 - Figure 3.1.5 From the report draft: "In addition to showing composition and peak abundance ranges, we illustrate the phenology of ice meiofauna over the ice-covered season in the entire combined data set. For this purpose, the data were normalized to the daylight hours at each location during the date of sampling using R package geosphere (Hijmans 2015) and a method described in Forsythe et al. (1995). This was necessary, because ‘spring’ arrives earlier at lower latitudes than at higher latitudes, so that using month or day of year would obscure the pan-Arctic integration of the data. Other influential factors such as snow depth, ice thickness and nutrient concentrations were not accounted for in this analysis."