 Arctic Biodiversity Data Service - ABDS Catalog
trend
Type of resources
Available actions
Topics
Keywords
Contact for the resource
Provided by
Representation types
Update frequencies
status
-
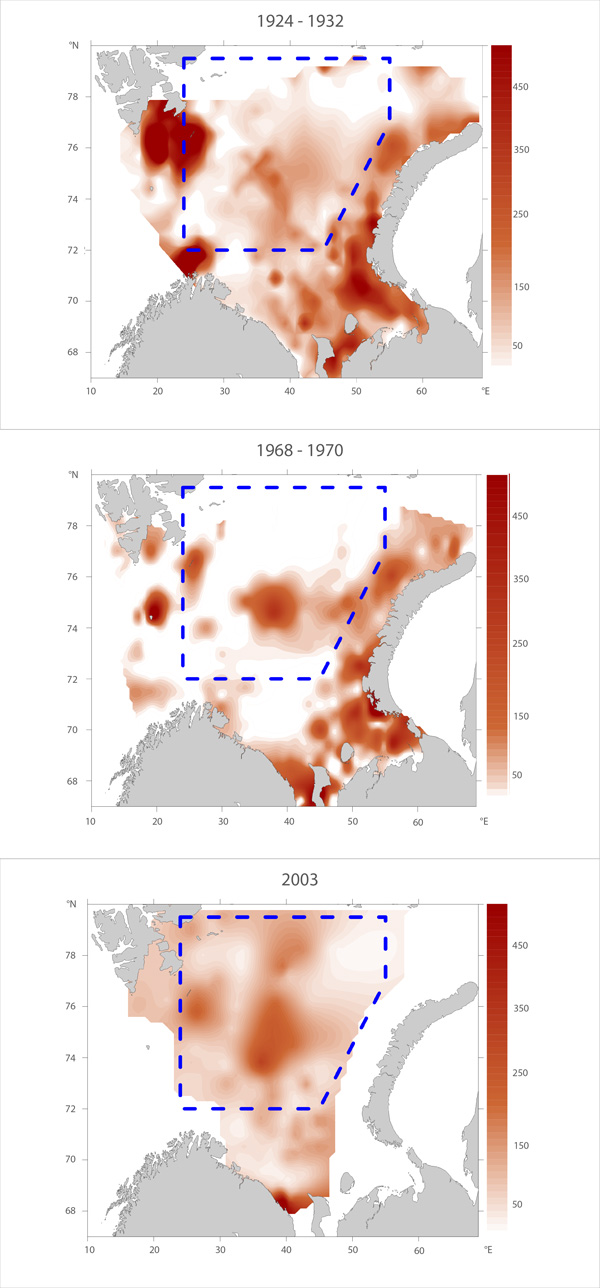
Macrofauna distribution of biomass (g wet fixed weight m-2) in the Barents Sea over three time periods: 1924-32 (Figure A), 1968-70 (Figure B) and 2003 (Figure C, constructed from original archive data, except for area south of 72° N where digitized megafaunal-data taken from Anisimova et al. (2010) was used. Adapted from Denisenko (2013). Blue boxes delineate the areas within which the zoobenthos biomass values were compared. STATE OF THE ARCTIC MARINE BIODIVERSITY REPORT - <a href="https://arcticbiodiversity.is/findings/benthos" target="_blank">Chapter 3</a> - Page 96- Figure 3.3.3
-
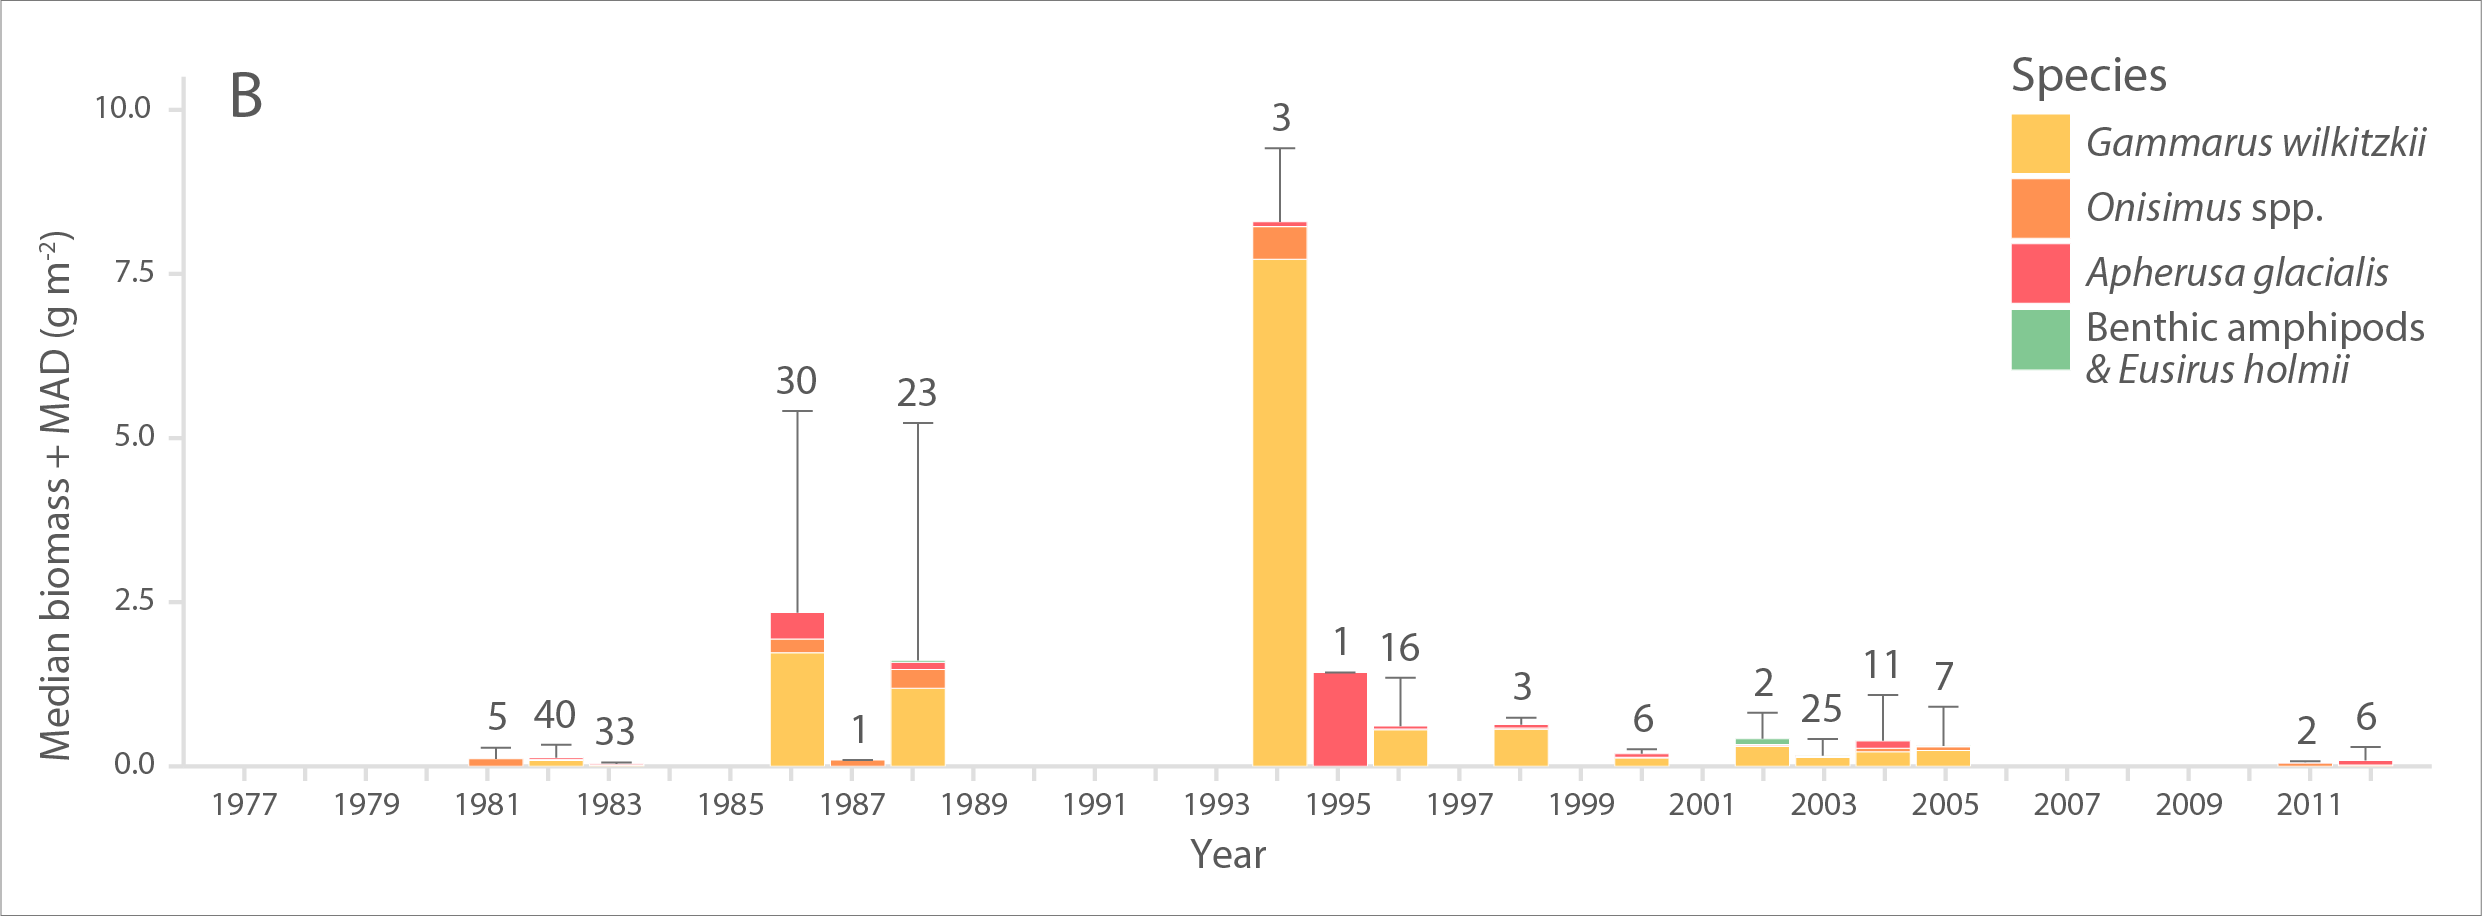
Multi-decadal time series of A) abundance (individuals m-2) and B) biomass (g wet weight m-2) of ice amphipods from 1977 to 2012 across the Arctic. Bars and error bars indicate median and median absolute deviation (MAD) values for each year, respectively. Numbers above bars represent number of sampling efforts (n). Modified from Hop et al. (2013). STATE OF THE ARCTIC MARINE BIODIVERSITY REPORT - <a href="https://arcticbiodiversity.is/findings/sea-ice-biota" target="_blank">Chapter 3</a> - Page 45 - Figure 3.1.7 From the report draft: "The only available time-series of sympagic biota is based on composite data of ice-amphipod abundance and biomass estimates from the 1980s to present across the Arctic, with most observations from the Svalbard and Fram Strait region (Hop et al. 2013). Samples were obtained by SCUBA divers who collected amphipods quantitatively with electrical suction pumps under the sea ice (Lønne & Gulliksen 1991a, b, Hop & Pavlova 2008)."