SAMBR - Macrofauna
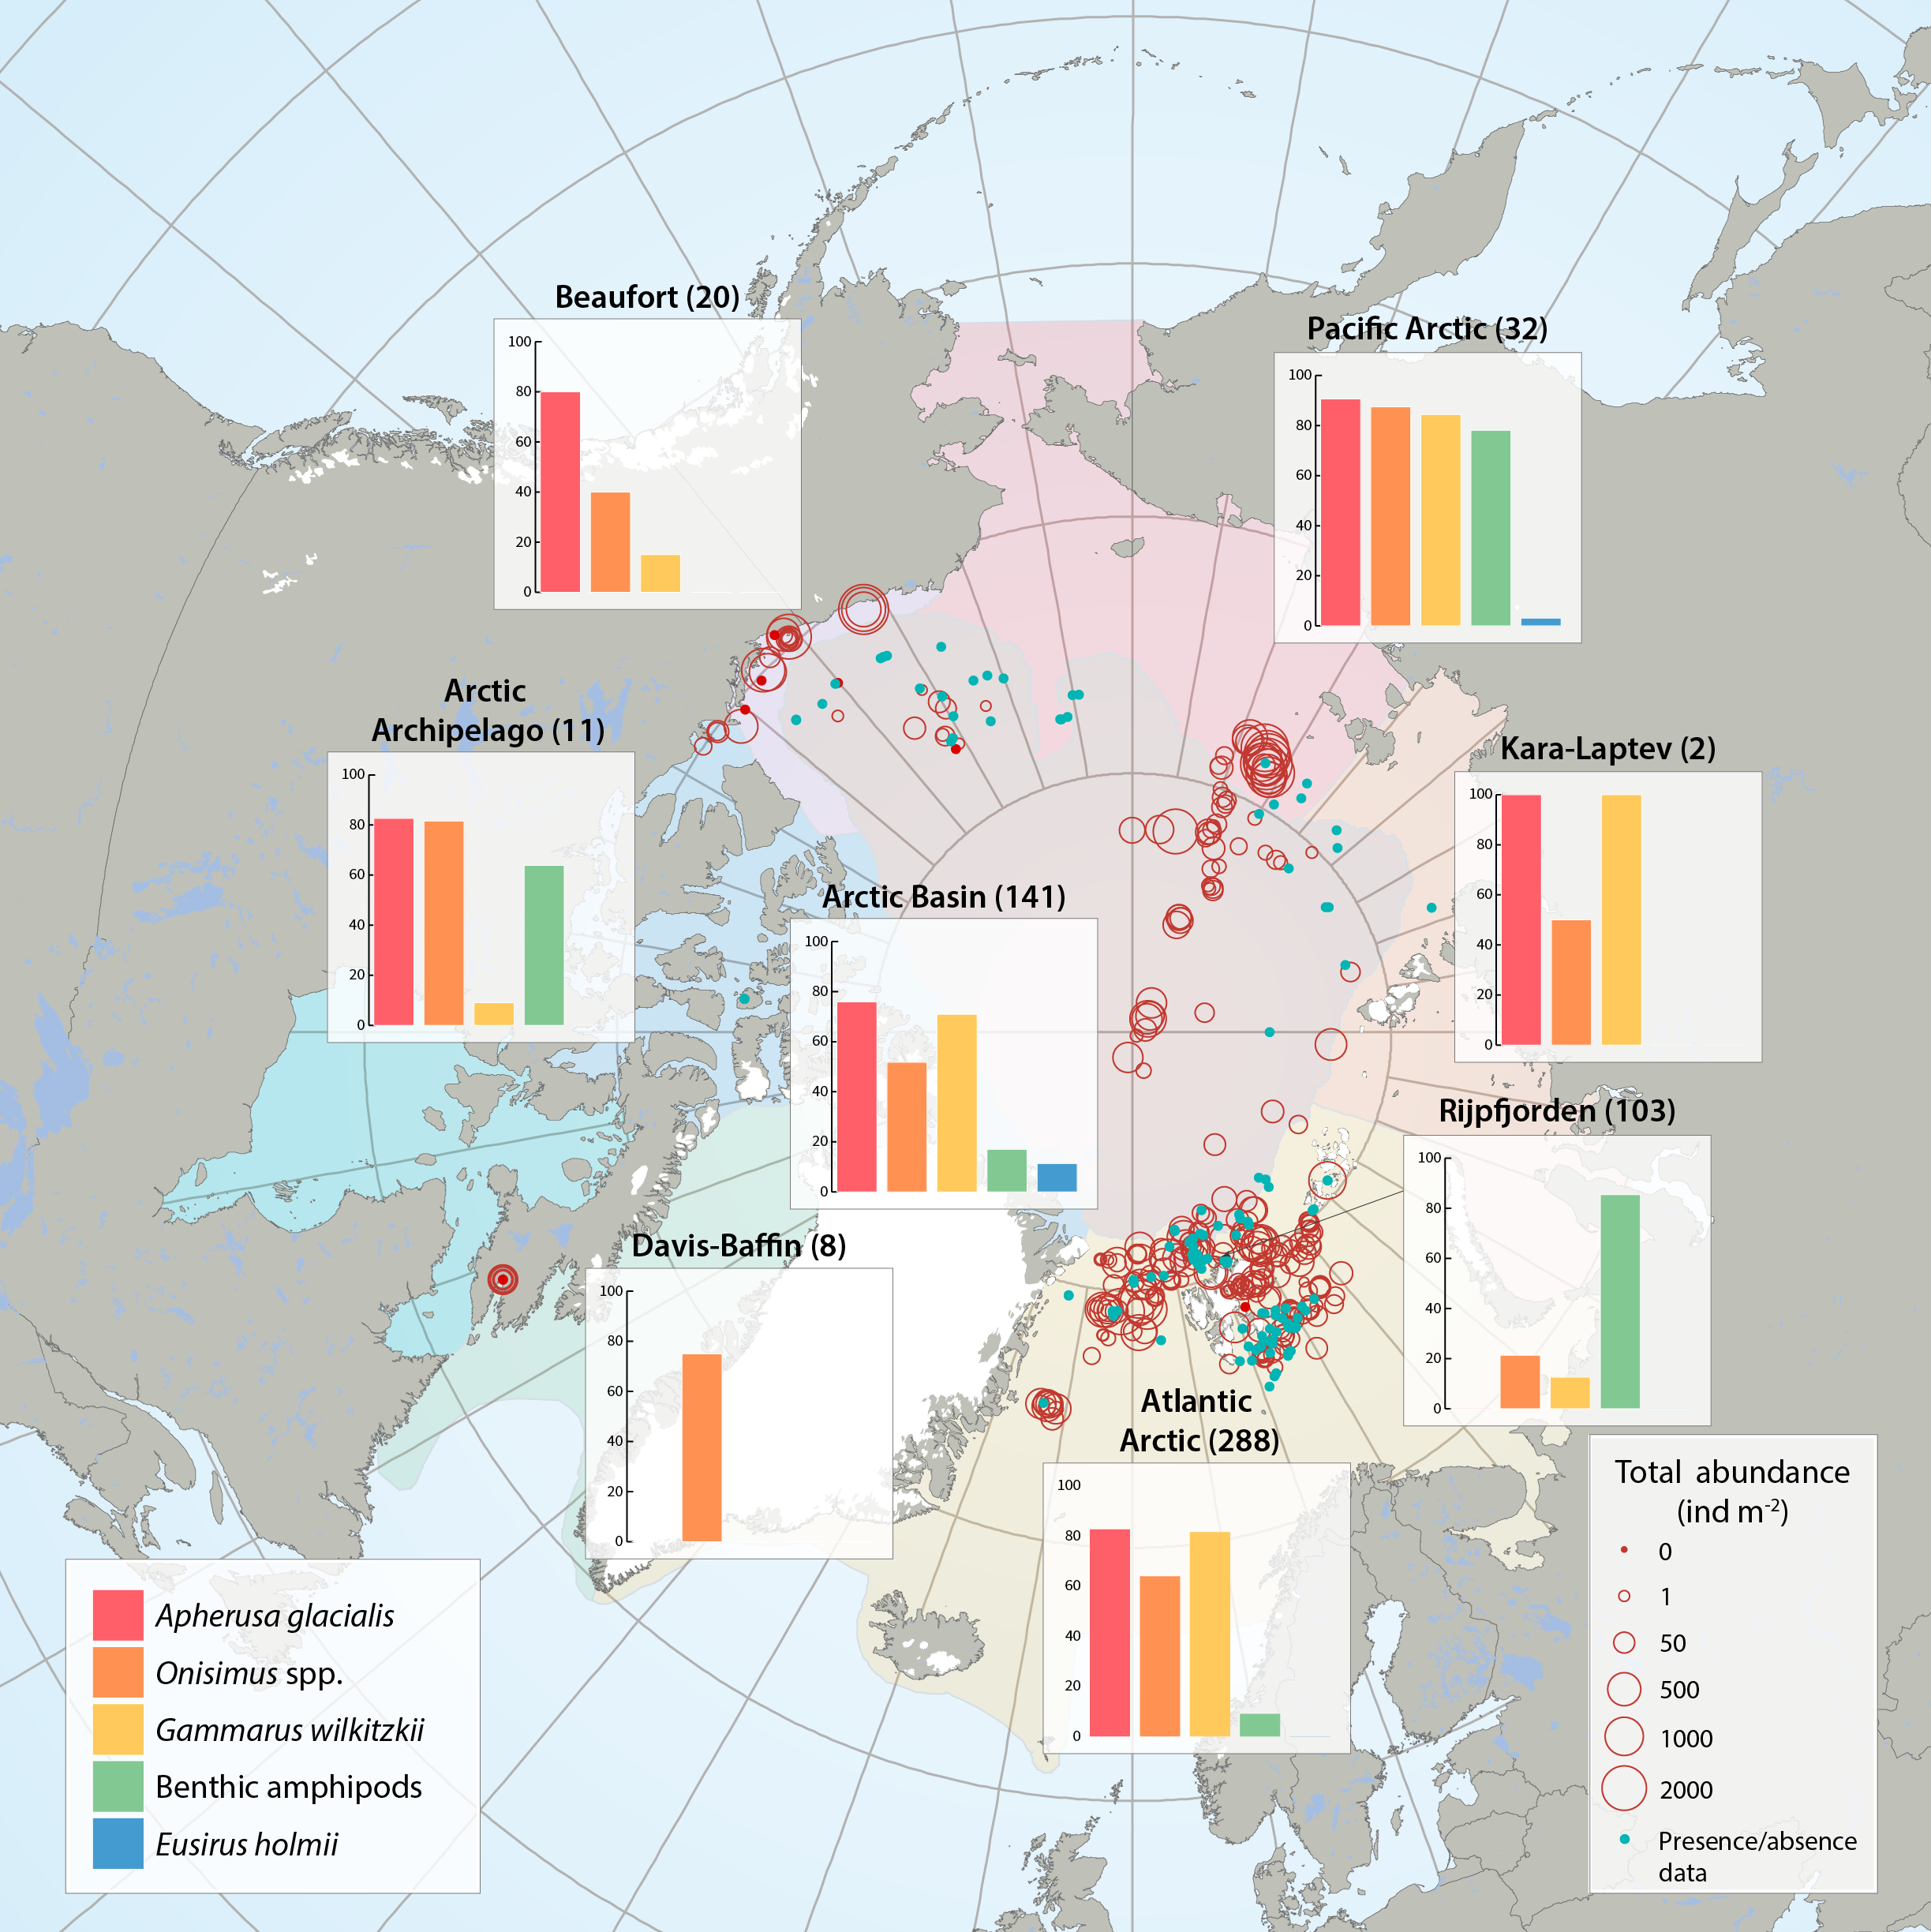
Sea ice amphipod (macrofauna) distribution and abundance across the Arctic aggregated from 47 sources between 1977 and 2012 by the CBMP Sea Ice Biota Expert Network. Bar graphs illustrate the frequency of occurrence (%) of amphipods in samples that contained at least one ice-associated amphipod. Red circles illustrate the total abundances of all ice-associated amphipods in quantitative samples (individuals m-2) at locations of sampling for each Arctic Marine Area (AMA). Number of sampling efforts for each region is given in parenthesis after region name. Blue dots represent samples where only presence/ absence data were available and where amphipods were present.
STATE OF THE ARCTIC MARINE BIODIVERSITY REPORT - <a href="https://arcticbiodiversity.is/findings/sea-ice-biota" target="_blank">Chapter 3</a> - Page 44 - Figure 3.1.6
From the report draft: "This summary includes 47 data sources of under-ice amphipods published between 1977 and 2012. When available, we collected information on abundance or density (ind. m-2, or ind. m-3 that were converted to ind. m-2) and biomass (g m-2, wet weight). If abundance or biomass data were not available, we examined presence/relative abundance information. Frequency of occurrence was calculated for regions across the Arctic using integrated data for all available years."
Simple
- Date (Publication)
- 2017-05
- Status
- Completed
http://caff.is
- Hours of service
- 08:00 - 16:00 GMT
- Maintenance and update frequency
- Unknown
- Theme
-
- SAMBR
- Ice amphipods
- Amphipoda
- Seaicebiota
- Place
-
- CHAPTER3
- Access constraints
- Copyright
- Use constraints
- otherRestictions
- Spatial representation type
- Vector
- Metadata language
- English
- Character set
- UTF8
- Topic category
-
- Oceans
- Begin date
- 1977-03-06
- End date
- 2012-01-08
))
- Supplemental Information
- Sea ice amphipod distribution and abundance across Arctic extracted from 47 sources between 1977 and 2012. Bar-graphs illustrate the frequency of occurrence of amphipods in samples that contained at least one ice-associated amphipod. 100% is indicated with black outlines. Red circles illustrate the total abundances of all iceassociated amphipods in quantitative samples (ind. m-2) at locations of sampling and black polygons outline the limits for each region. Number of sampling efforts for each region is given in parenthesis after the region name. Blue dots represent samples where only presence/absence data were available. See Appendix 3.2 for data sources.
- Reference system identifier
- WGS 1984
- Protocol
- WWW:LINK-1.0-http--link
- Protocol
- OGC:WMS-1.1.1-http-get-map
- OnLine resource
-
fig_3_1_6.png
(
WWW:DOWNLOAD-1.0-http--download
)
Image
- OnLine resource
-
6 Macrofauna data map.xlsx
(
WWW:DOWNLOAD-1.0-http--download
)
Exel data file
- OnLine resource
-
6 Macrofauna references.xlsx
(
WWW:DOWNLOAD-1.0-http--download
)
Excel references file
- OnLine resource
-
C3_01f6_macrofauna_data_blue_dots
(
OGC:WMS-1.3.0-http-get-map
)
C3_01f6_macrofauna_data_blue_dots
- OnLine resource
-
C3_01f6_macrofauna_data_red_dots
(
OGC:WMS-1.3.0-http-get-map
)
C3_01f6_macrofauna_data_red_dots
- OnLine resource
-
Norwegian Polar Institute data archive
(
WWW:LINK-1.0-http--link
)
The dataset will be updated and placed on Norwegian Polar Institute data archive. Old dataset can be found here.
- Hierarchy level
- Dataset
Conformance result
- Date (Publication)
- File identifier
- 4dc5ea32-fa8a-4c37-b875-9908bc8642f8 XML
- Metadata language
- English
- Character set
- UTF8
- Date stamp
- 2023-02-13T14:01:01
- Metadata standard name
- ISO 19115:2003/19139
- Metadata standard version
- 1.0
Overviews

Spatial extent
))
Provided by

 CAFF - Arctic Biodiversity Data Service (ABDS)