 Arctic Biodiversity Data Service - ABDS Catalog

Type of resources
Available actions
Topics
Keywords
Contact for the resource
Provided by
Years
Formats
Representation types
Update frequencies
status
Service types
Scale
-
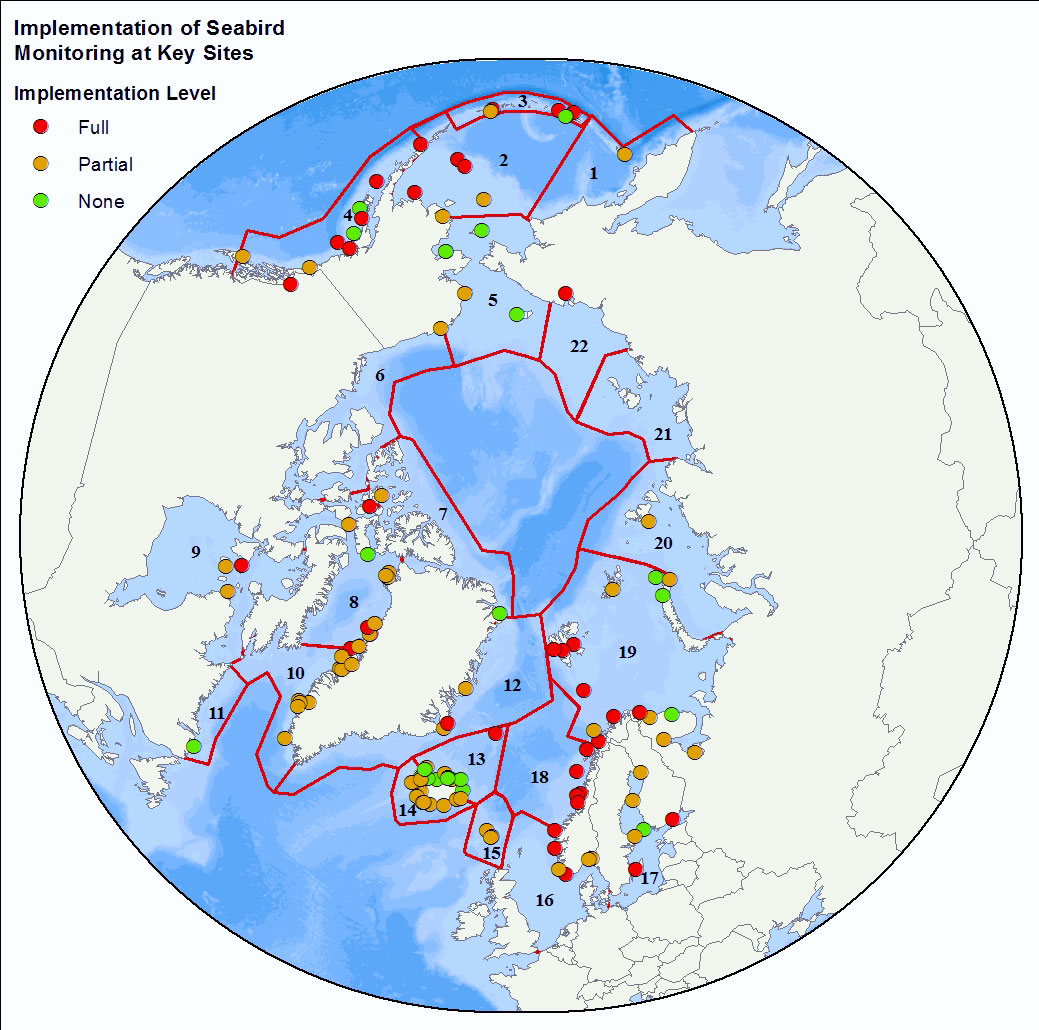
<img width="80px" height="67px" alt="logo" align="left" hspace="10px" src="http://geo.abds.is/geonetwork/srv/eng//resources.get?uuid=7d8986b1-fbd1-4e1a-a7c8-a4cef13e8eca&fname=cbird.png">The Circumpolar Seabird Monitoring Plan is designed to 1) monitor populations of selected Arctic seabird species, in one or more Arctic countries; 2) monitor, as appropriate, survival, diets, breeding phenology, and productivity of seabirds in a manner that allows changes to be detected; 3) provide circumpolar information on the status of seabirds to the management agencies of Arctic countries, in order to broaden their knowledge beyond the boundaries of their country thereby allowing management decisions to be made based on the best available information; 4) inform the public through outreach mechanisms as appropriate; 5) provide information on changes in the marine ecosystem by using seabirds as indicators; and 6) quickly identify areas or issue in the Arctic ecosystem such as declining biodiversity or environmental pressures to target further research and plan management and conservation measures. - <a href="http://caff.is" target="_blank"> Circumpolar Seabird Monitoring plan </a>
-
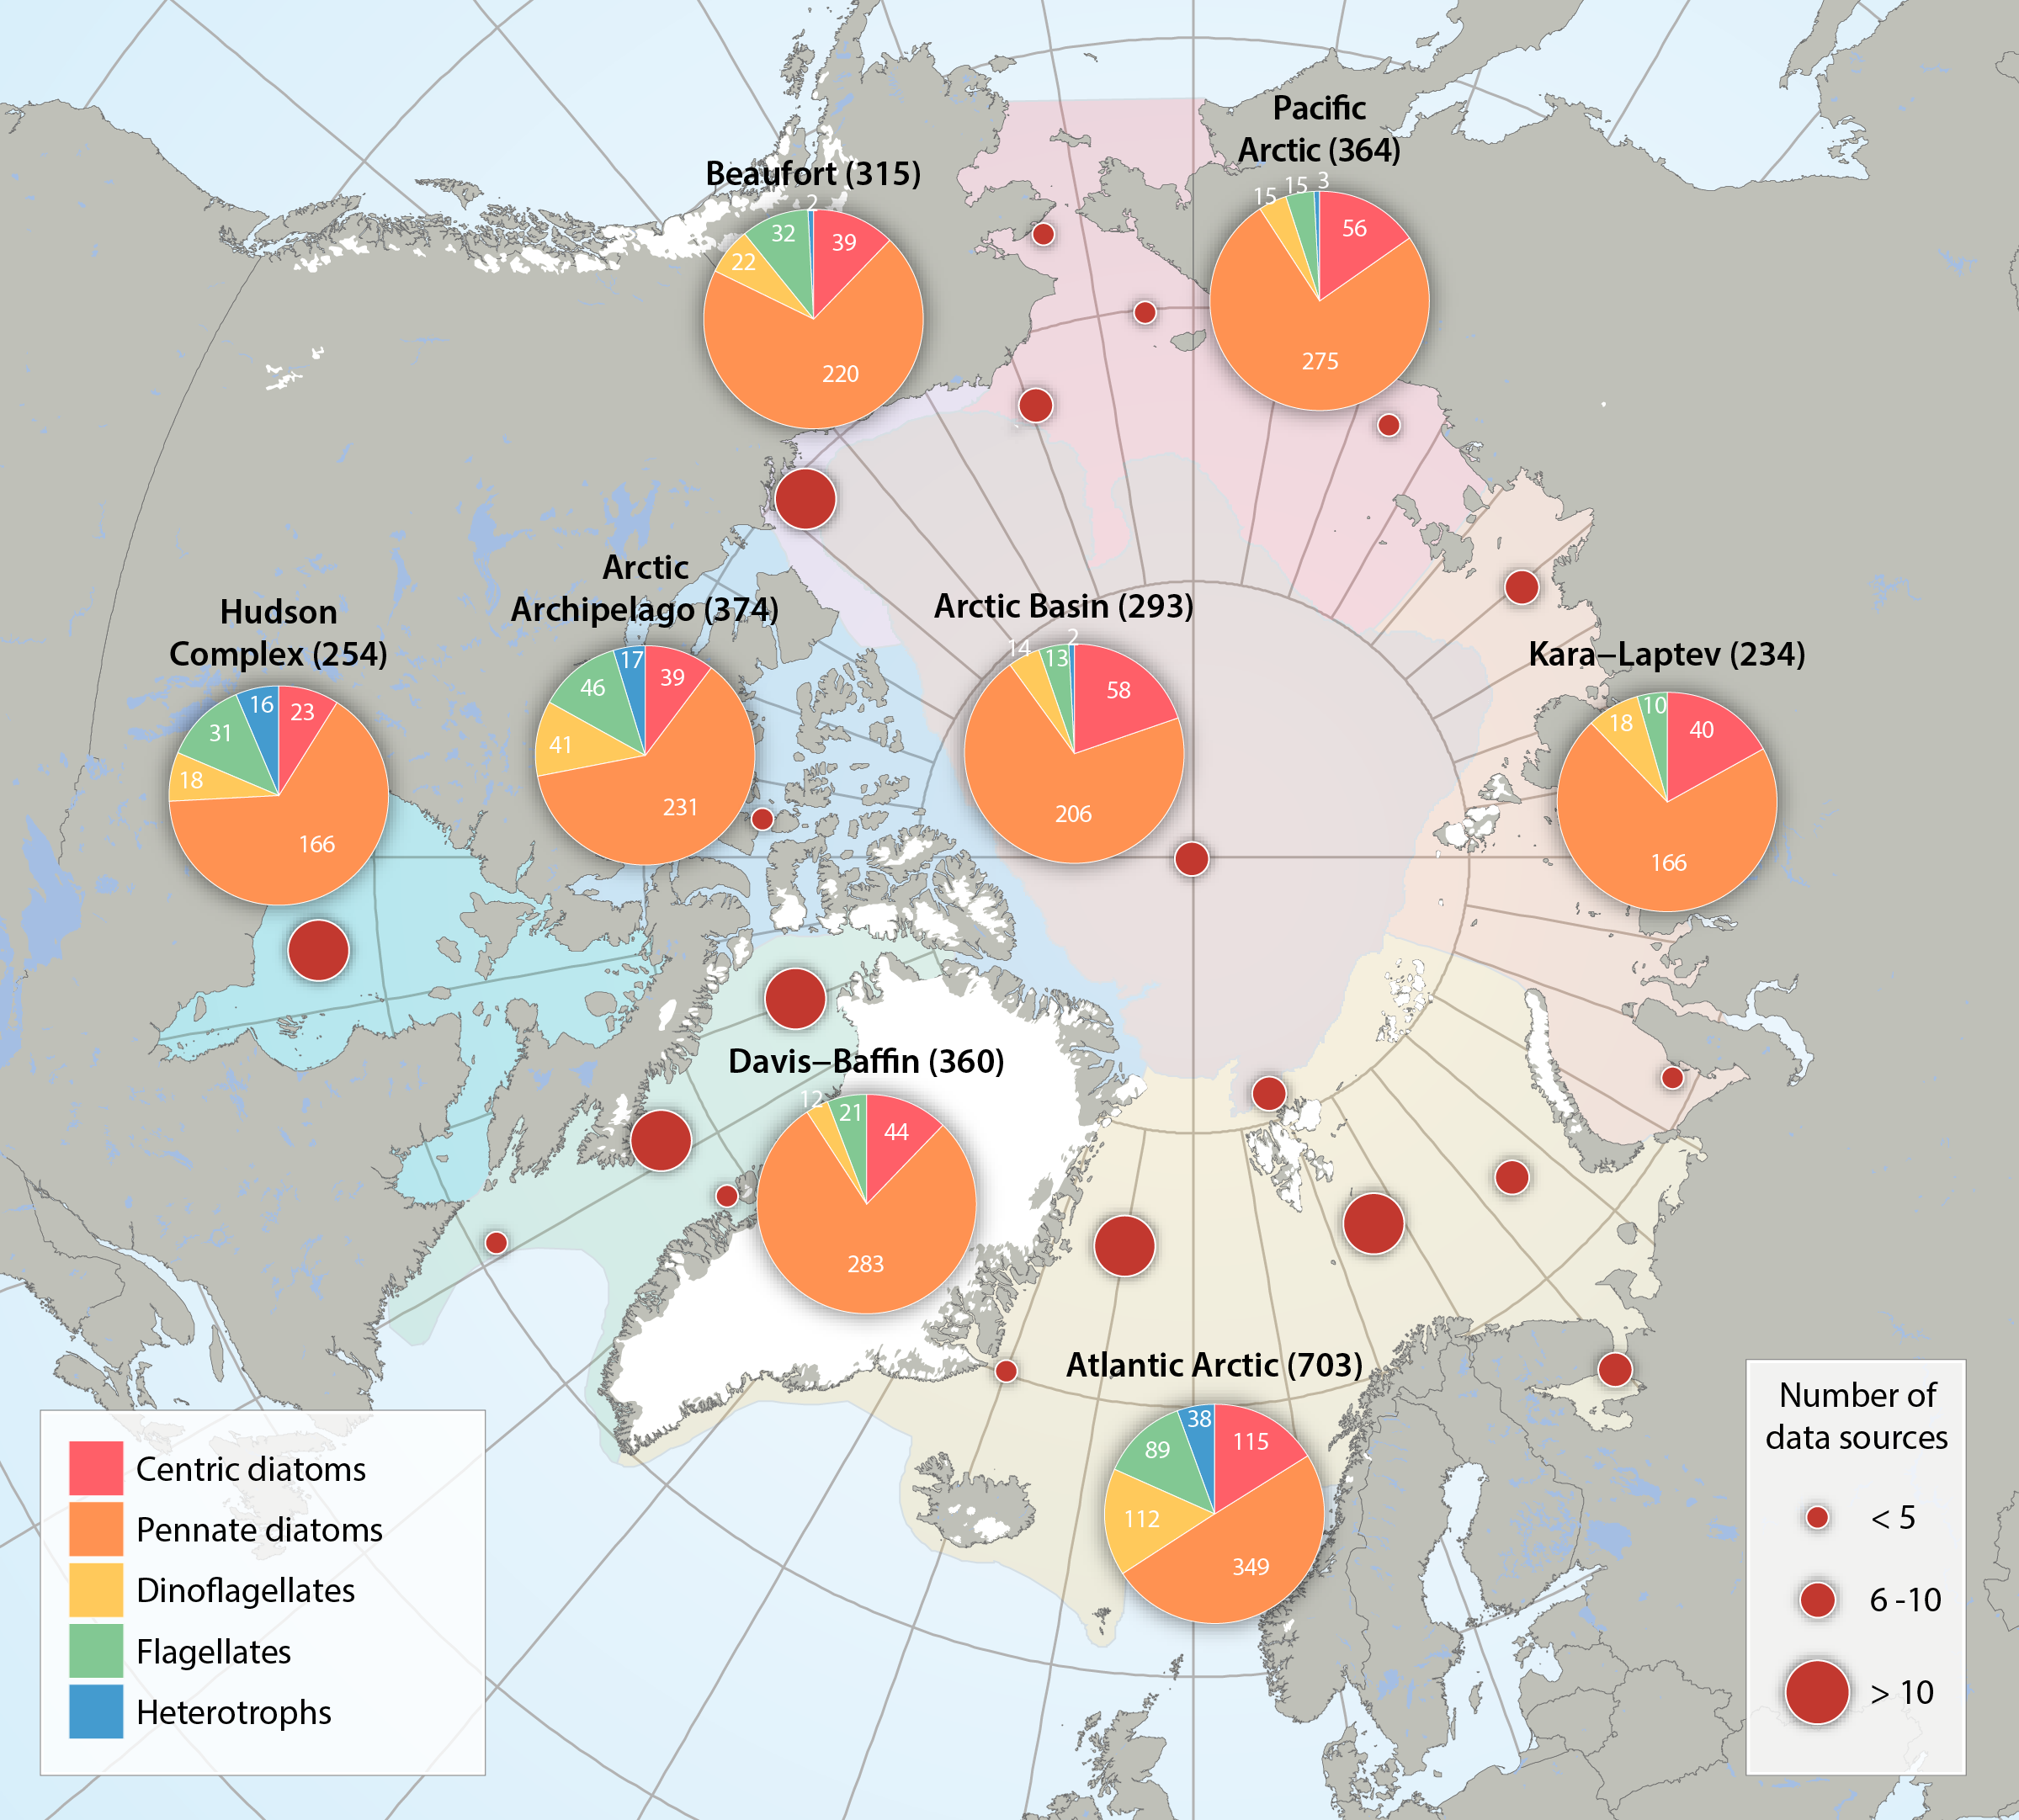
Numbers and taxonomic composition of five single-celled eukaryote groups for the regional divisions of the Arctic Marine Areas (pie charts), as well as the number of data sources reviewed across the Arctic (red circles). Total number of taxa is given in parenthesis after each region. Flagellates include: chlorophytes, chrysophytes, cryptophytes, dictyochophytes, euglenids, prasinophytes, prymnesiophytes, raphidophytes, synurales, and xanthophytes, and- for practical purposes though not flagellates - cyanophytes. Heterotrophs include: choanoflagellates, kinetoplastea, incertae sedis. Updated from Poulin et al. (2011). STATE OF THE ARCTIC MARINE BIODIVERSITY REPORT - <a href="https://arcticbiodiversity.is/findings/sea-ice-biota" target="_blank">Chapter 3</a> - Page 39- Figure 3.1.3 From the report draft: "For a pan-Arctic assessment of diversity (here defined as species richness), the first comprehensive assessments of this FEC from a few years ago (Poulin et al. 2011, Daniëls et al. 2013) have been updated for regions, with taxonomic names standardized according to the World Register of Marine Species (www.marinespecies.org). For the analysis of possible interannual trends in the ice algal community, we used a data set from the Central Arctic, the area most consistently and frequently sampled (Melnikov 2002, I. Melnikov, Shirshov Institute, unpubl. data). Multivariate community structure was analysed based on a presence-absence matrix of cores from 1980 to 2013. The analysis is biased by the varying numbers of analysed cores taken per year ranging widely from 1 to 24, ice thickness between 0.6 and 4.2 m, and including both first-year as well as multiyear sea ice. Locations included were in a bounding box within 74.9 to 90.0 °N and 179.9°W to 176.6°E and varied among years."
-
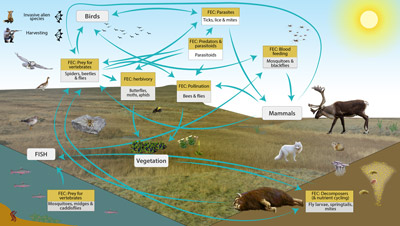
Conceptual model of the FECs and processes mediated by more than 2,500 species of Arctic arthropods known from Greenland, Iceland, Svalbard, and Jan Mayen. STATE OF THE ARCTIC TERRESTRIAL BIODIVERSITY REPORT - Chapter 3 - Page 37- Figure 3.7
-
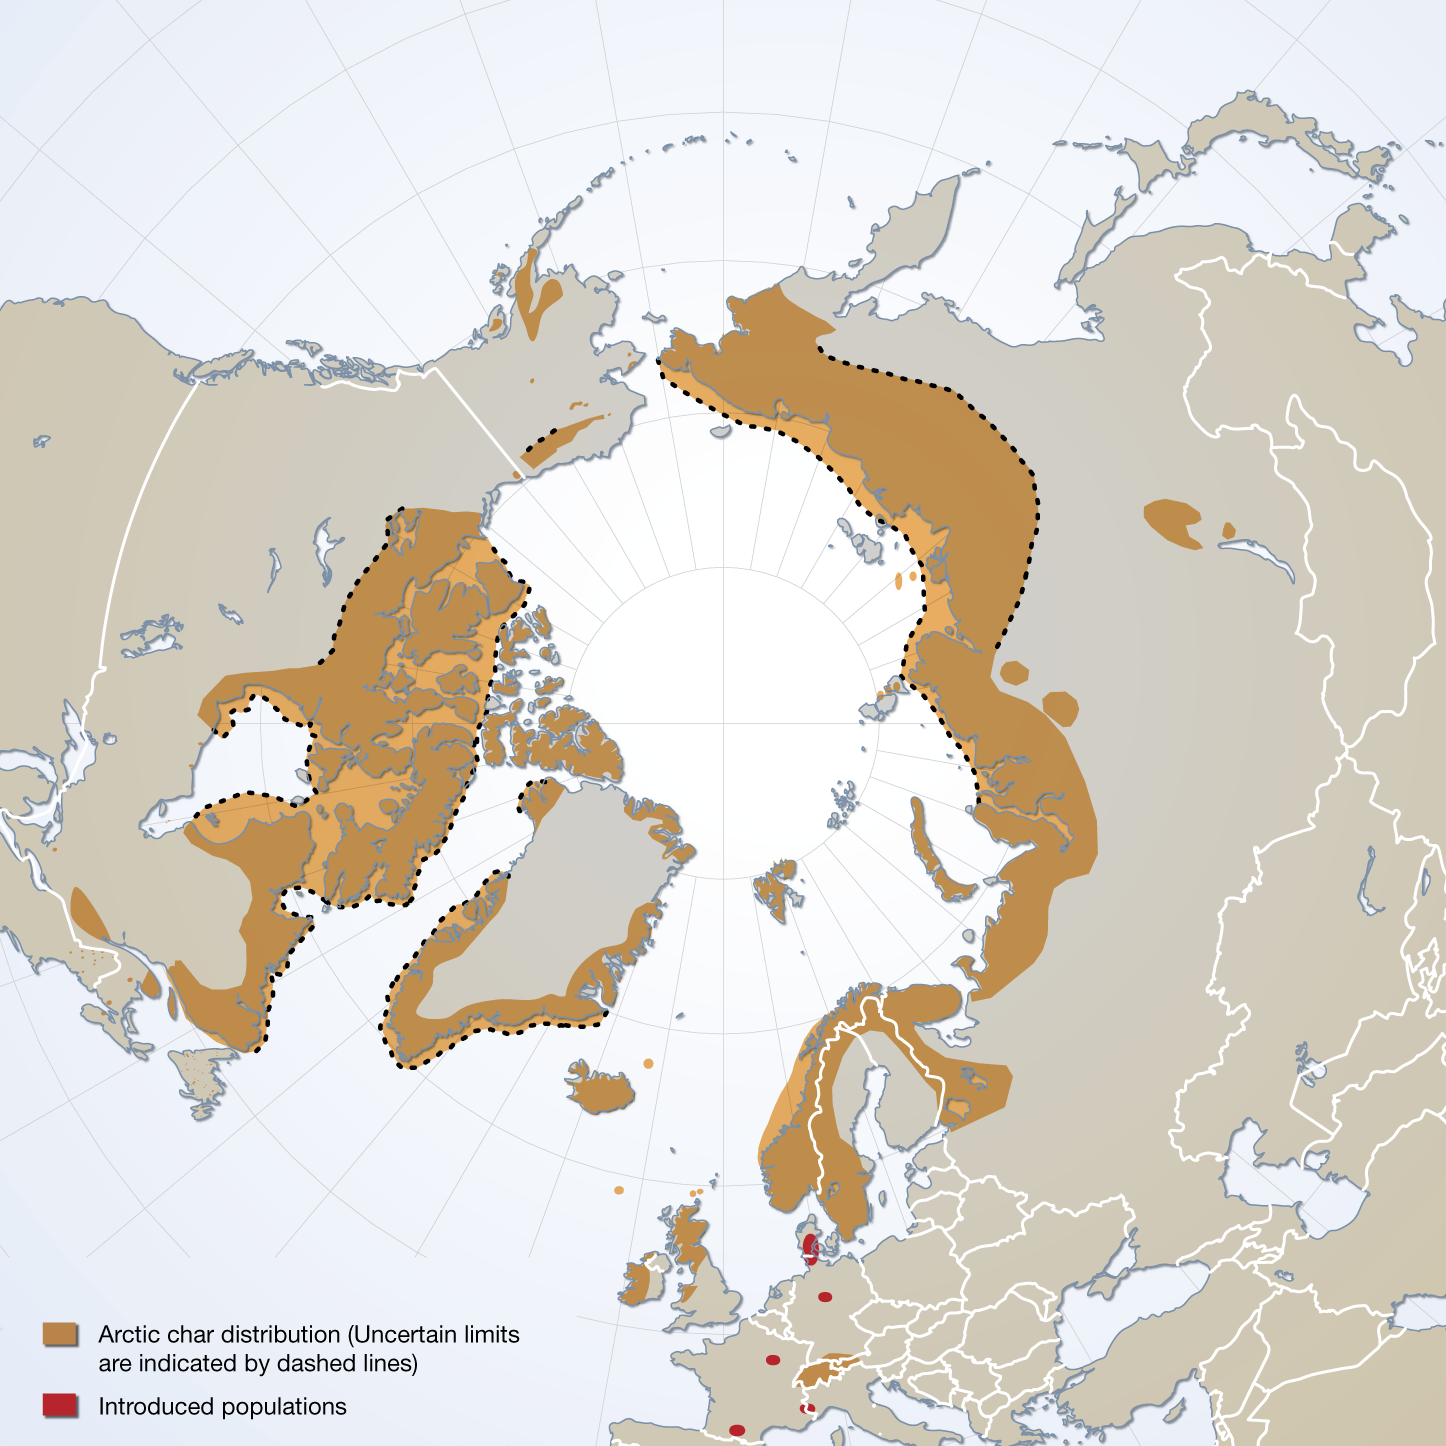
The distribution of Arctic char species complex, sensu stricto, and the location of introduced populations. Published in the Arctic Biodiversity trends 2010, Indicator #06 Arctic char, page 41 - released in May 2010
-
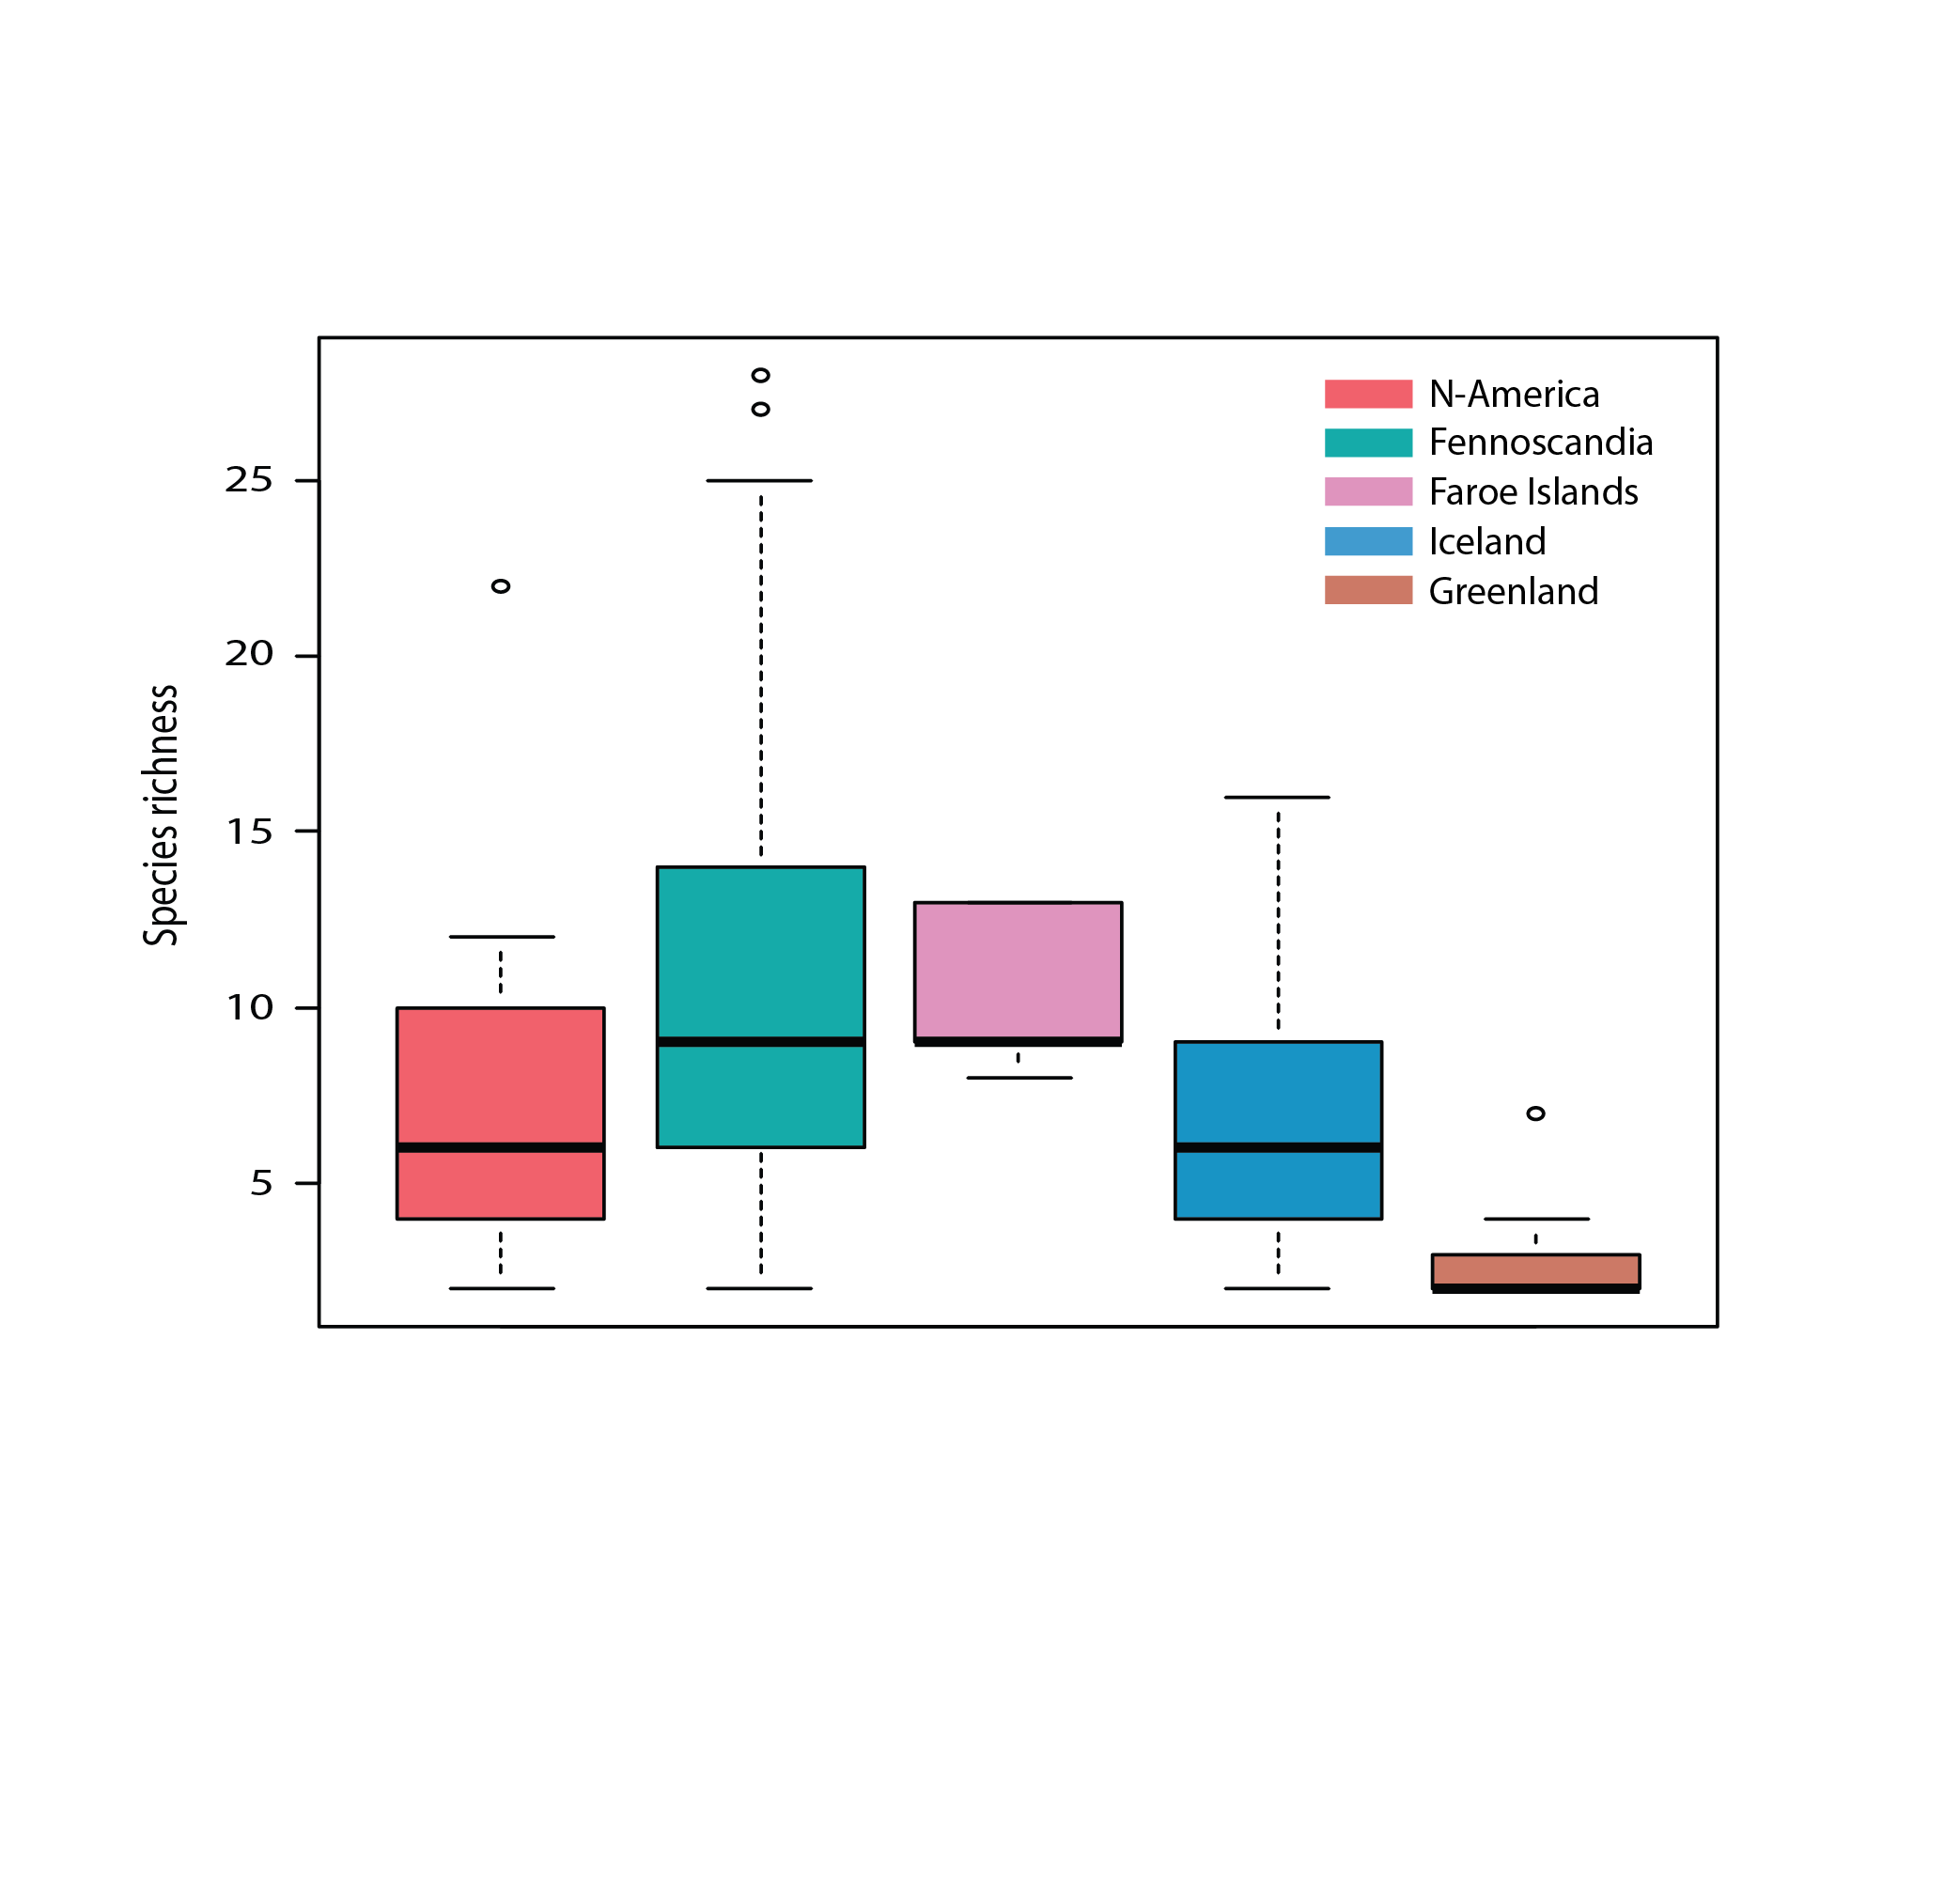
Figure 4 23 Species richness of aquatic macrophytes excluding mosses and algae in five geographic regions of the Arctic. Ame = North America, Fen = Fennoscandia, Far = Faroes, Ice = Iceland, Gre = Greenland. State of the Arctic Freshwater Biodiversity Report - Chapter 4 - Page 55 - Figure 4-22
-

Although the circumpolar countries endeavor to support monitoring programs that provide good coverage of Arctic and subarctic regions, this ideal is constrained by the high costs associated with repeated sampling of a large set of lakes and rivers in areas that often are very remote. Consequently, freshwater monitoring has sparse, spatial coverage in large parts of the Arctic, with only Fennoscandia and Iceland having extensive monitoring coverage of lakes and streams Figure 6-2 Current state of monitoring for river FECs in each Arctic country State of the Arctic Freshwater Biodiversity Report - Chapter 6 - Page 94 - Figure 6-2
-
Trend quality categories are: (1) data are lacking such that trends are unknown, (2) regional and site-specific monitoring allow for assumptions of trend, (3) international monitoring allows estimation of trend direction, and (4) rigorously designed international monitoring programmes yield estimates of precision. Modified from Smith et al. 2020. STATE OF THE ARCTIC TERRESTRIAL BIODIVERSITY REPORT - Chapte31 - Page 59 - Figure 3.26
-
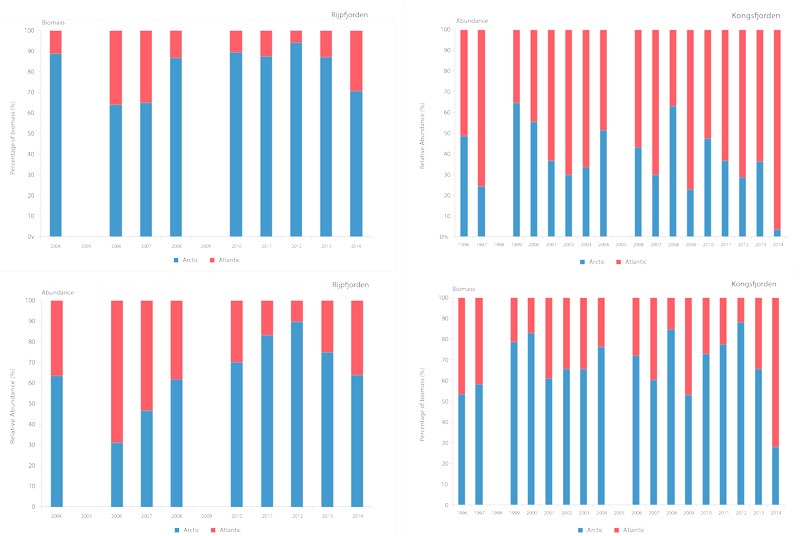
Time series of relative proportions of Arctic and Atlantic Calanus species in Kongsfjorden (top) and Rijpfjorden (bottom) (Source: MOSJ, Norwegian Polar Institute). STATE OF THE ARCTIC MARINE BIODIVERSITY REPORT - <a href="https://arcticbiodiversity.is/findings/plankton" target="_blank">Chapter 3</a> - Page 77 - Figure 3.2.8
-
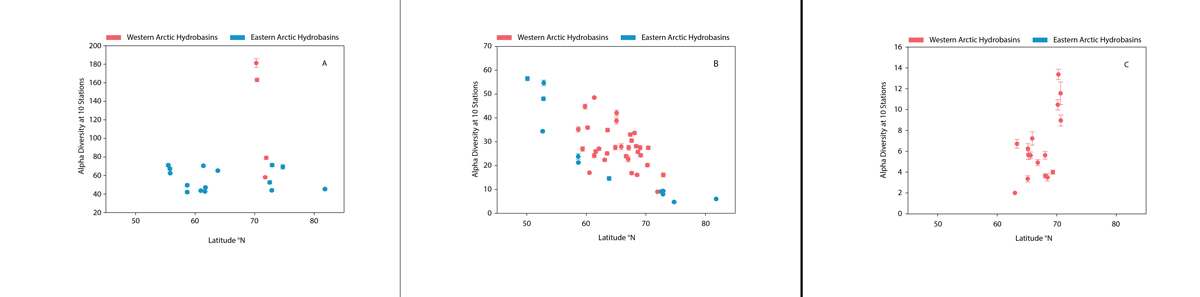
Alpha diversity (± standard error) of river (a) diatoms from benthic samples, (b) benthic macroinvertebrates, and (c) fish within hydrobasins in western and eastern North America plotted as a function of the average latitude in each hydrobasin. Alpha diversity is rarefied to 10 stations per hydrobasin, using size level 5 hydrobasins for all panels. State of the Arctic Freshwater Biodiversity Report - Chapter 5 - Page 85 - Figure 5-2
-
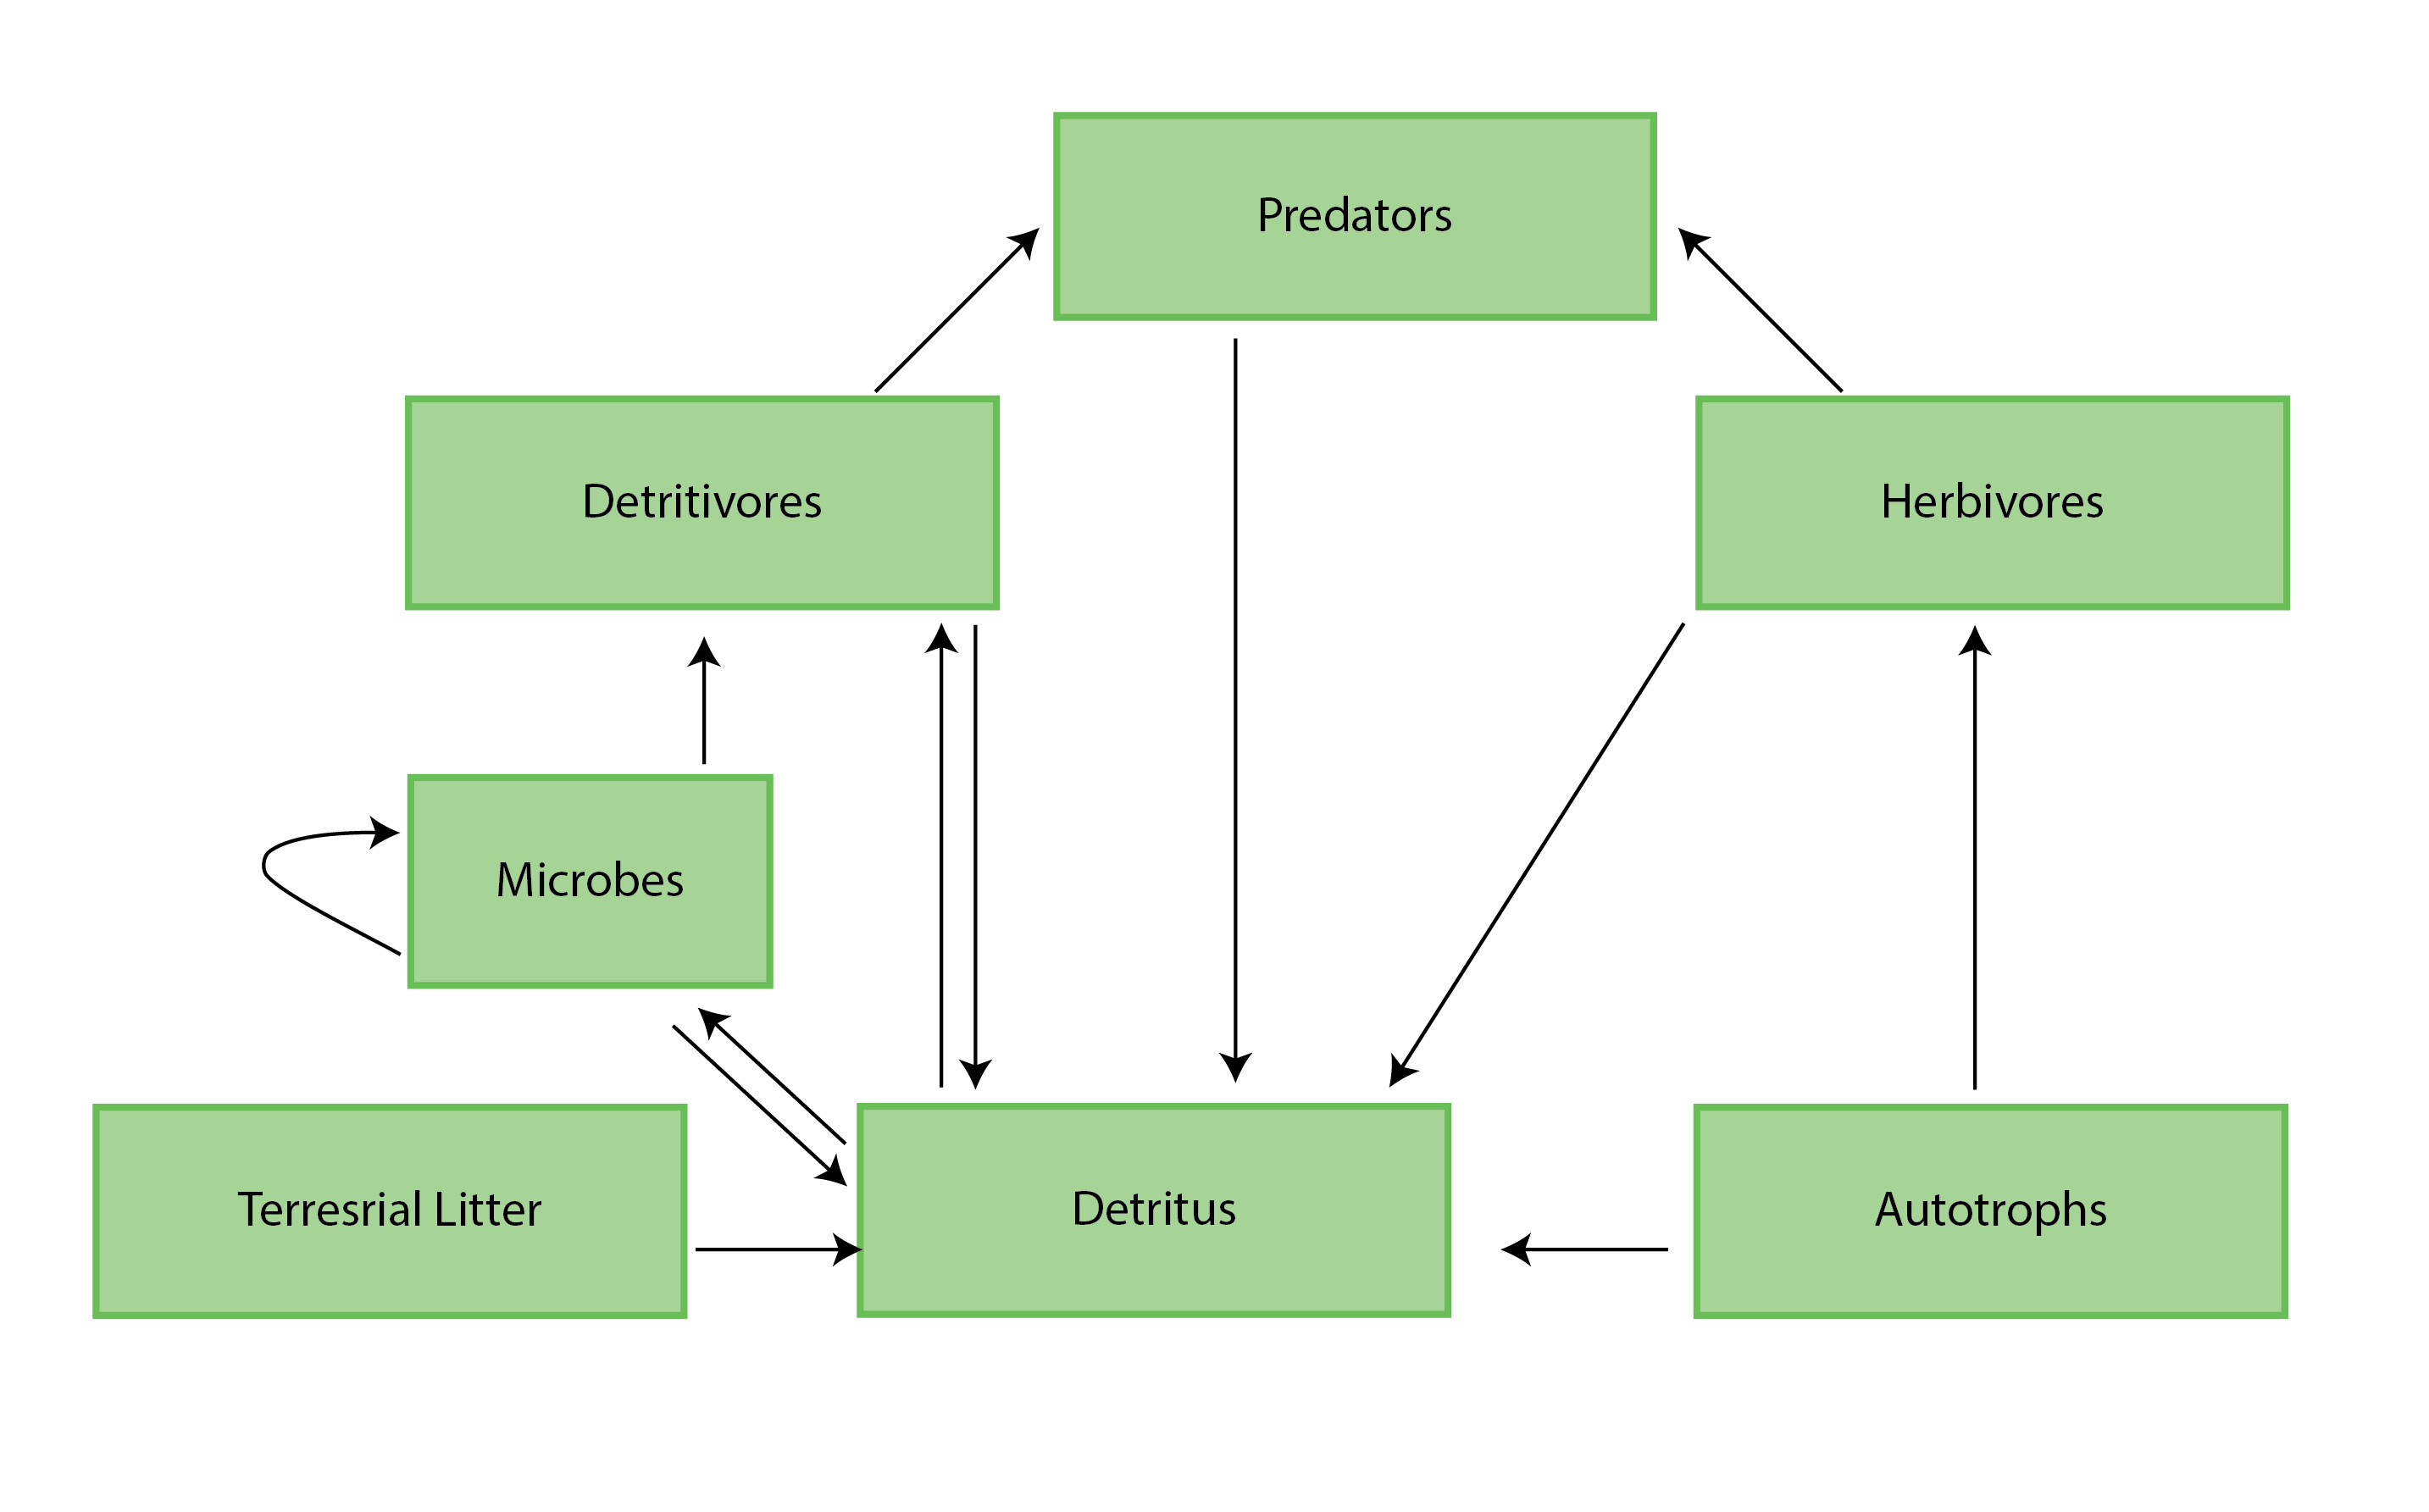
Figure 4-1 A generic food web diagram for a lake or river, indicating the basic trophic levels (boxes) and energy flow (arrows) between those levels. Reproduced from Culp et al. (2012a). State of the Arctic Freshwater Biodiversity Report - Chapter 4 - Page 25 - Figure 4-1