 CAFF - Arctic Biodiversity Data Service (ABDS)
unknown
Type of resources
Available actions
Topics
Keywords
Contact for the resource
Provided by
Years
Formats
Representation types
Update frequencies
status
Scale
-
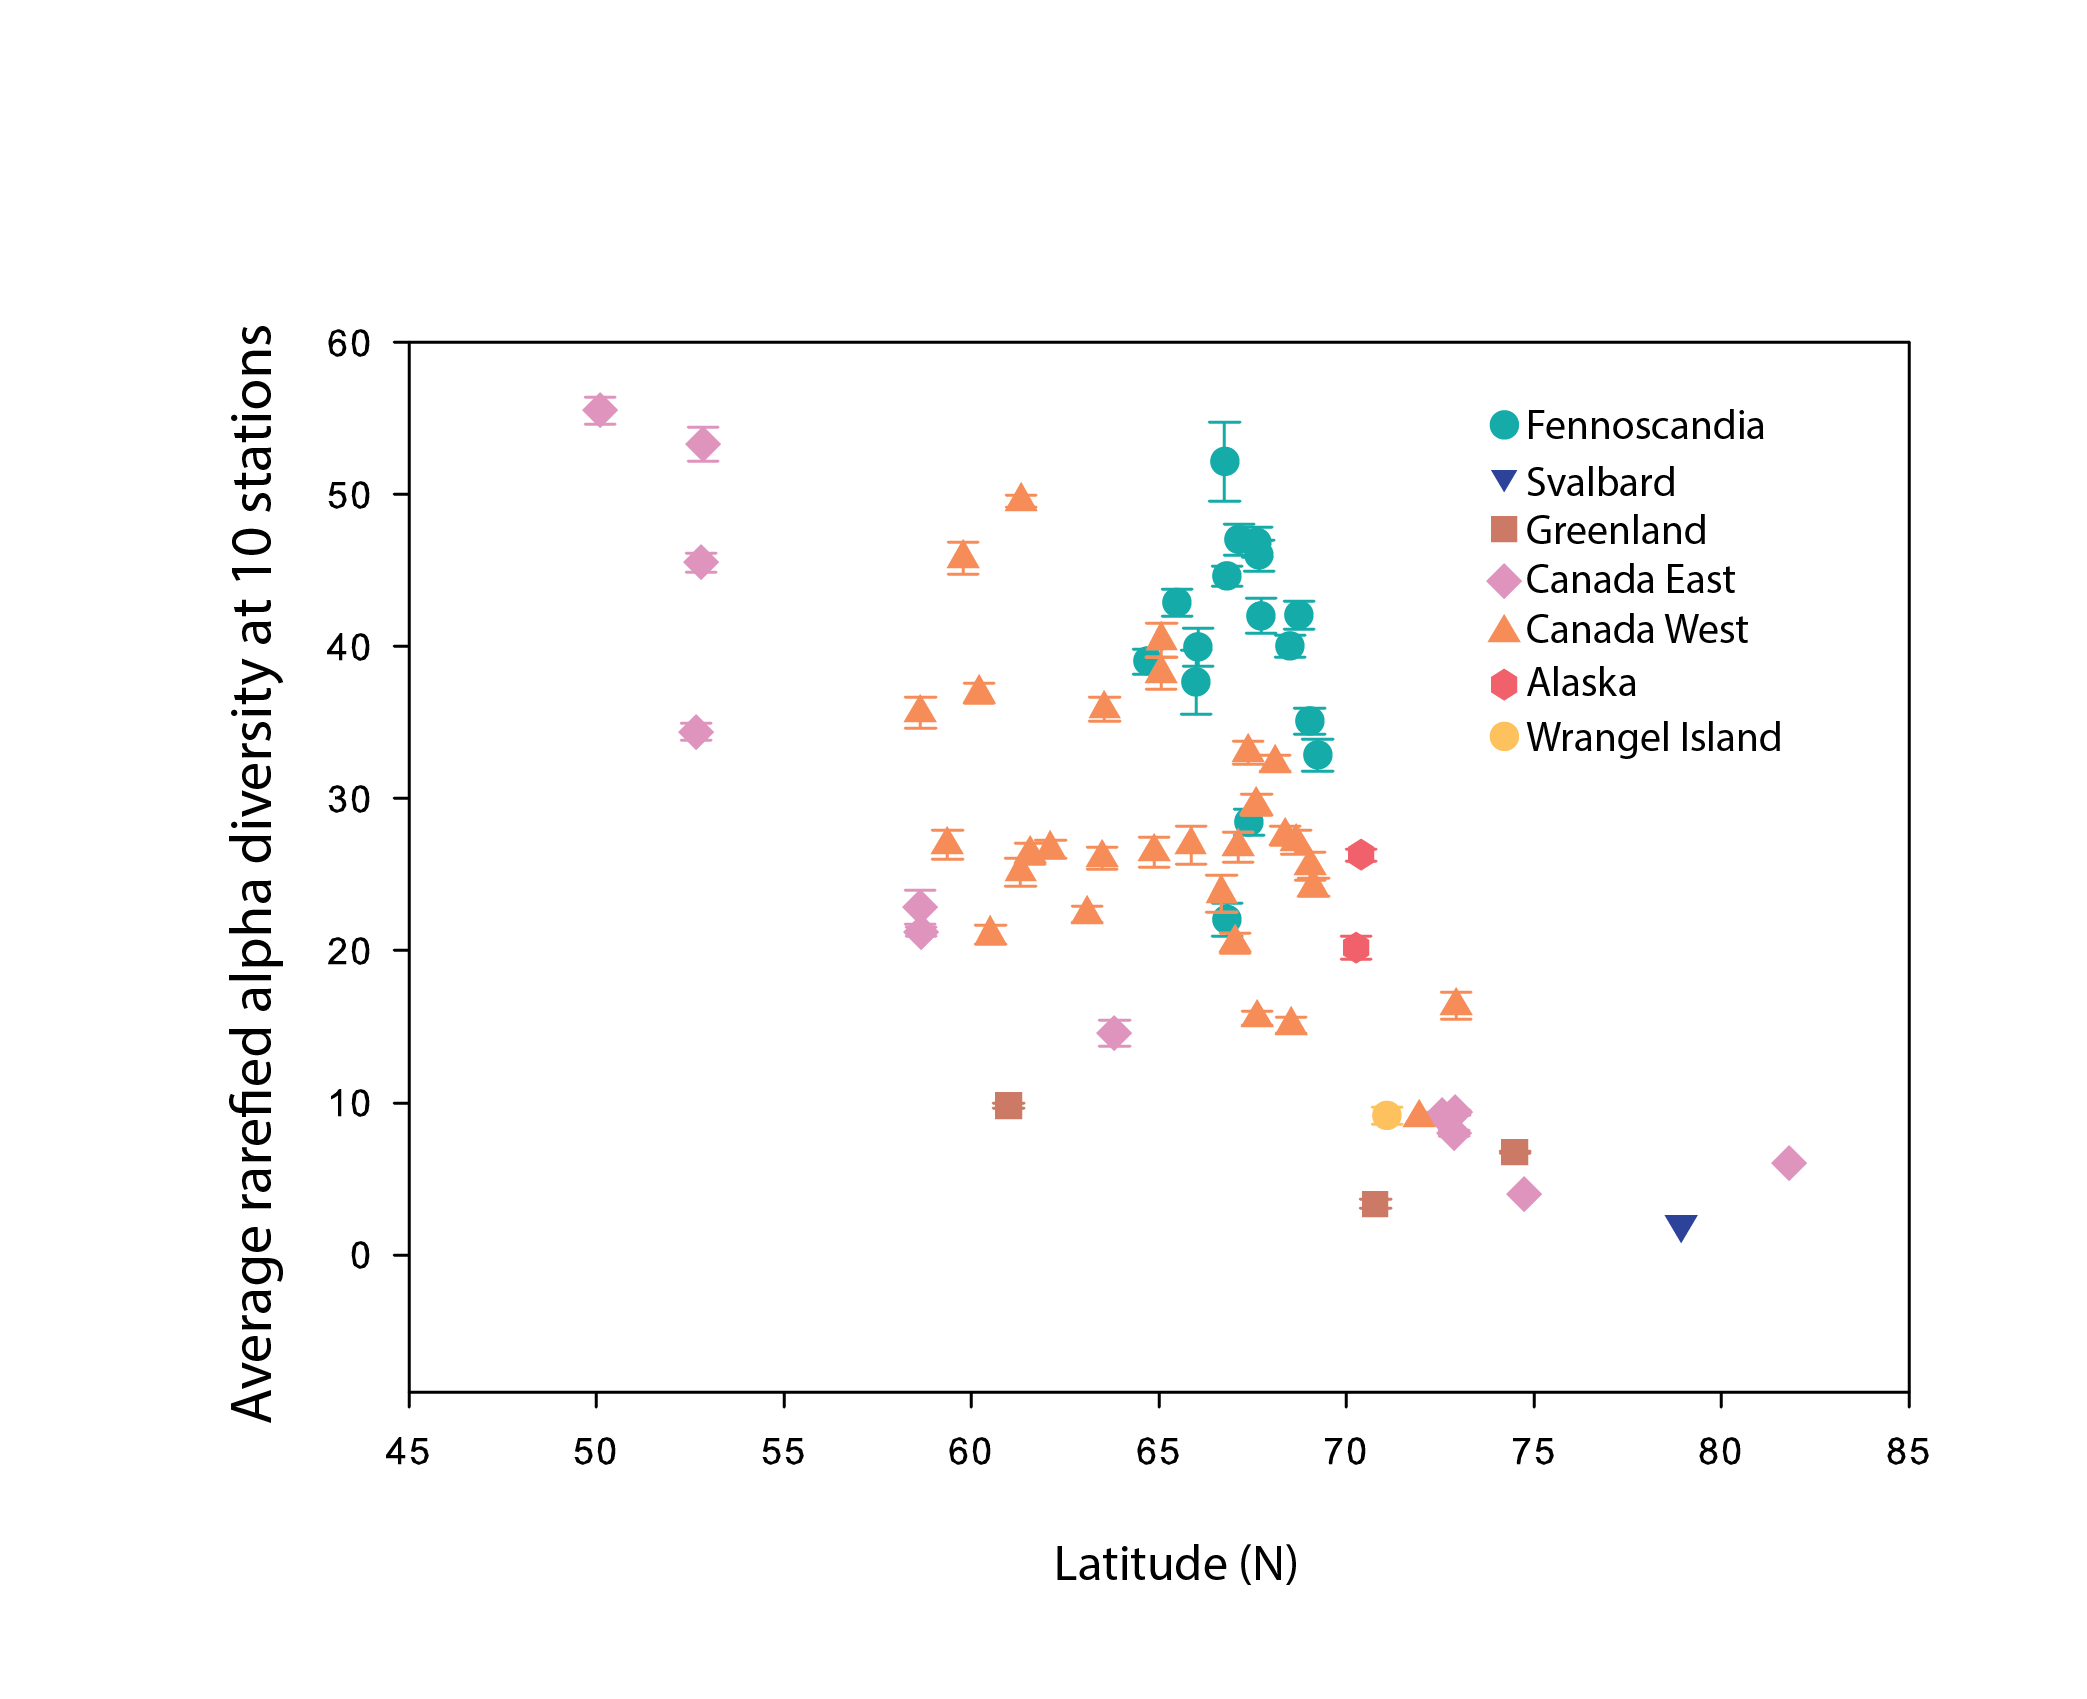
Alpha diversity (rarefied to 10 stations, with error bars indicating standard error) of river benthic macroinvertebrates plotted as a function of the average latitude of stations in each hydrobasin. Hydrobasins are coloured based on country/region State of the Arctic Freshwater Biodiversity Report - Chapter 4 - Page 68 - Figure 4-32
-
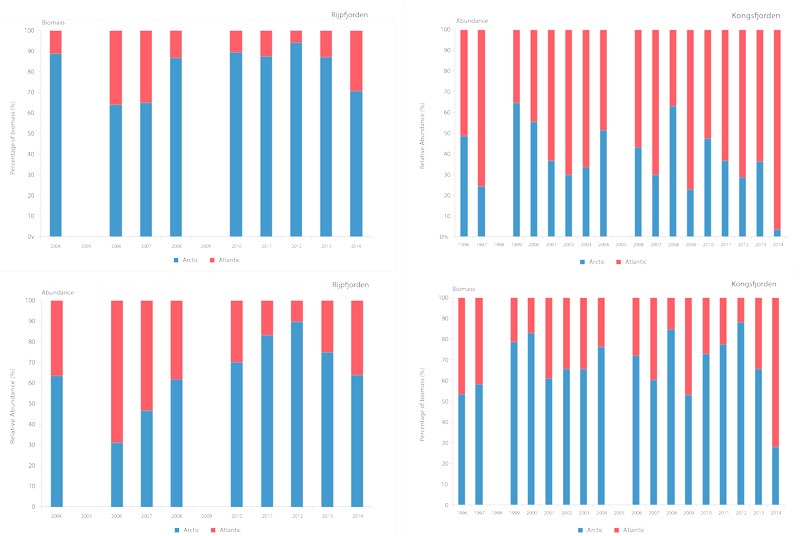
Time series of relative proportions of Arctic and Atlantic Calanus species in Kongsfjorden (top) and Rijpfjorden (bottom) (Source: MOSJ, Norwegian Polar Institute). STATE OF THE ARCTIC MARINE BIODIVERSITY REPORT - <a href="https://arcticbiodiversity.is/findings/plankton" target="_blank">Chapter 3</a> - Page 77 - Figure 3.2.8
-
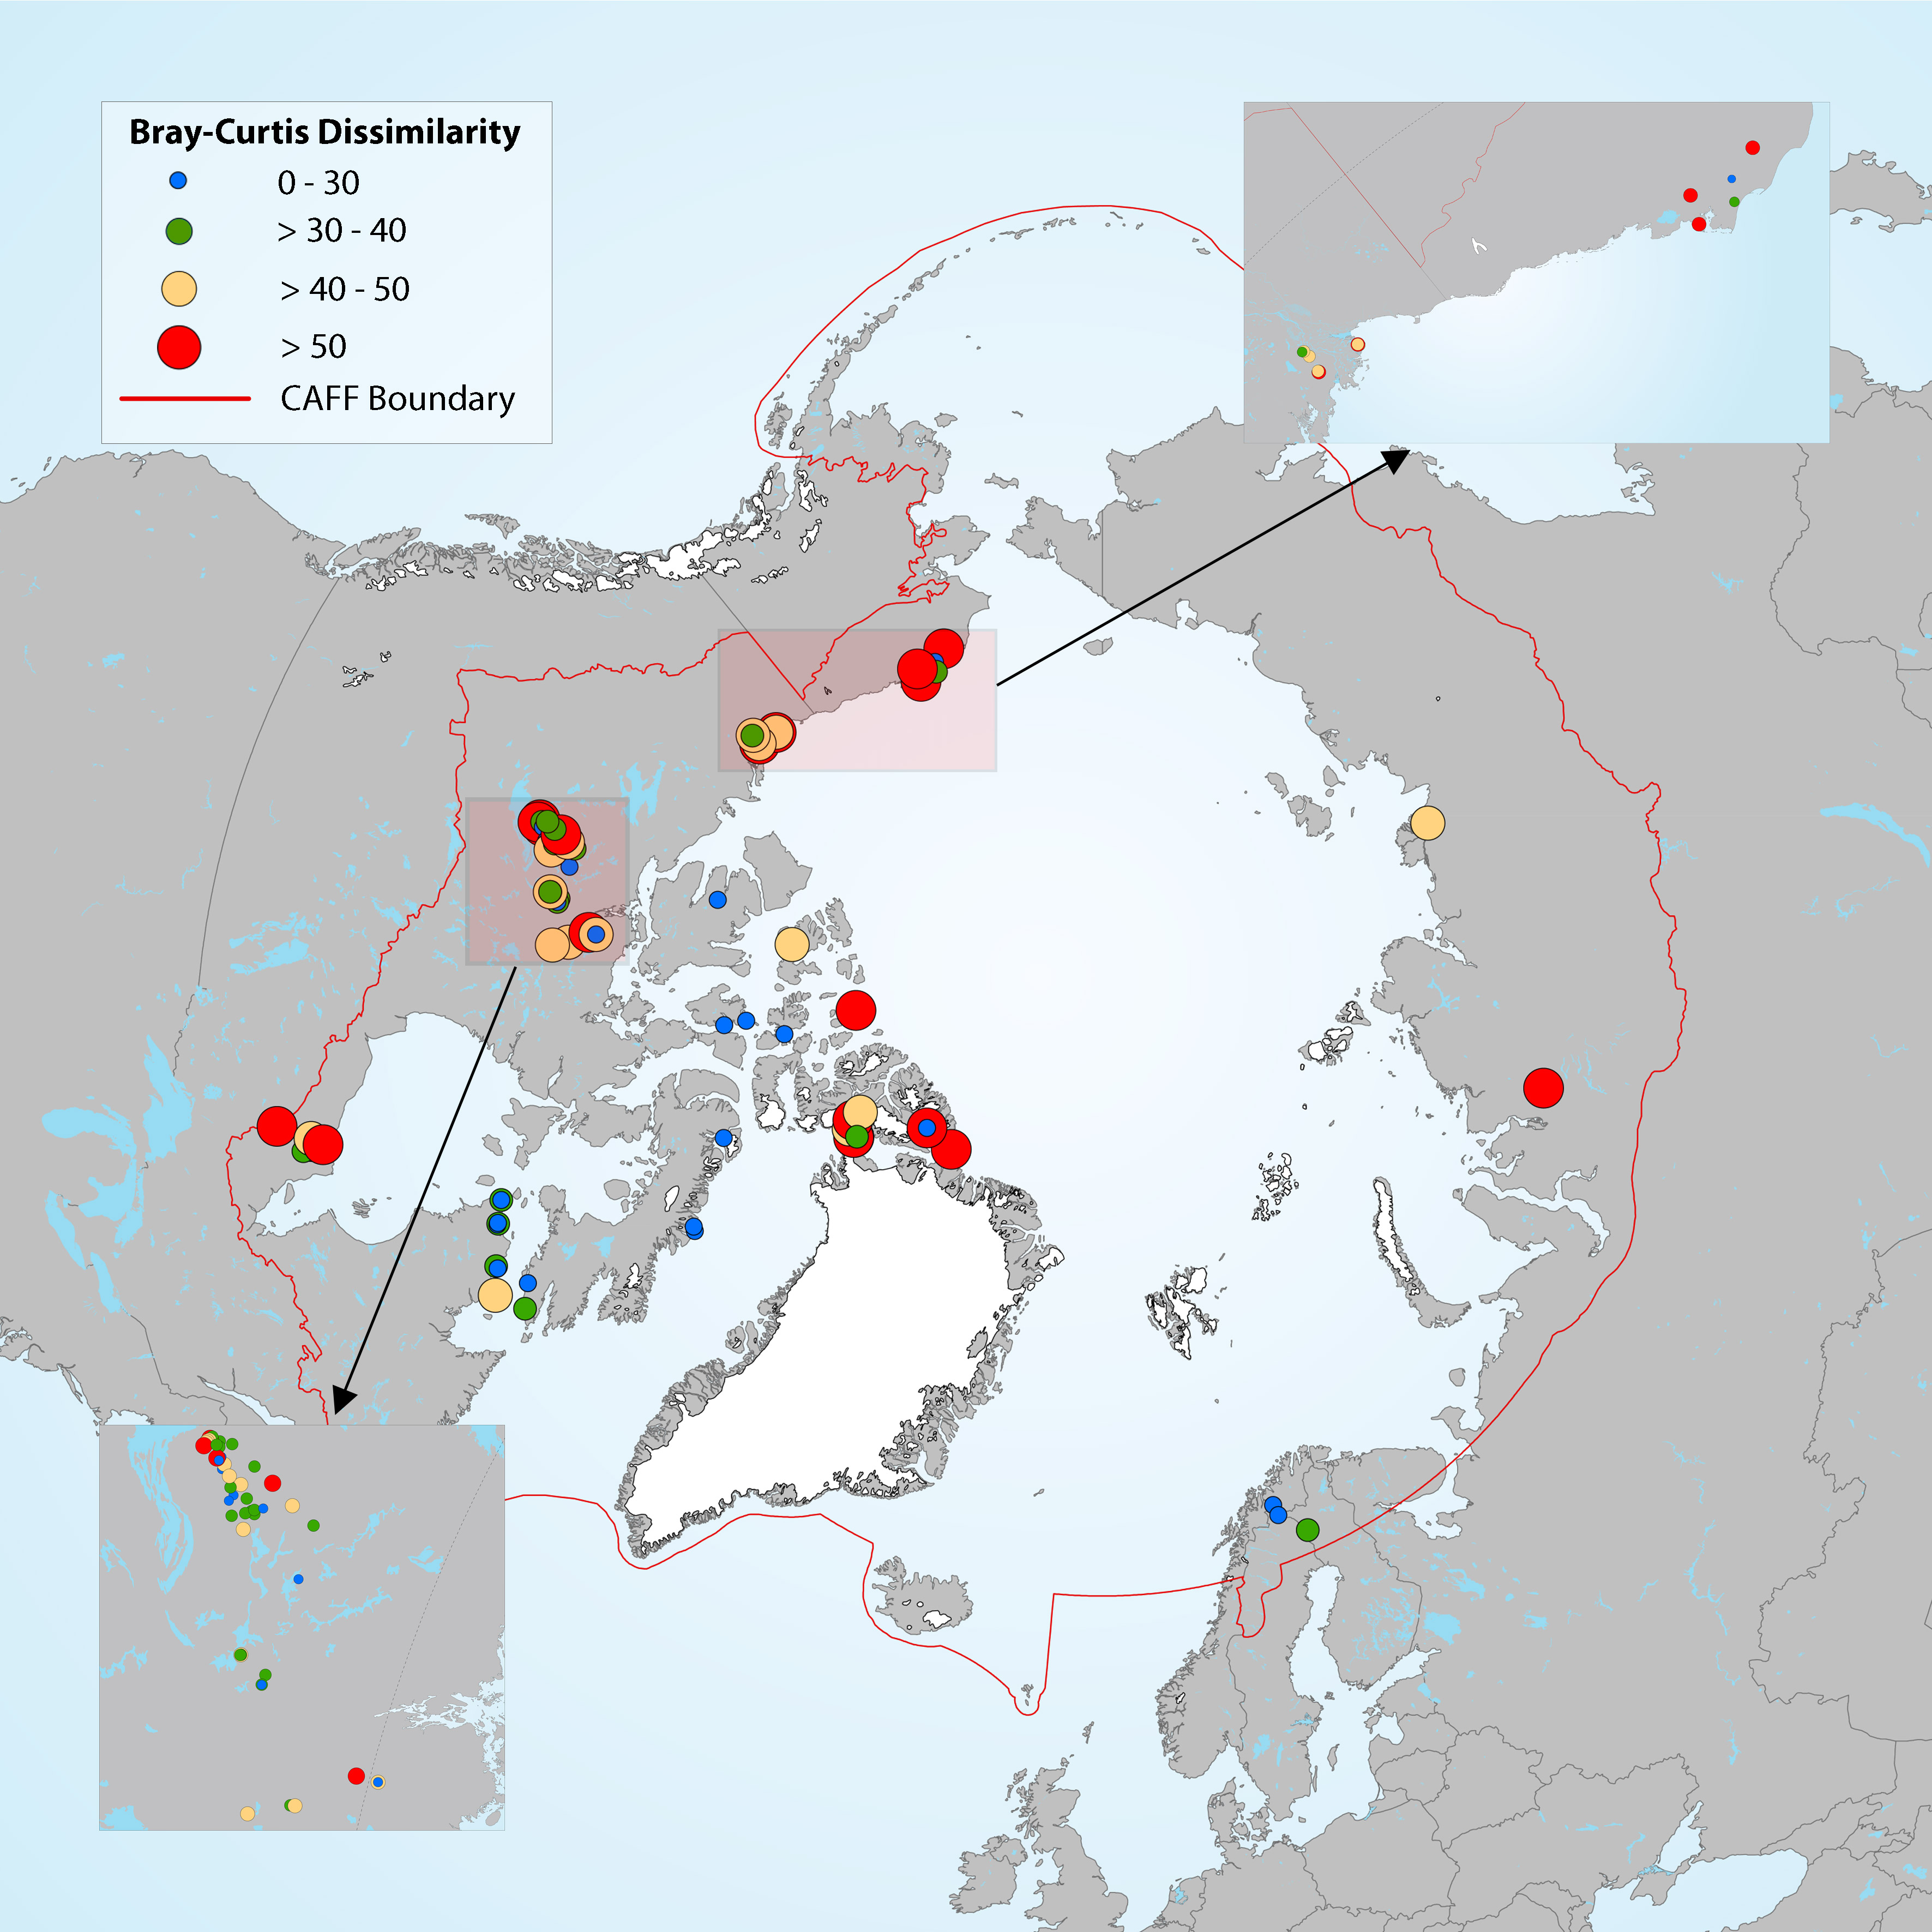
Estimation of diatom assemblage changes over a period of about 200 years (top versus bottom sediment cores). Figure 4-14 Map showing the magnitude of change in diatom assemblages between bottom (pre-industrial) and top (modern) section of the cores, estimated by Bray-Curtis (B-C) dissimilarity. Boundaries for the B-C dissimilarity categories are based on distribution quartiles (0-30%, 30-40%, 40- 50% and >50%), where the lowest values (blue dots) represent the lowest degree of change in diatom assemblage composition between top and bottom sediment core samples in each lake. State of the Arctic Freshwater Biodiversity Report - Chapter 4 - Page 41 - Figure 4-14
-
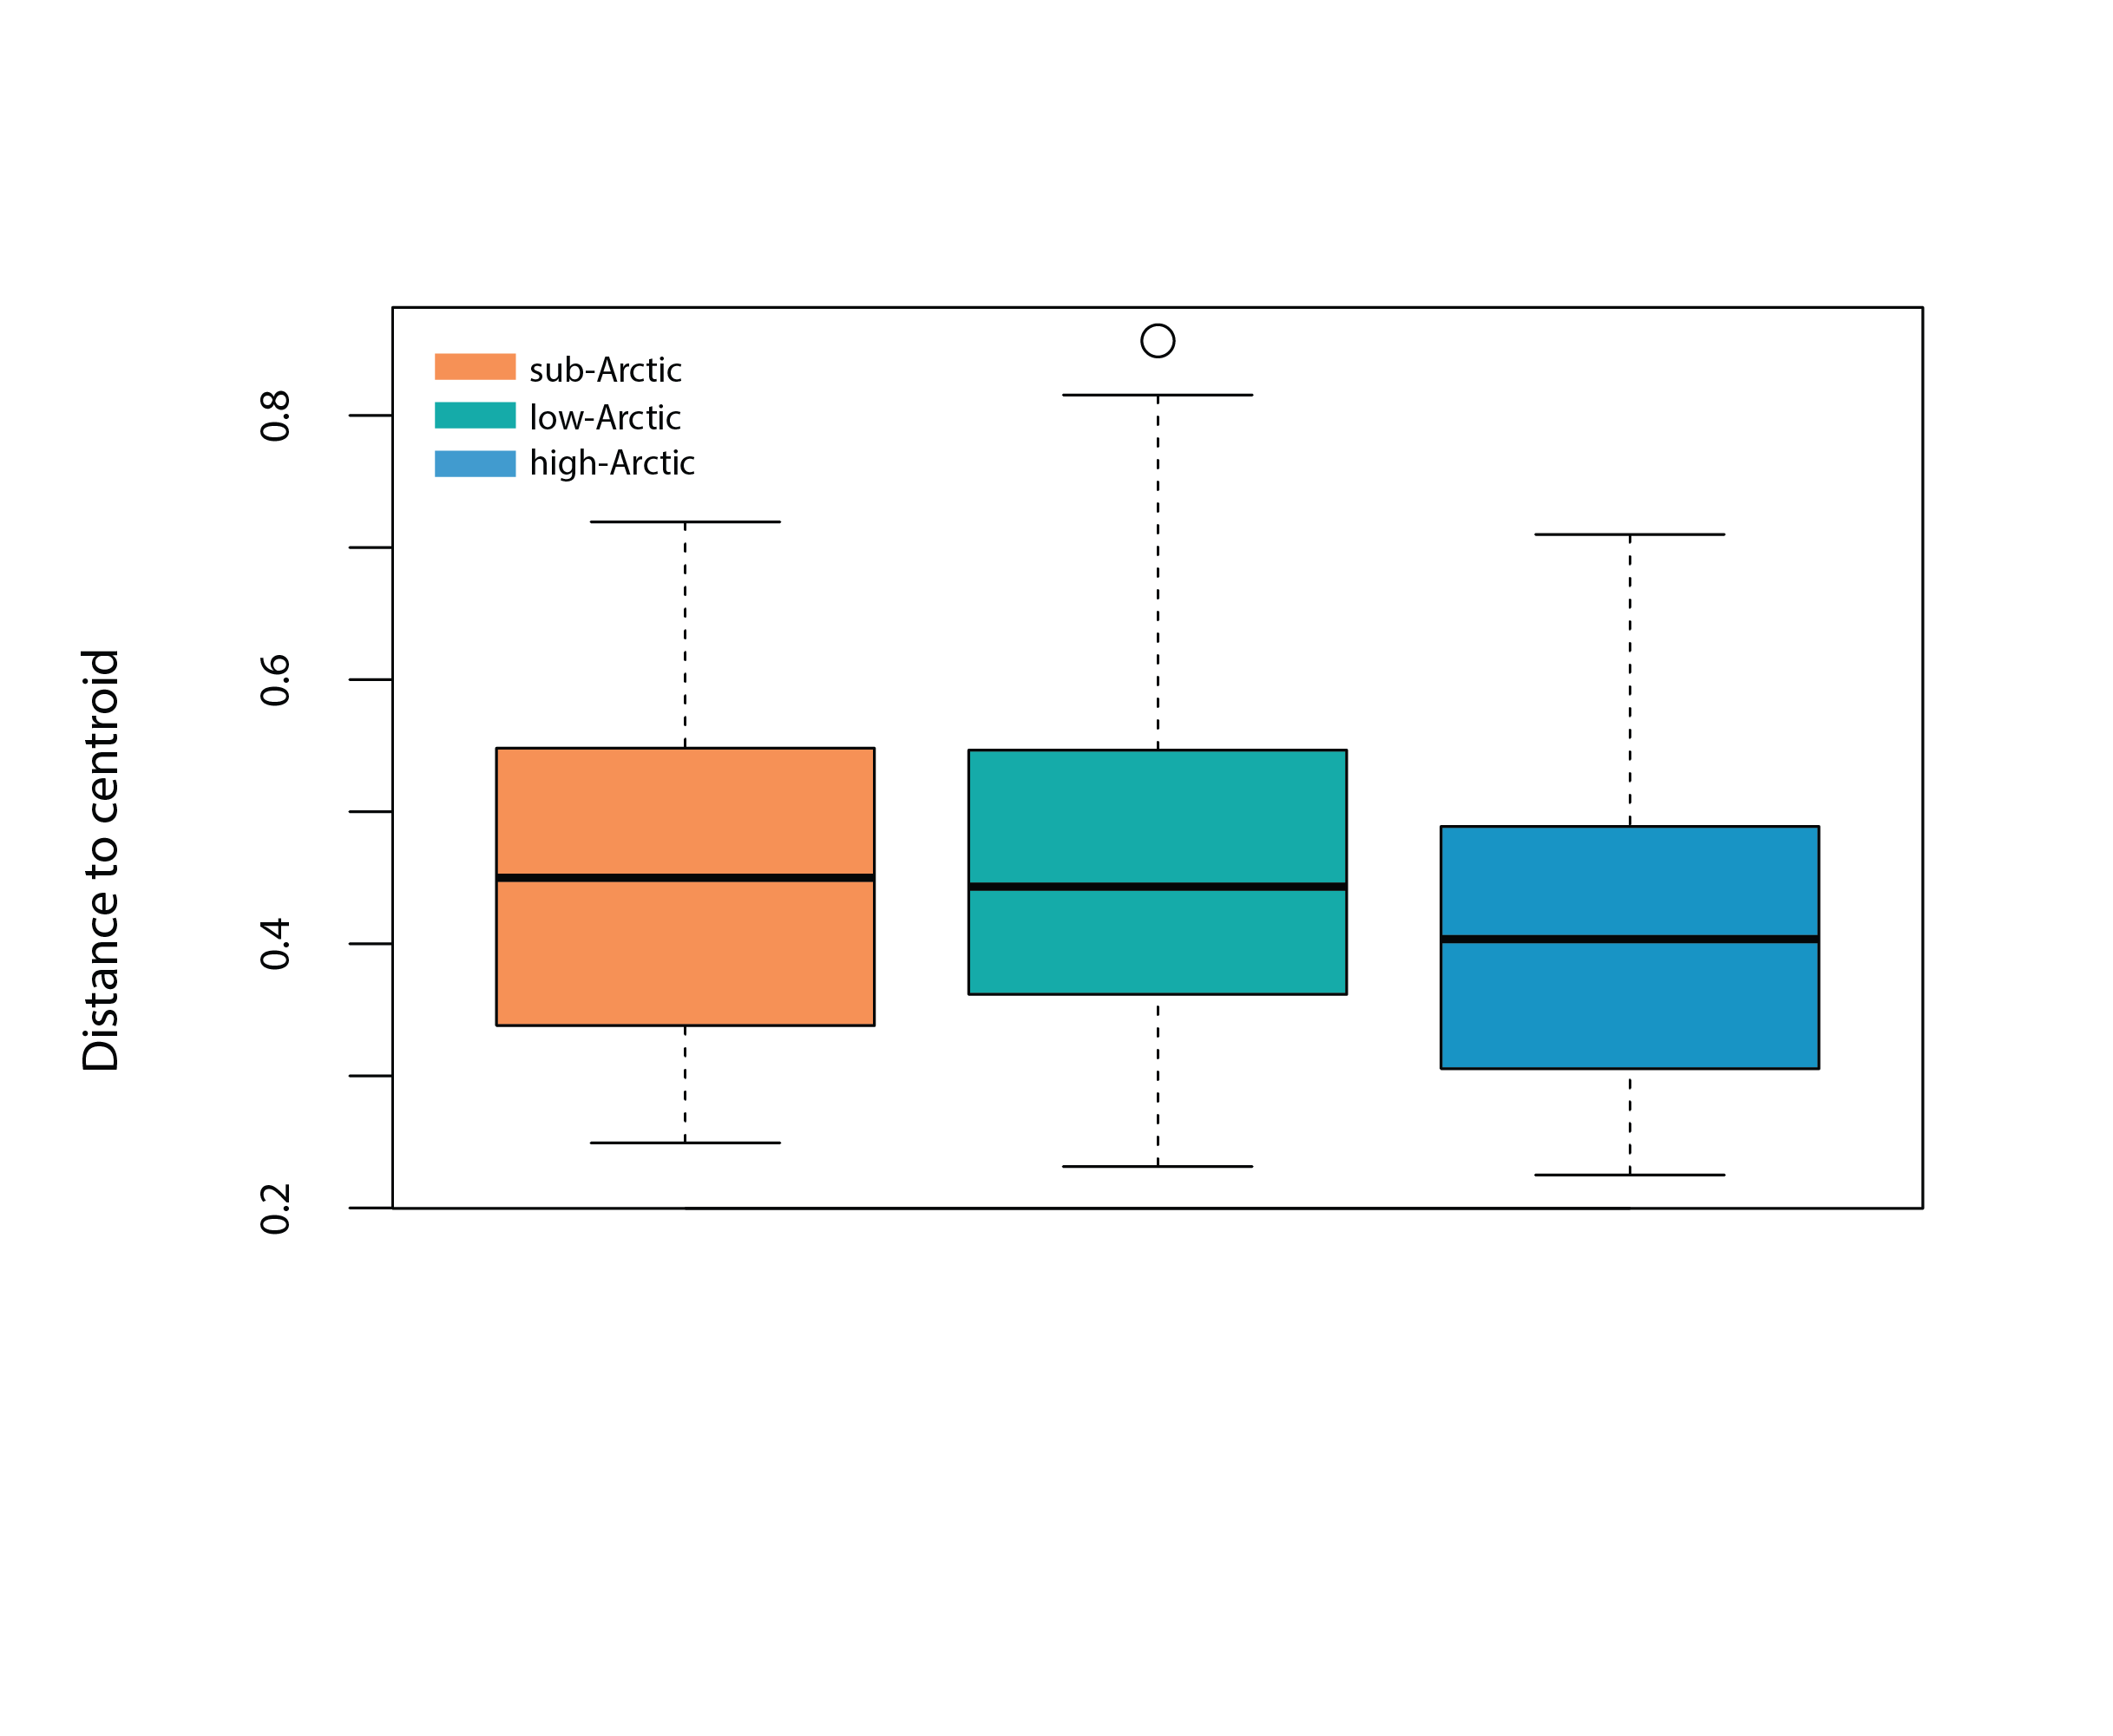
Box plot represents the homogeneity of assemblages in high Arctic (n=190), low Arctic (n=370) and sub-Arctic lakes (n=1151), i.e., the distance of individual lake phytoplankton assemblages to the group centroid in multivariate space. The mean distance to the centroid for each of the regions can be seen as an estimated of beta diversity, with increasing distance equating to greater differences among assemblages. State of the Arctic Freshwater Biodiversity Report - Chapter 4 - Page 48 - Figure 4-18
-

The Arctic terrestrial food web includes the exchange of energy and nutrients. Arrows to and from the driver boxes indicate the relative effect and counter effect of different types of drivers on the ecosystem. STATE OF THE ARCTIC TERRESTRIAL BIODIVERSITY REPORT - Chapter 2 - Page 26- Figure 2.4
-
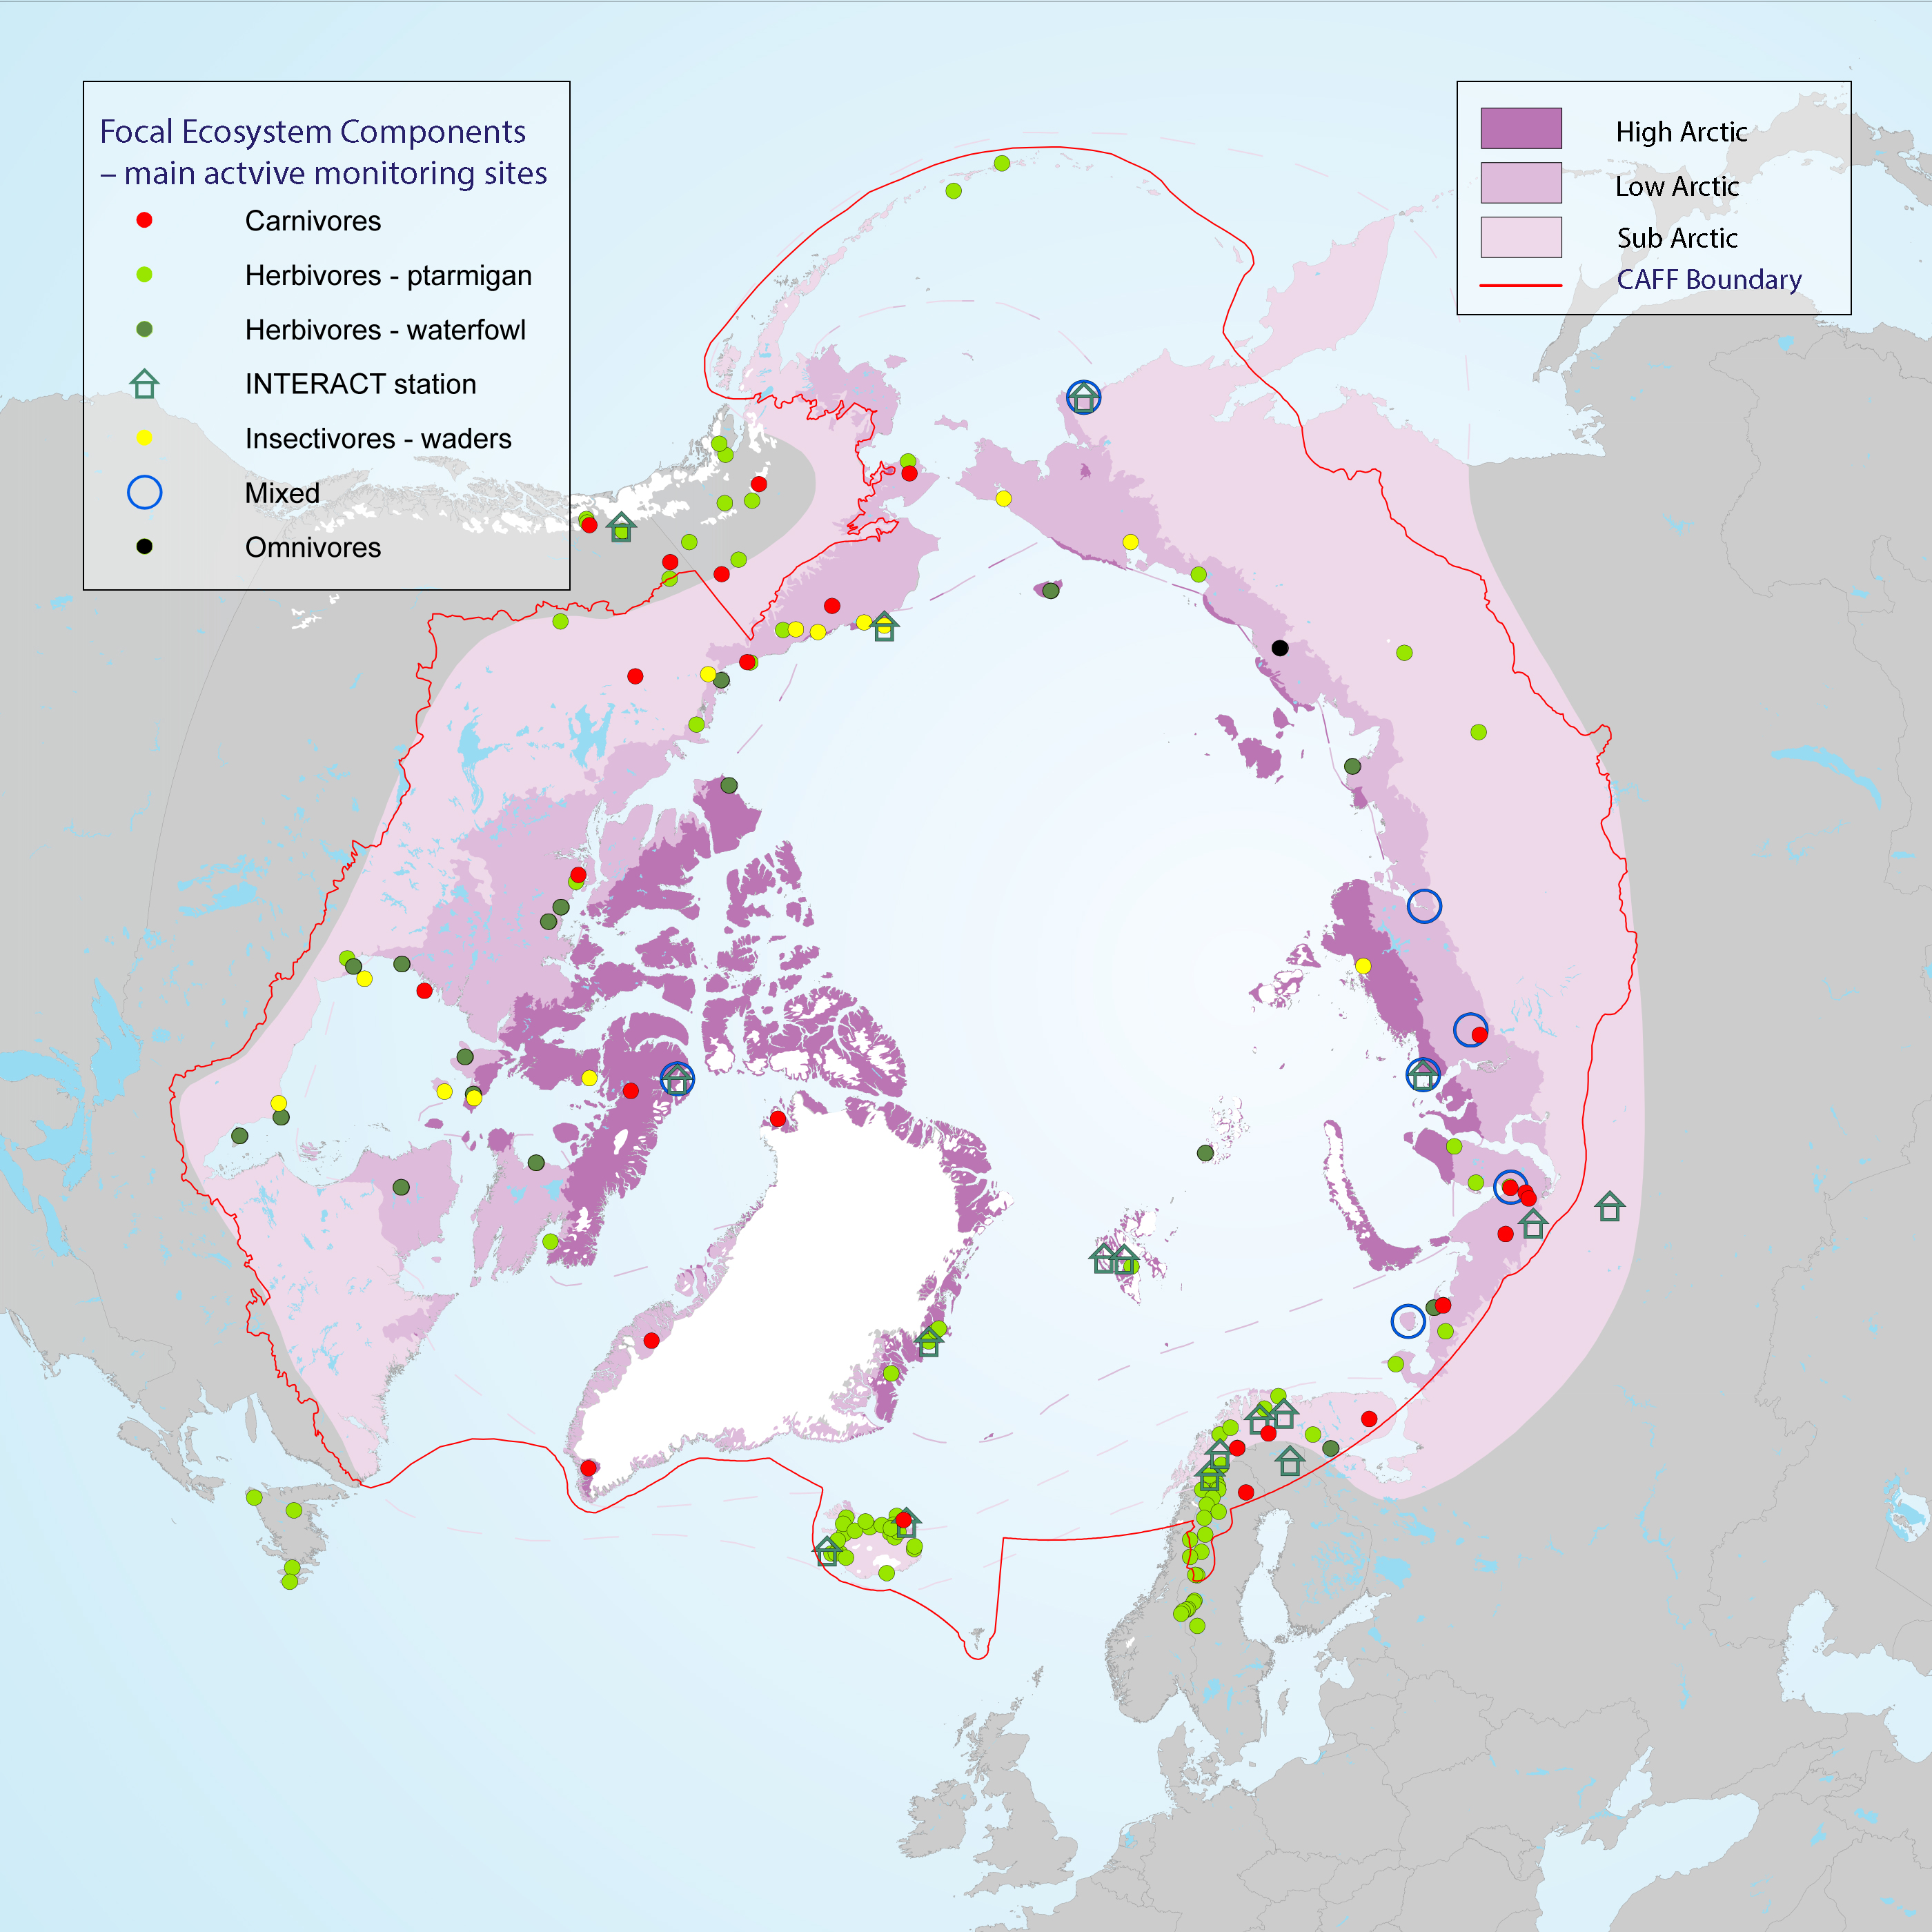
Many population counts of gregarious migrant species, such as waders and geese, take place along the flyways and at wintering grounds outside the Arctic which stresses the importance of continued development of movement ecology studies. Monitoring of FEC attributes related to breeding success and links to environmental drivers within the Arctic takes place in a wide network of research sites across the Arctic, although with low coverage of the high Arctic zone (Figure 3-25) STATE OF THE ARCTIC TERRESTRIAL BIODIVERSITY REPORT - Chapter 3 - Page 58 - Figure 3.25
-
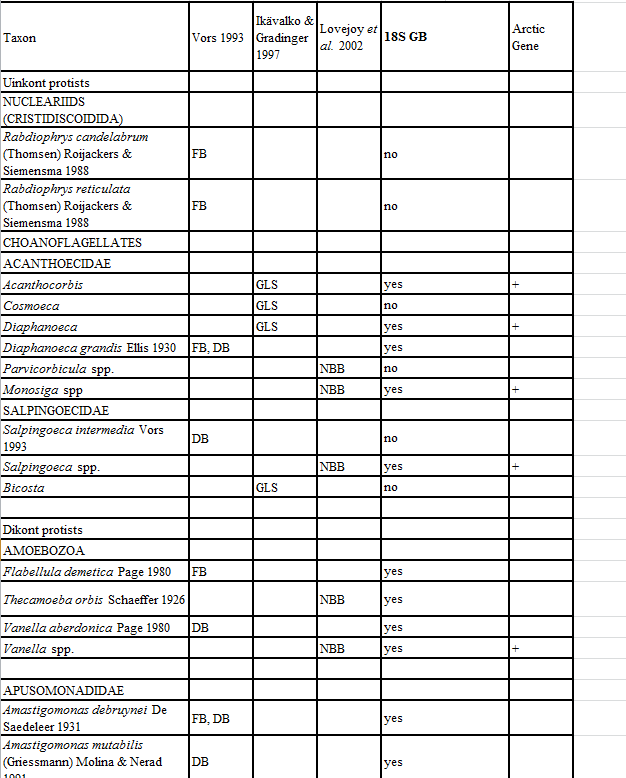
Appendix 11. Taxa of hetorotrophic protists reported from Foxe Basin, Canada (FB), Disko Bay, W Greenland (DB; Vors 1993), the Greenland Sea (GLS; Ikävalko & Gradinger 1997) and Northern Baffin Bay, Canada (NBB; Lovejoy et al. 2002).
-
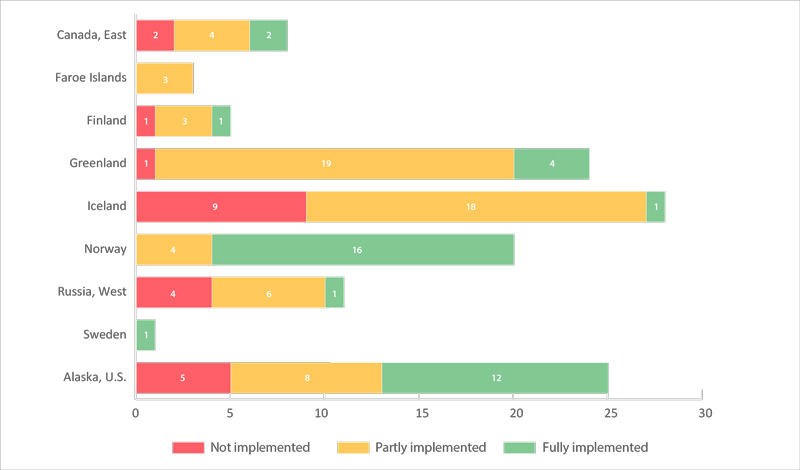
The number of key sites (monitored colonies) for seabirds (in 22 CSMP ecoregions) by country (a total of 125 sites). Sites are categorized as having fully, partially, or not met the CSMP criteria for parameters monitored (see 2.6.2). Data were from Appendix 3 of the CSMP (Irons et al. 2015); the degree of implementation may have changed at some sites since this summary was compiled. STATE OF THE ARCTIC MARINE BIODIVERSITY REPORT - <a href="https://arcticbiodiversity.is/findings/seabirds" target="_blank">Chapter 3</a> - Page 134 - Figure 3.5.2
-
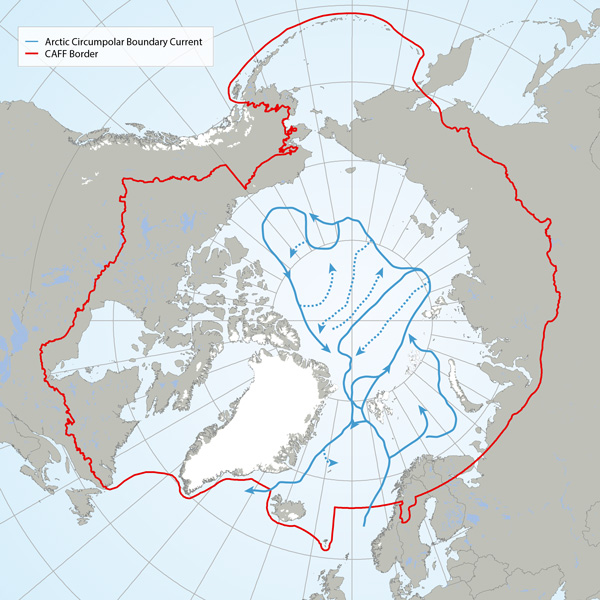
The Arctic Basin where suggested future long-term monitoring of trawl-megafauna should capture possible changes along the flow of the Arctic Circumpolar Boundary Current (Figure A, blue line) and the Arctic deep-water exchange (Figure b, green line). Adapted from Bluhm et al. (2015). STATE OF THE ARCTIC MARINE BIODIVERSITY REPORT - <a href="https://arcticbiodiversity.is/findings/benthos" target="_blank">Chapter 3</a> - Page 88 - Figure 3.3.1
-

Trends in total abundance of moths and species richness, from two locations in Iceland, 1995–2016. Trends differ between locations. The solid and dashed straight lines represent linear regression lines which are significant or non-significant, respectively. Modified from Gillespie et al. 2020a. STATE OF THE ARCTIC TERRESTRIAL BIODIVERSITY REPORT - Chapter 3 - Page 41 - Figure 3.14