 CAFF - Arctic Biodiversity Data Service (ABDS)
Land cover
Type of resources
Available actions
Topics
Keywords
Contact for the resource
Provided by
Years
Formats
Representation types
Update frequencies
status
-

Geographic area covered by the Arctic Biodiversity Assessment and the CBMP–Terrestrial Plan. Subzones A to E are depicted as defined in the Circumpolar Arctic Vegetation Map (CAVM Team 2003). Subzones A, B and C are the high Arctic while subzones D and E are the low Arctic. Definition of high Arctic, low Arctic, and sub-Arctic follow Hohn & Jaakkola 2010. STATE OF THE ARCTIC TERRESTRIAL BIODIVERSITY REPORT - Chapter 1 - Page 14 - Figure 1.2
-
Marine primary productivity is not available from the NASA Ocean Color website. Currently the best product available for marine primary productivity is available through Oregon State University’s Ocean Productivity Project. A monthly global Net Primary Productivity product at 9 km spatial resolution has been selected for this analysis. The algorithm used to create the primary productivity is a Vertically Generalized Production Model (VGPM) created by Behrenfeld and Falkowski (1997). It is a “chlorophyll-based” model that estimates net primary production from chlorophyll using a temperature-dependent description of chlorophyll photosynthetic efficiency (O’Malley 2010). Inputs to the function are chlorophyll, available light, and photosynthetic efficiency.
-

The Arctic terrestrial food web includes the exchange of energy and nutrients. Arrows to and from the driver boxes indicate the relative effect and counter effect of different types of drivers on the ecosystem. STATE OF THE ARCTIC TERRESTRIAL BIODIVERSITY REPORT - Chapter 2 - Page 26- Figure 2.4
-
Conceptual model of Arctic terrestrial mammals, showing FECs, interactions with other biotic groups and examples of drivers and attributes relevant at various spatial scales. STATE OF THE ARCTIC TERRESTRIAL BIODIVERSITY REPORT - Chapter 3 - Page 67 - Figure 3.28
-
Population trends for springtails in Empetrum nigrum plant community in Kobbefjord, Greenland, 2007–2017. (a) mean population abundance of total Collembola in individuals per square metre, (b) mean number of species per sample, and (c) Shannon-Wiener diversity index per sample. Vertical error bars are standard errors of the mean. Solid lines indicate significant regression lines. Modified from Gillespie et al. 2020a. STATE OF THE ARCTIC TERRESTRIAL BIODIVERSITY REPORT - Chapter 3 - Page 40 - Figure 3.13
-

Change in plant phenology over time based on published studies, ranging from 9 to 21 years of duration. The bars show the proportion of observations where timing of phenological events advanced (earlier) was stable or were delayed (later) over time. The darker portions of each bar represent visible decrease, stable state, or increase results, and lighter portions represent marginally significant change. The numbers above each bar indicate the number of observations in that group. Figure from Bjorkman et al. 2020. STATE OF THE ARCTIC TERRESTRIAL BIODIVERSITY REPORT - Chapter 3 - Page 31- Figure 3.3
-

Arctic foxes are currently monitored at 34 sites throughout the North, with most monitoring efforts concentrated in Fennoscandia (Figure 3-32). The duration of monitoring across all sites is variable at between 2 and 56 years and was ongoing at 27 of the 34 sites (79%) as of 2015. Monitoring projects cover almost equally the four climate zones of the species’ distribution—high Arctic, low Arctic, sub-Arctic, and montane/alpine. STATE OF THE ARCTIC TERRESTRIAL BIODIVERSITY REPORT - Chapter 3 - Page 82 - Figure 3.32
-
Circumpolar trends in primary productivity as indicated by the maximum Normalised Difference Vegetation Index, 1982–2017. (a) Brown shading indicates negative MaxNDVI trends, green shading indicates positive MaxNDVI trends. (b) Chart of trends for the circumpolar Arctic, Eurasia, and North America. Modified from Frost et al. 2020. STATE OF THE ARCTIC TERRESTRIAL BIODIVERSITY REPORT - Chapter 3 - Page 30 - Figure 3.1
-

Trends and distribution of muskoxen populations based on Table 3-5. Modified from Cuyler et al. 2020. STATE OF THE ARCTIC TERRESTRIAL BIODIVERSITY REPORT - Chapter 3 - Page 79 - Figure 3.30
-
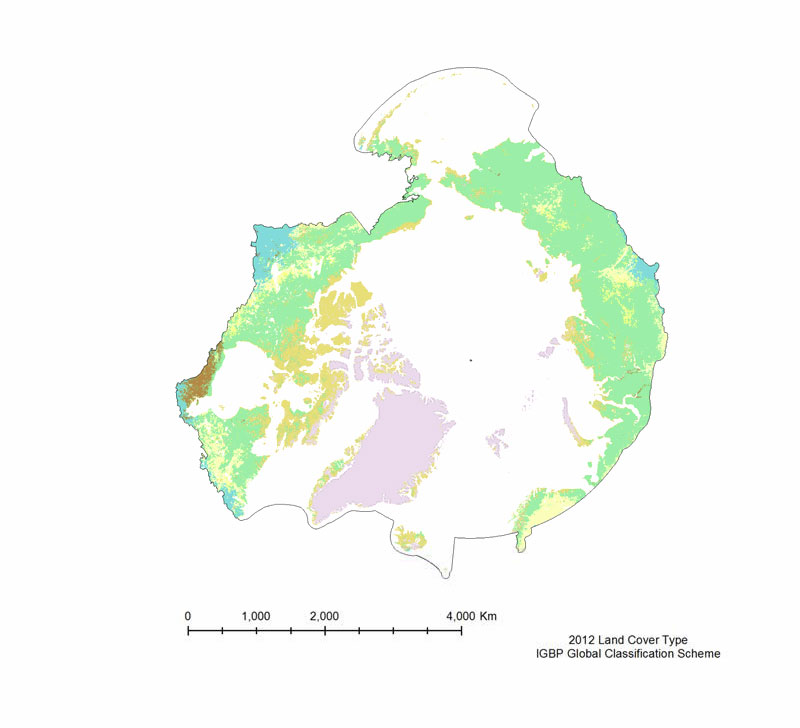
The MODIS Land Cover Type product is created yearly using three landclassification schemes; the International Geosphere Biosphere Programme (IGBP)classification scheme, the Univertiy of Maryland (UMD) classification scheme, and aMODIS-derived Leaf Area Index /Fraction of Photosynthetically Active Radiation(LAI/fPAR) classification scheme (Table 3). The International Geosphere Biosphere Programme (IGBP) identifies seventeenland cover classes, including eleven natural vegetation classes, three non-vegetated landclasses, and three developed land classes. The product provided is derived using the samealgorithm as the 500 m Land Cover Type (MOD12Q1), but is on a 0.05° Climate Model Grid(CMG), that has been clipped to the pan-Arctic extent. The UMD classification scheme issimilar to the IGBP classification scheme, but it excludes the Permanent wetlands,Cropland/Natural vegetation mosaic, and the Snow and ice classes. The LAI/fPARclassification scheme is the smallest of the three, and focuses on forest structure; it only haseleven classes. All three land cover classification schemes are provided, but the IGBPclassification scheme is the most amenable to the Pan-Arctic region.