 CAFF - Arctic Biodiversity Data Service (ABDS)
Conservation of Arctic Flora and Fauna (CAFF)
Type of resources
Available actions
Topics
Keywords
Contact for the resource
Provided by
Years
Formats
Representation types
Update frequencies
status
Service types
Scale
-
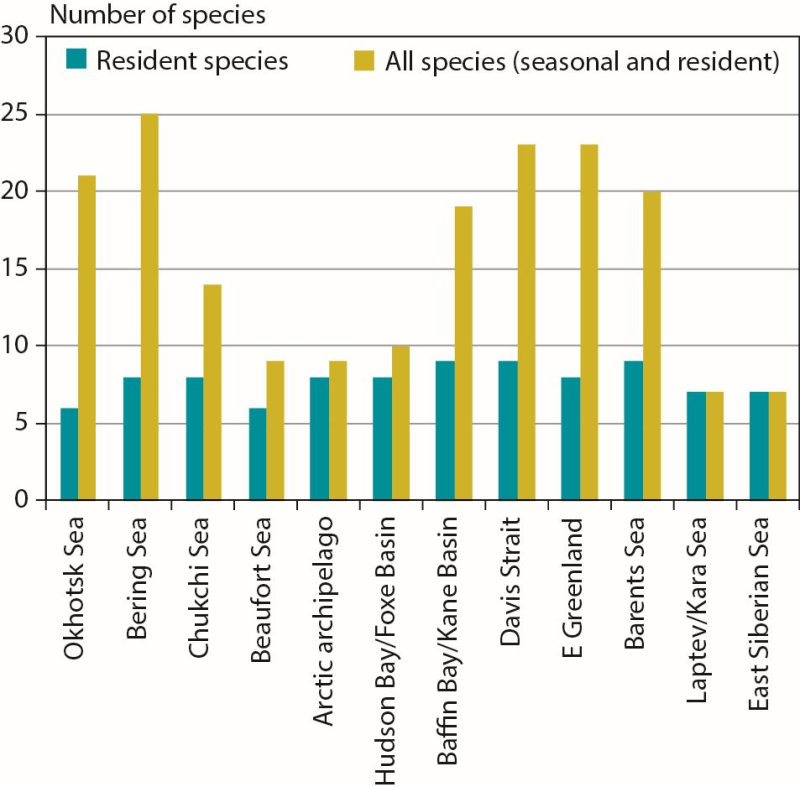
Number of marine mammal species in Arctic marine regions classified by resident species (n = 11 total) or all species (including seasonal visitors, n = 35 total). CAFF 2013. Arctic Biodiversity Assessment. Status and Trends in Arctic biodiversity. Conservation of Arctic Flora and Fauna, Akureyri - Mammal (Chapter 3) page 84
-
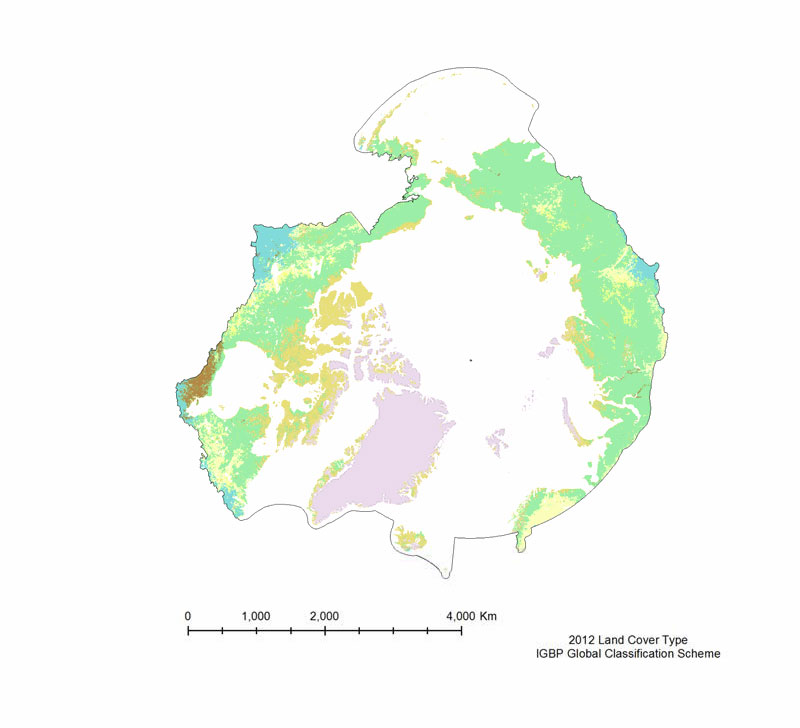
The MODIS Land Cover Type product is created yearly using three landclassification schemes; the International Geosphere Biosphere Programme (IGBP)classification scheme, the Univertiy of Maryland (UMD) classification scheme, and aMODIS-derived Leaf Area Index /Fraction of Photosynthetically Active Radiation(LAI/fPAR) classification scheme (Table 3). The International Geosphere Biosphere Programme (IGBP) identifies seventeenland cover classes, including eleven natural vegetation classes, three non-vegetated landclasses, and three developed land classes. The product provided is derived using the samealgorithm as the 500 m Land Cover Type (MOD12Q1), but is on a 0.05° Climate Model Grid(CMG), that has been clipped to the pan-Arctic extent. The UMD classification scheme issimilar to the IGBP classification scheme, but it excludes the Permanent wetlands,Cropland/Natural vegetation mosaic, and the Snow and ice classes. The LAI/fPARclassification scheme is the smallest of the three, and focuses on forest structure; it only haseleven classes. All three land cover classification schemes are provided, but the IGBPclassification scheme is the most amenable to the Pan-Arctic region.
-
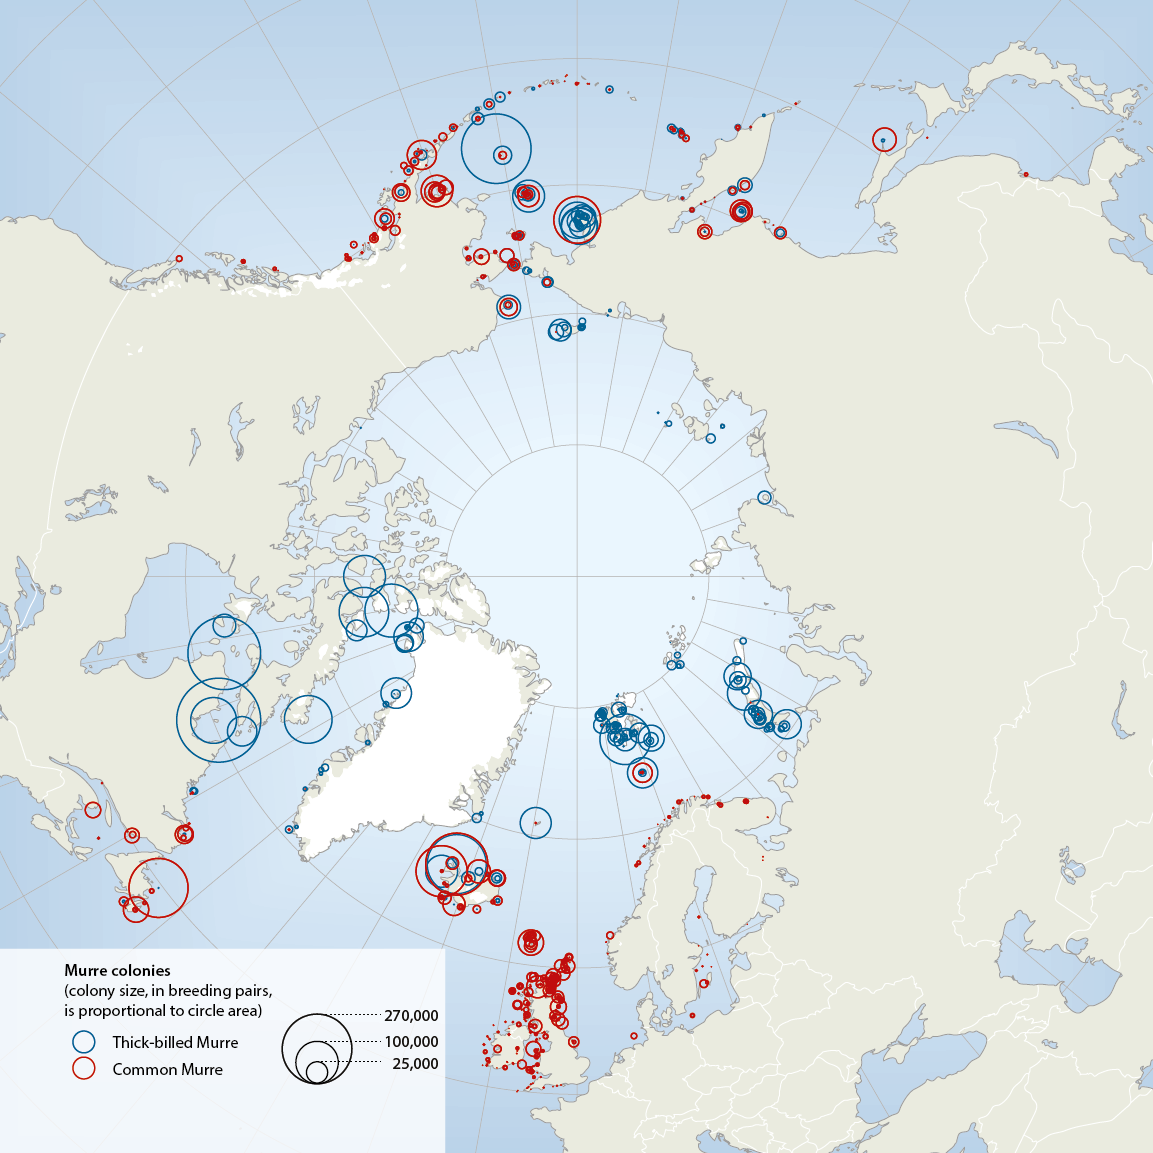
The two species of murres, thick-billed Uria lomvia and common U. aalge, both have circumpolar distributions, breeding in Arctic, sub-Arctic and temperate seas from alifornia and N Spain to N Greenland, high Arctic Canada, Svalbard, Franz Josef Land and Novaya Zemlya (Box 4.3 Fig. 1). Conservation of Arctic Flora and Fauna, CAFF 2013 - Akureyri . Arctic Biodiversity Assessment. Status and Trends in Arctic biodiversity. - Birds(Chapter 4) page 163
-
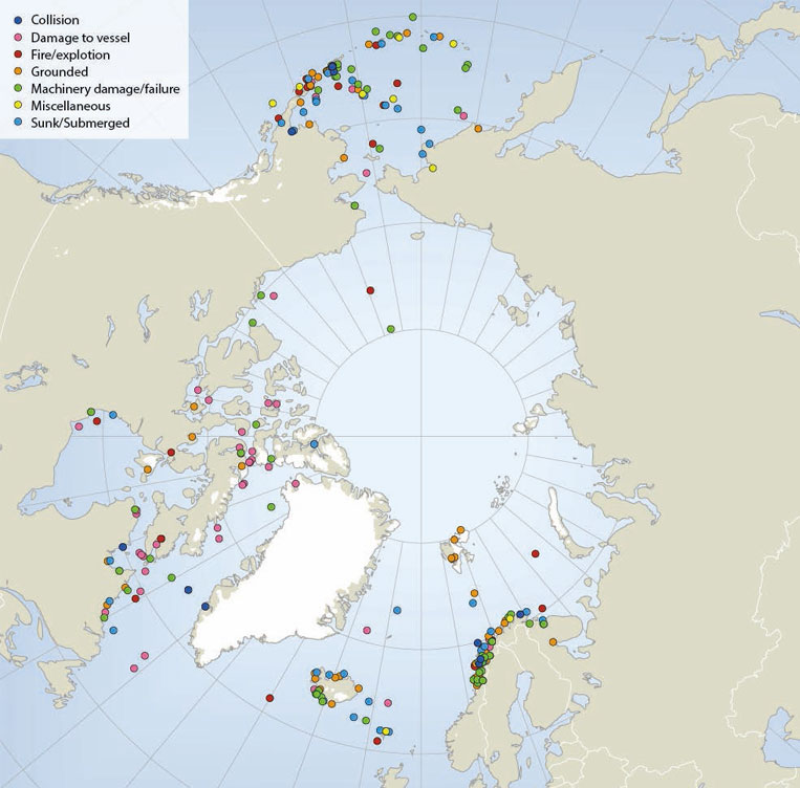
Locations of sub-Arctic and Arctic shipping accidents and incident causes, 1995-2004 (source: Arctic Marine Shipping Assessment 2009). Published in the Arctic Biodiversity Assessment (ABA) released in 2014.
-
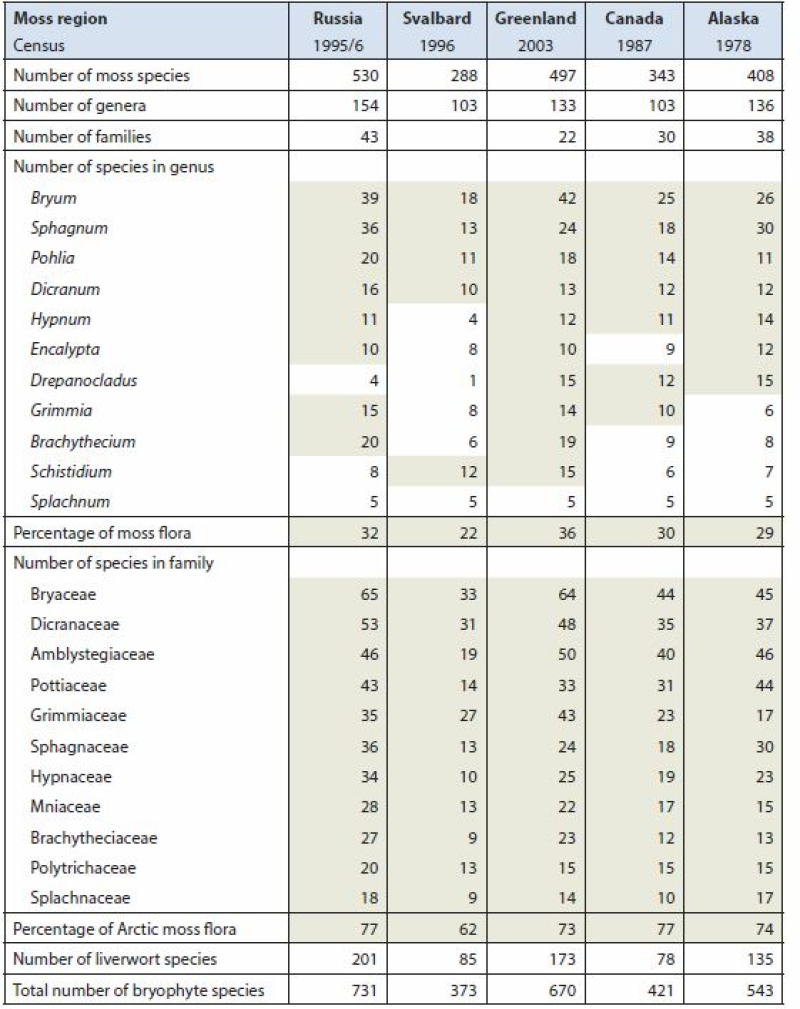
Arctic Biodiversity Assessment (ABA) 2013. Table 9.5. Species numbers of species-rich moss genera and families. Numbers highlighted in grey fields are used in calculating the percentage of the total moss flora. Listed are Splachnum, genera with at least 10 species and families with at least nine species. Conservation of Arctic Flora and Fauna, CAFF 2013 - Akureyri . Arctic Biodiversity Assessment. Status and Trends in Arctic biodiversity. - Plants(Chapter 9) page 333
-
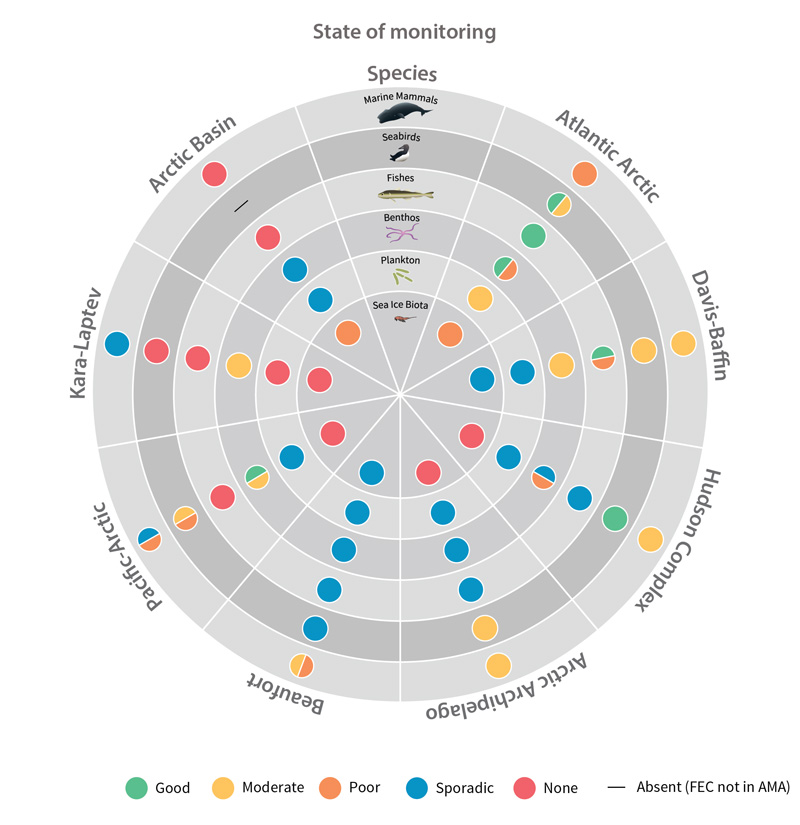
Status of monitoring activities for each Focal Ecosystem Component (i.e., selected species groups) across each Arctic Marine Area as included in this report. STATE OF THE ARCTIC MARINE BIODIVERSITY REPORT - <a href="https://arcticbiodiversity.is/monitoring-status-and-advice" target="_blank">Key Findings</a> - Page 5 - Figure 1
-
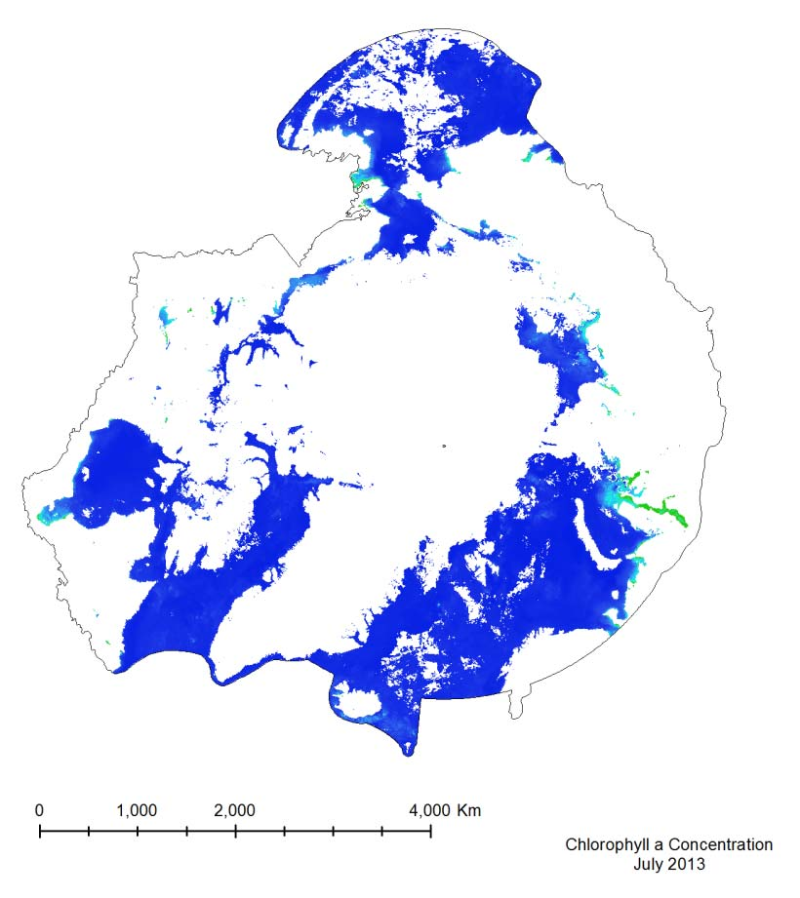
The MODIS marine chlorophyll a product provided, similar to SST, is a 4 km global monthly composite based on smaller resolution daily imagery compiled by NASA. The imagery is reliant on clear ocean (free of clouds and ice) so only months from March to October have been provided, as the chlorophyll levels in the Arctic diminish during the winter months, when sea ice is prevalent. The marine chlorophyll a is measured in mg/m3
-
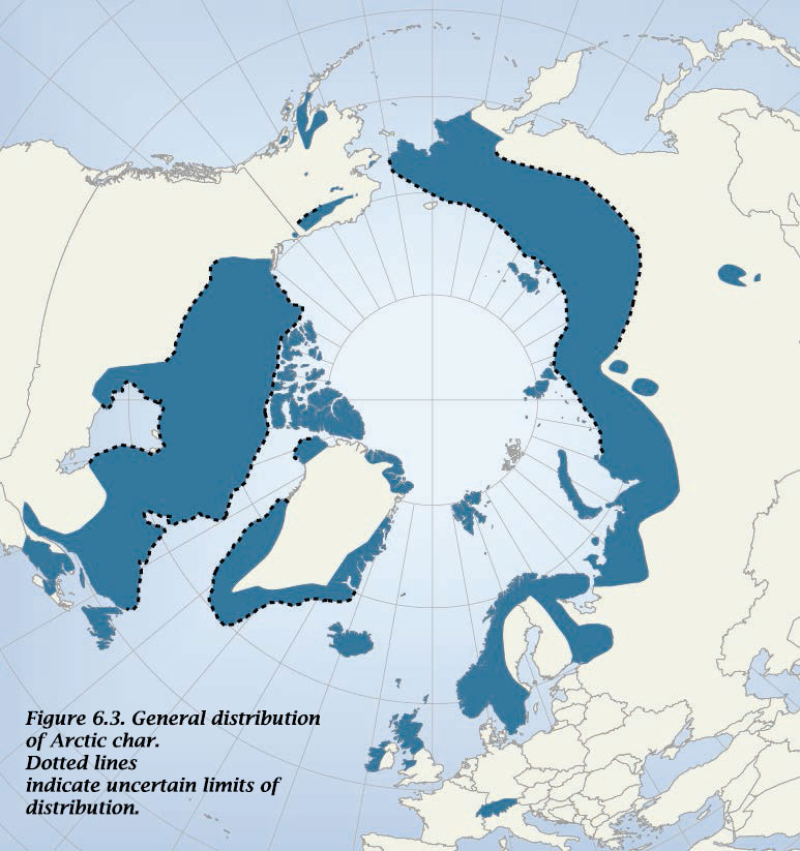
Circumpolar distribution of arctic char species complex Salvelinus alpinus, and related species. - <a href="http://www.caff.is/assessment-series/10-arctic-biodiversity-assessment/211-arctic-biodiversity-assessment-2013-chapter-6-fishes" target="_blank"> Arctic Biodiversity Assessment, Chapter 6: Fishes</a>
-
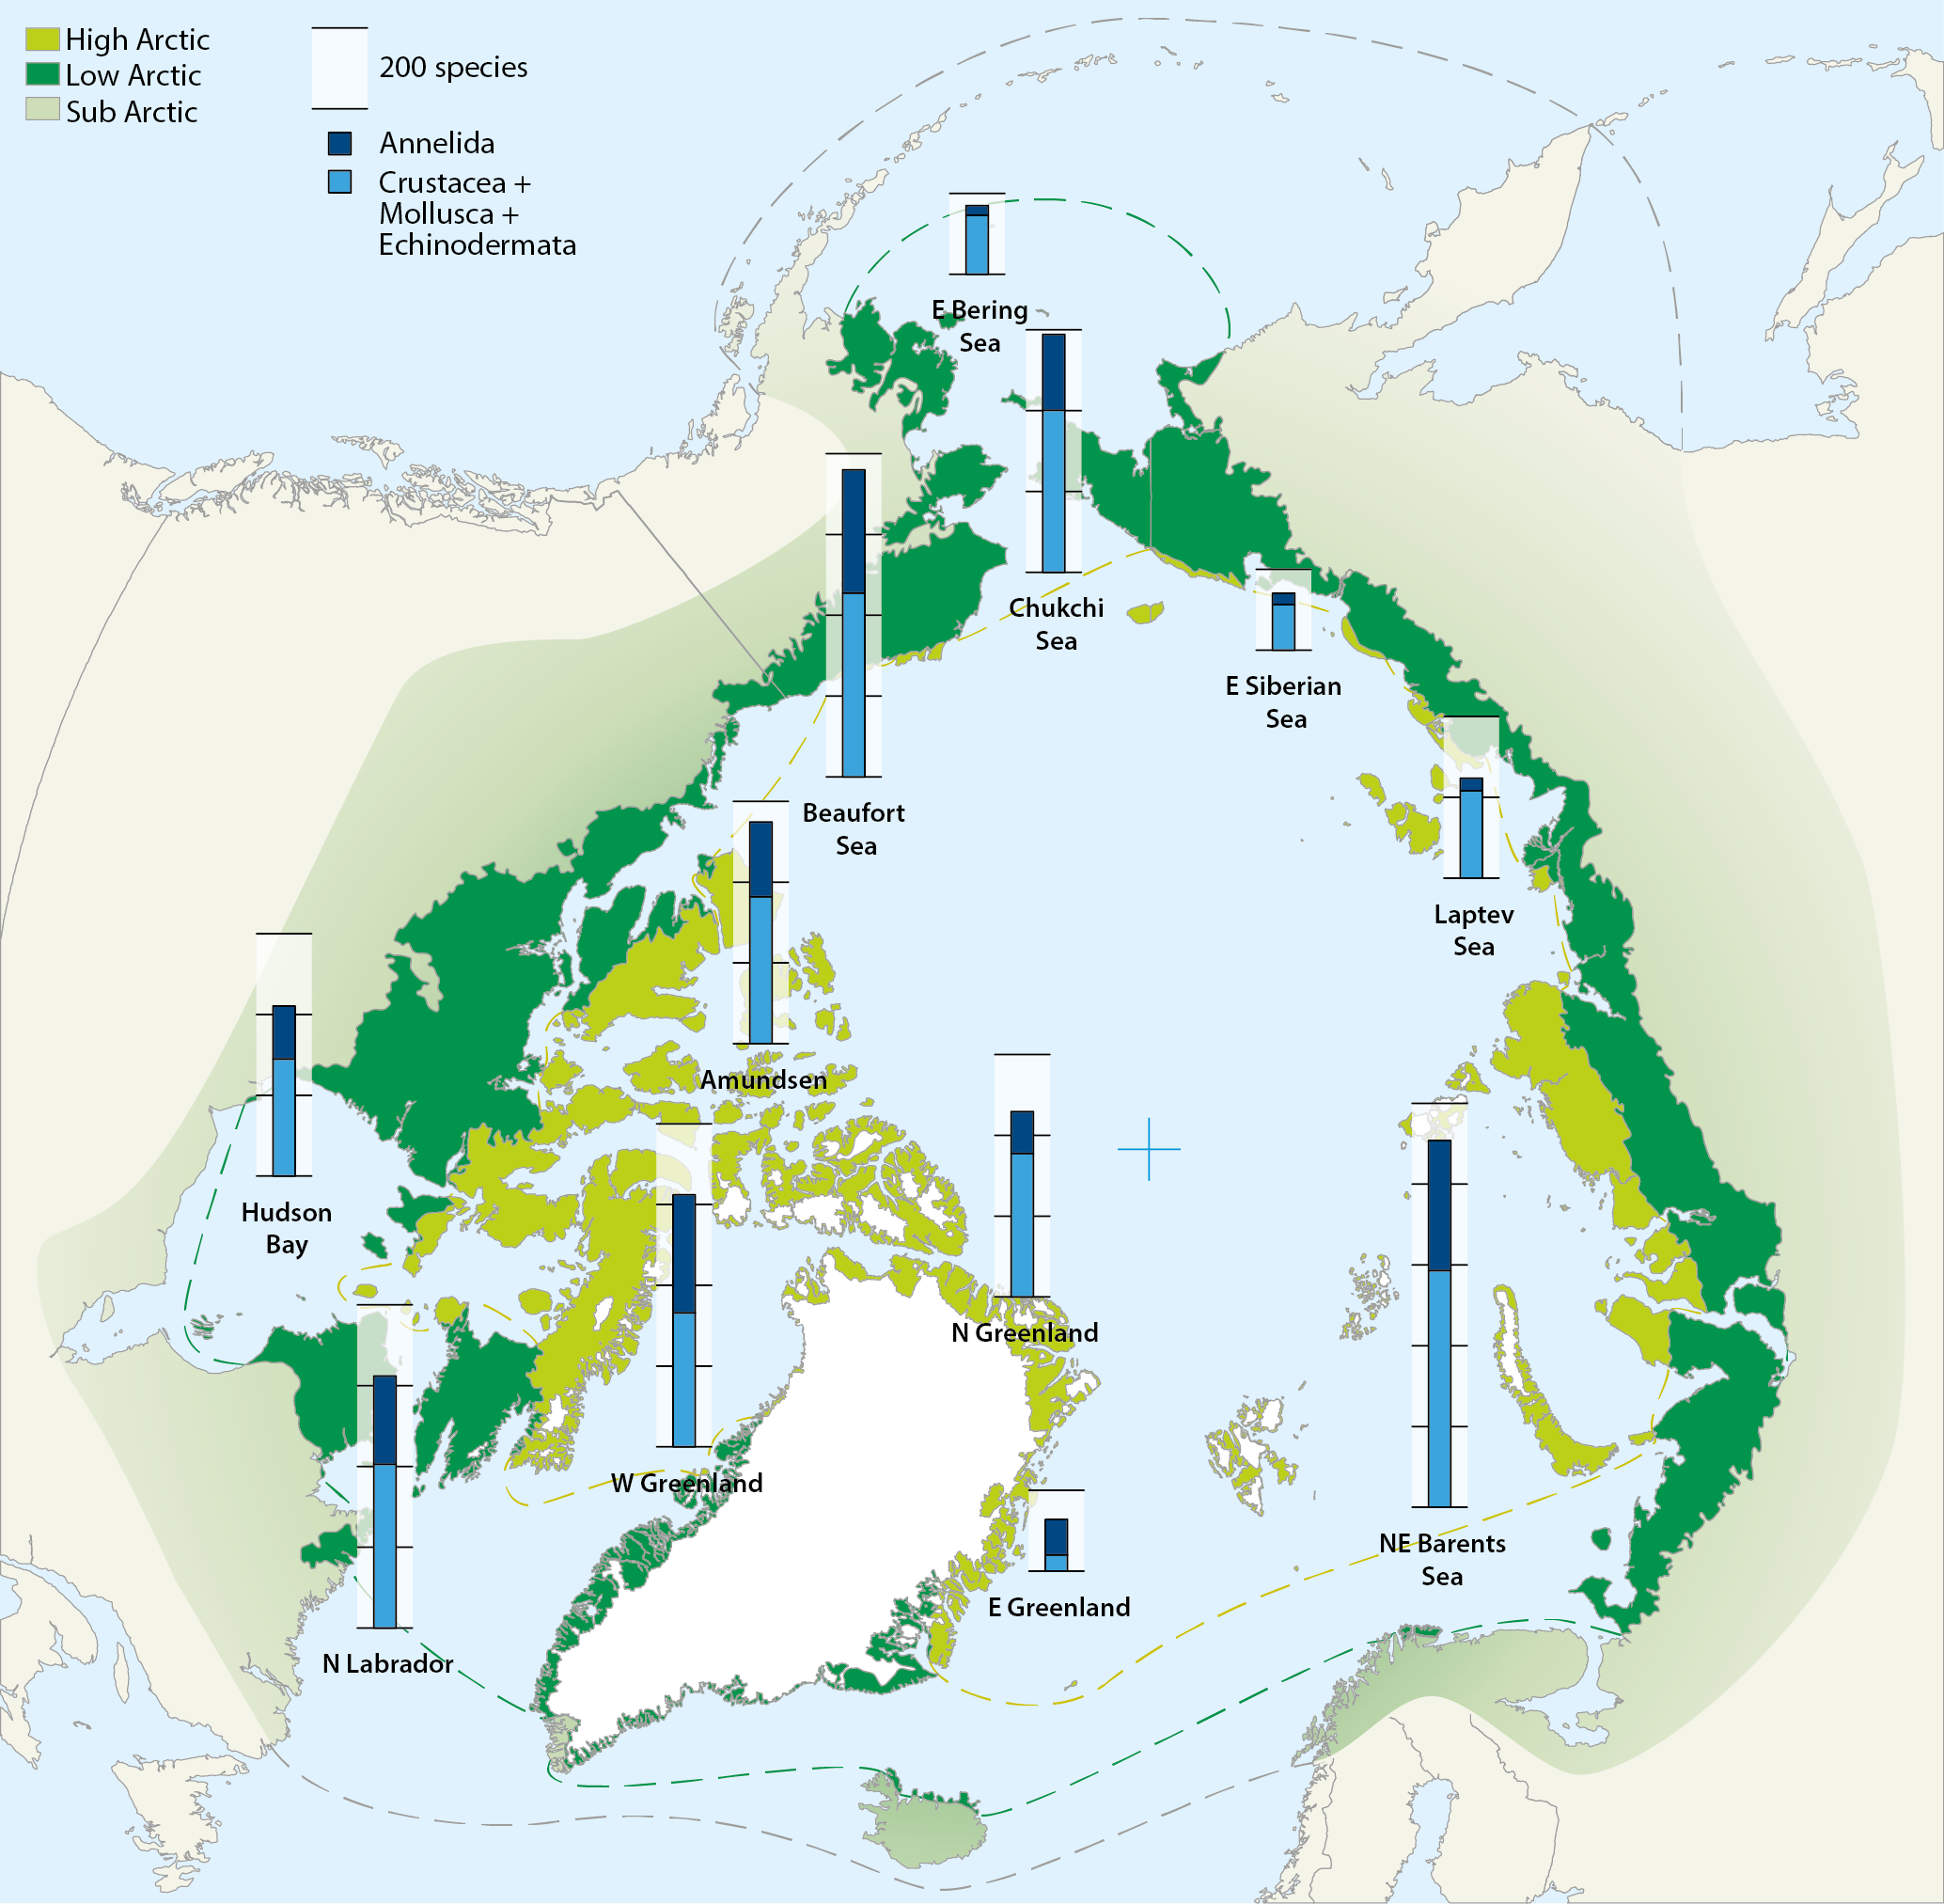
Map of the Arctic Ocean with superimposed stacked bars representing species numbers of macrozoobenthos from different shelf sea areas: Crustacea+Mollusca+Echinodermata (blue) and Annelida (black). Compiled by Piepenburg et al. (2011). Conservation of Arctic Flora and Fauna, CAFF 2013 - Akureyri . Arctic Biodiversity Assessment. Status and Trends in Arctic biodiversity. - Marine Invertebrates(Chapter 8) page 282
-
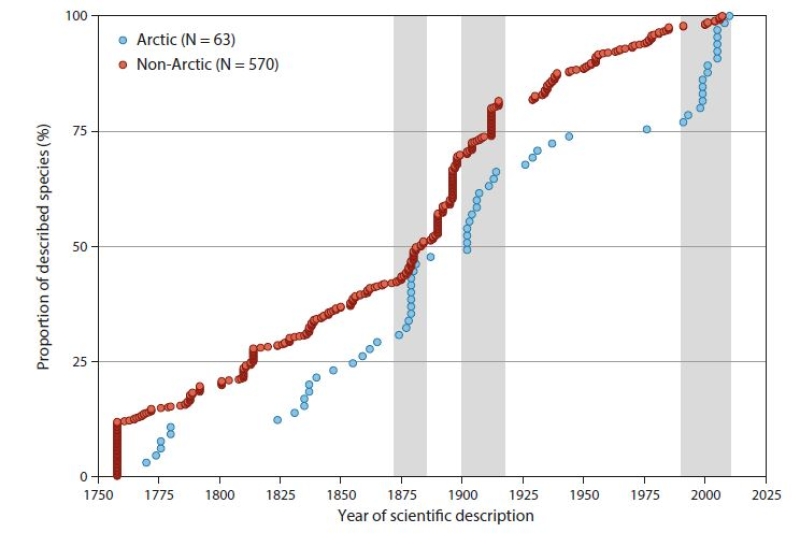
Cumulative numbers of marine fish diversity (n = 633, Appendix 6.2) in the Arctic Ocean and adjacent seas (AOAS) from 1758 to the present. Species are broadly grouped according to zoogeographic pattern (cf. Section 6.3.1): Arctic (A, blue symbols) and non-Arctic (Σ AB, B, WD, red symbols). Grey bars denote periods with many descriptions of new Arctic species. Note that 75% of the non-Arctic species known to science were described by 1912, whereas the same proportion for Arctic species was only reached in 1976. See text for further information. Conservation of Arctic Flora and Fauna, CAFF 2013 - Akureyri . Arctic Biodiversity Assessment. Status and Trends in Arctic biodiversity. - Fishes(Chapter 6) page 220