 CAFF - Arctic Biodiversity Data Service (ABDS)
START
Type of resources
Available actions
Topics
Keywords
Contact for the resource
Provided by
Representation types
Update frequencies
status
-

Geographic area covered by the Arctic Biodiversity Assessment and the CBMP–Terrestrial Plan. Subzones A to E are depicted as defined in the Circumpolar Arctic Vegetation Map (CAVM Team 2003). Subzones A, B and C are the high Arctic while subzones D and E are the low Arctic. Definition of high Arctic, low Arctic, and sub-Arctic follow Hohn & Jaakkola 2010. STATE OF THE ARCTIC TERRESTRIAL BIODIVERSITY REPORT - Chapter 1 - Page 14 - Figure 1.2
-

The Arctic terrestrial food web includes the exchange of energy and nutrients. Arrows to and from the driver boxes indicate the relative effect and counter effect of different types of drivers on the ecosystem. STATE OF THE ARCTIC TERRESTRIAL BIODIVERSITY REPORT - Chapter 2 - Page 26- Figure 2.4
-

Trends in total abundance of moths and species richness, from two locations in Iceland, 1995–2016. Trends differ between locations. The solid and dashed straight lines represent linear regression lines which are significant or non-significant, respectively. Modified from Gillespie et al. 2020a. STATE OF THE ARCTIC TERRESTRIAL BIODIVERSITY REPORT - Chapter 3 - Page 41 - Figure 3.14
-

Arctic foxes are currently monitored at 34 sites throughout the North, with most monitoring efforts concentrated in Fennoscandia (Figure 3-32). The duration of monitoring across all sites is variable at between 2 and 56 years and was ongoing at 27 of the 34 sites (79%) as of 2015. Monitoring projects cover almost equally the four climate zones of the species’ distribution—high Arctic, low Arctic, sub-Arctic, and montane/alpine. STATE OF THE ARCTIC TERRESTRIAL BIODIVERSITY REPORT - Chapter 3 - Page 82 - Figure 3.32
-

Trends and distribution of muskoxen populations based on Table 3-5. Modified from Cuyler et al. 2020. STATE OF THE ARCTIC TERRESTRIAL BIODIVERSITY REPORT - Chapter 3 - Page 79 - Figure 3.30
-
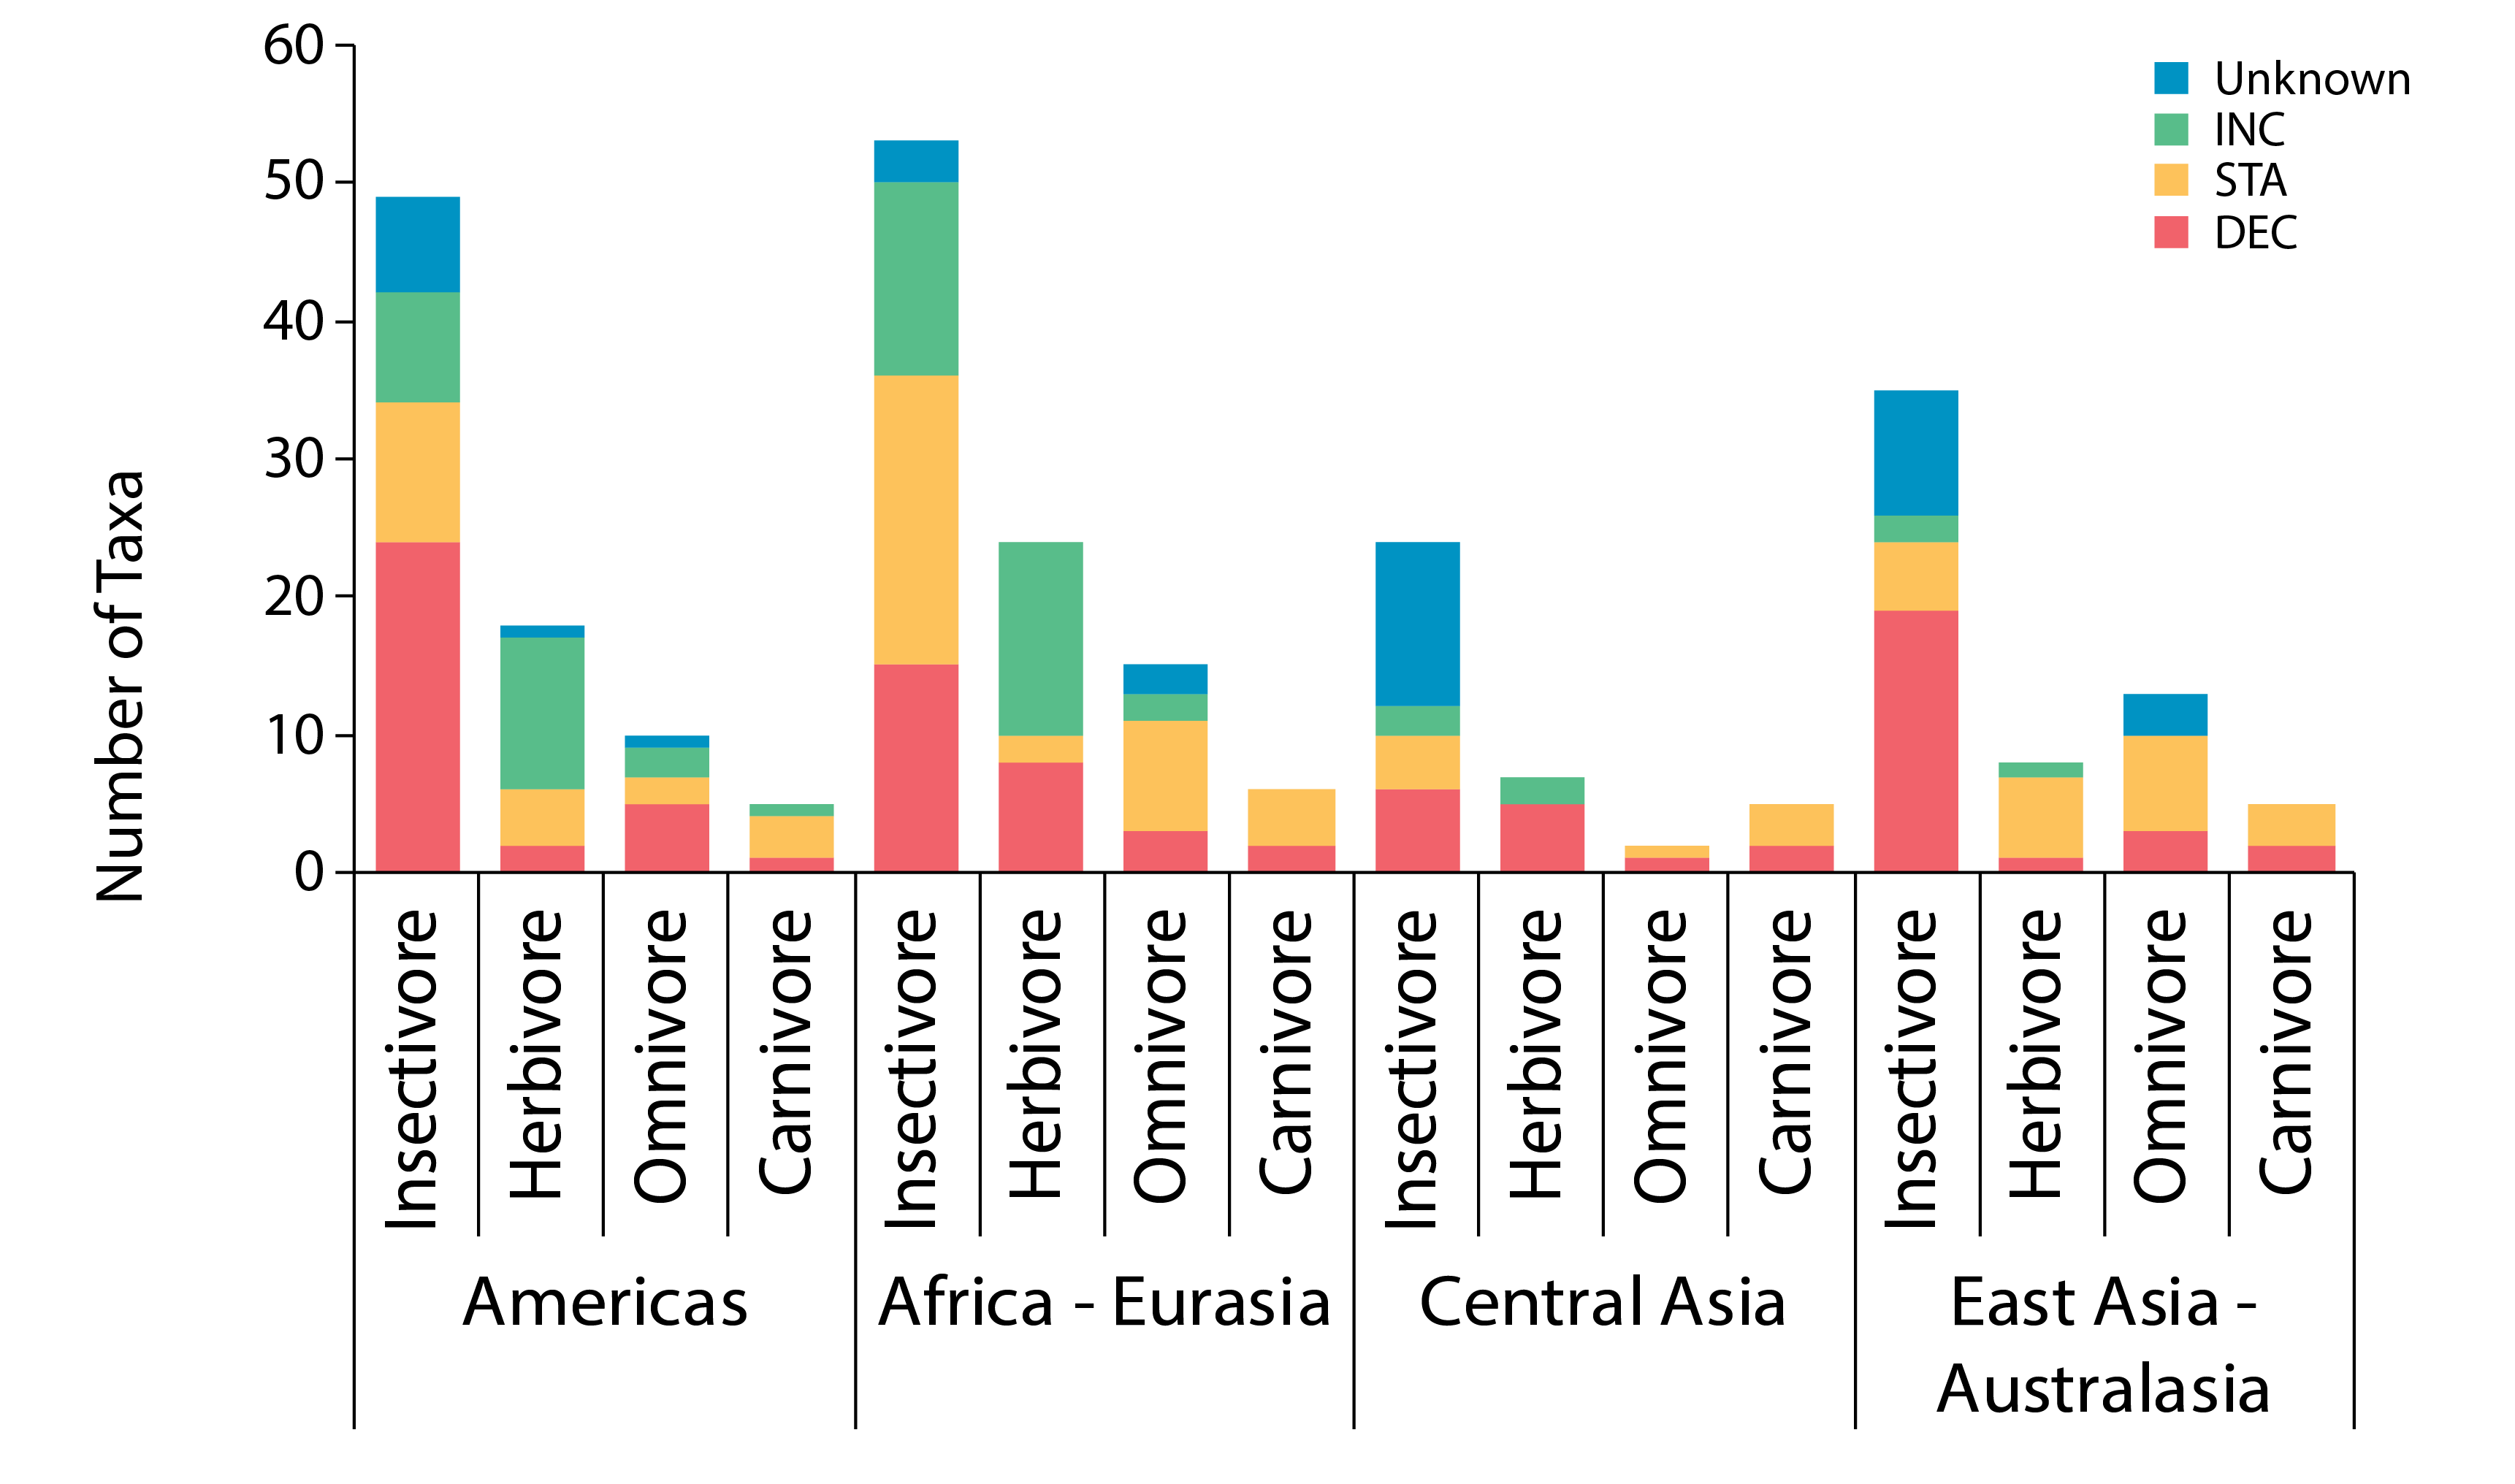
Regional differences are more pronounced in the insectivore guild (Figure 3-24). Although diversity of waders was moderate in the East Asian–Australasian Flyway, 88% (15 of 17) of taxa with known trends were declining—the largest proportion of any group. Both short-term (the last 15 years) and long-term (more than 30 years) trends were available for 157 taxa. Trends were unchanged over the two time periods for 80% of taxa, improved for 11% and worsened for 9%.. STATE OF THE ARCTIC TERRESTRIAL BIODIVERSITY REPORT - Chapter 3 - Page 56 - Figure 3.24
-
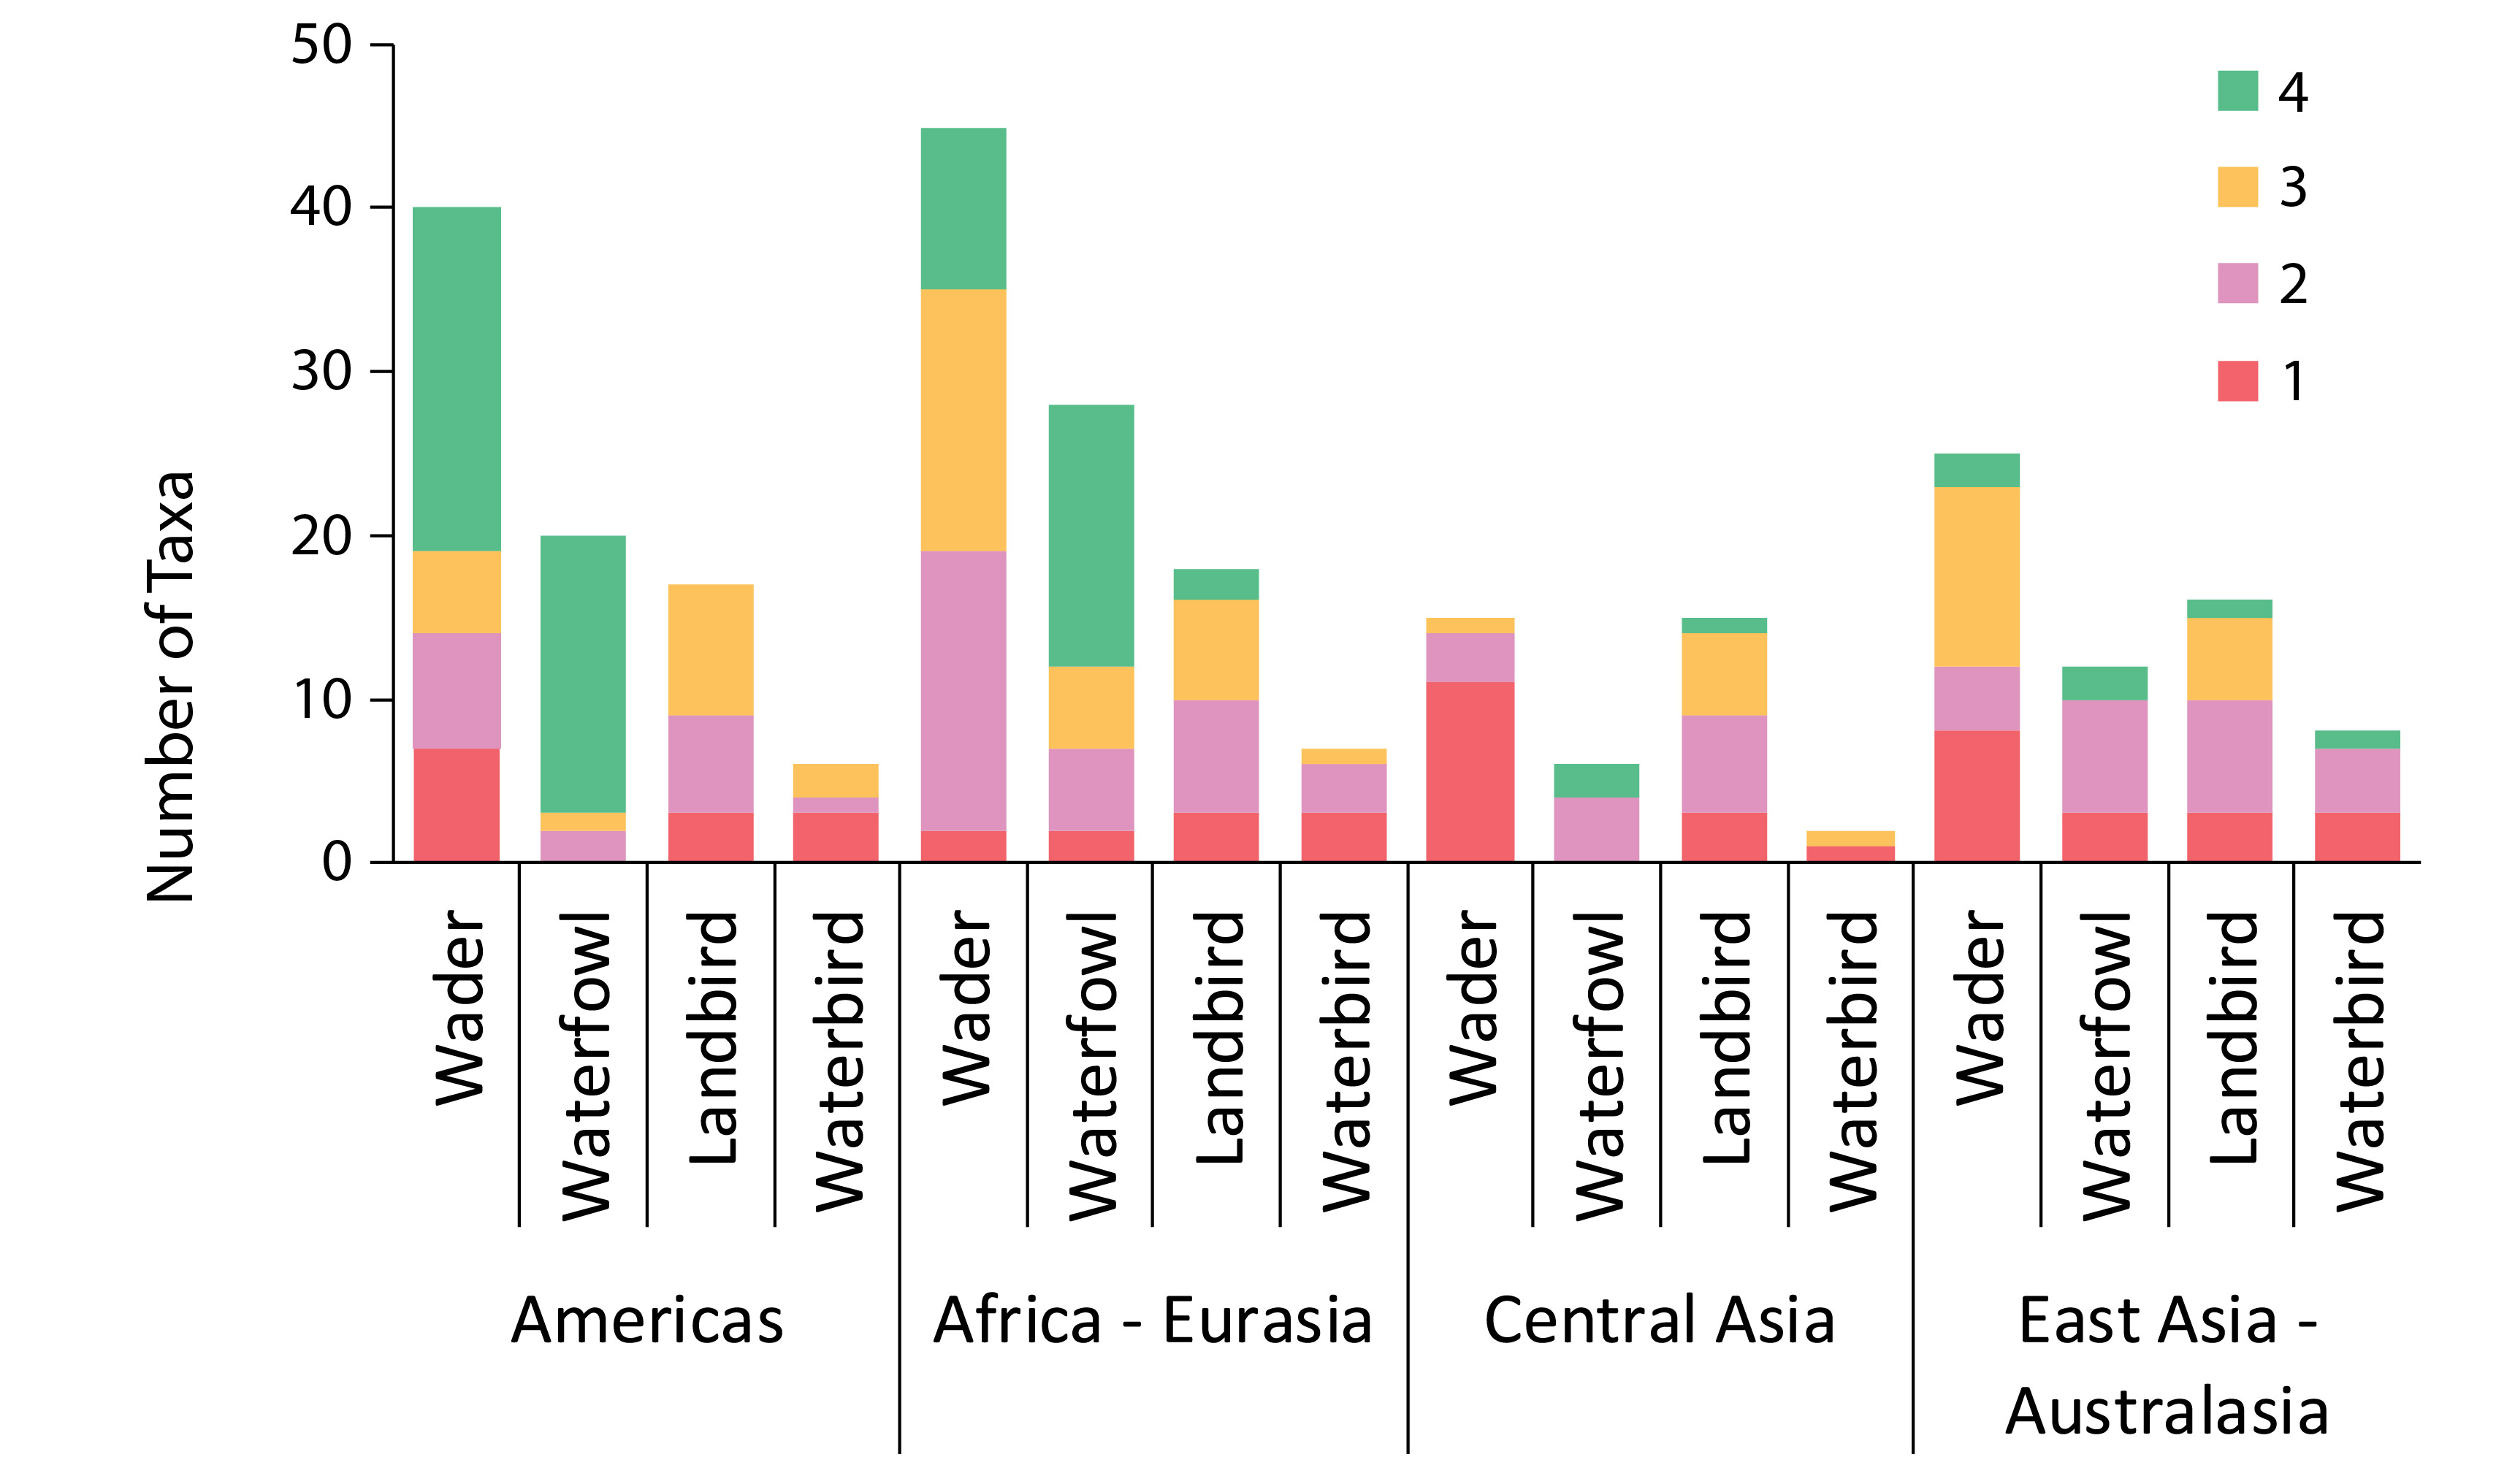
Trend quality categories are: (1) data are lacking such that trends are unknown, (2) regional and site-specific monitoring allow for assumptions of trend, (3) international monitoring allows estimation of trend direction, and (4) rigorously designed international monitoring programmes yield estimates of precision. Modified from Smith et al. 2020. STATE OF THE ARCTIC TERRESTRIAL BIODIVERSITY REPORT - Chapte31 - Page 59 - Figure 3.26
-
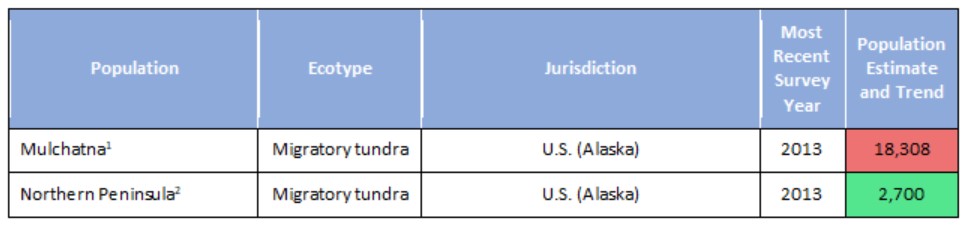
Population estimates and trends for Rangifer populations of the migratory tundra, Arctic island, mountain, and forest ecotypes where their circumpolar distribution intersects the CAFF boundary. Population trends (Increasing, Stable, Decreasing, or Unknown) are indicated by shading. Data sources for each population are indicated as footnotes. STATE OF THE ARCTIC TERRESTRIAL BIODIVERSITY REPORT - Chapter 3 - Page 70 - Table 3.4
-
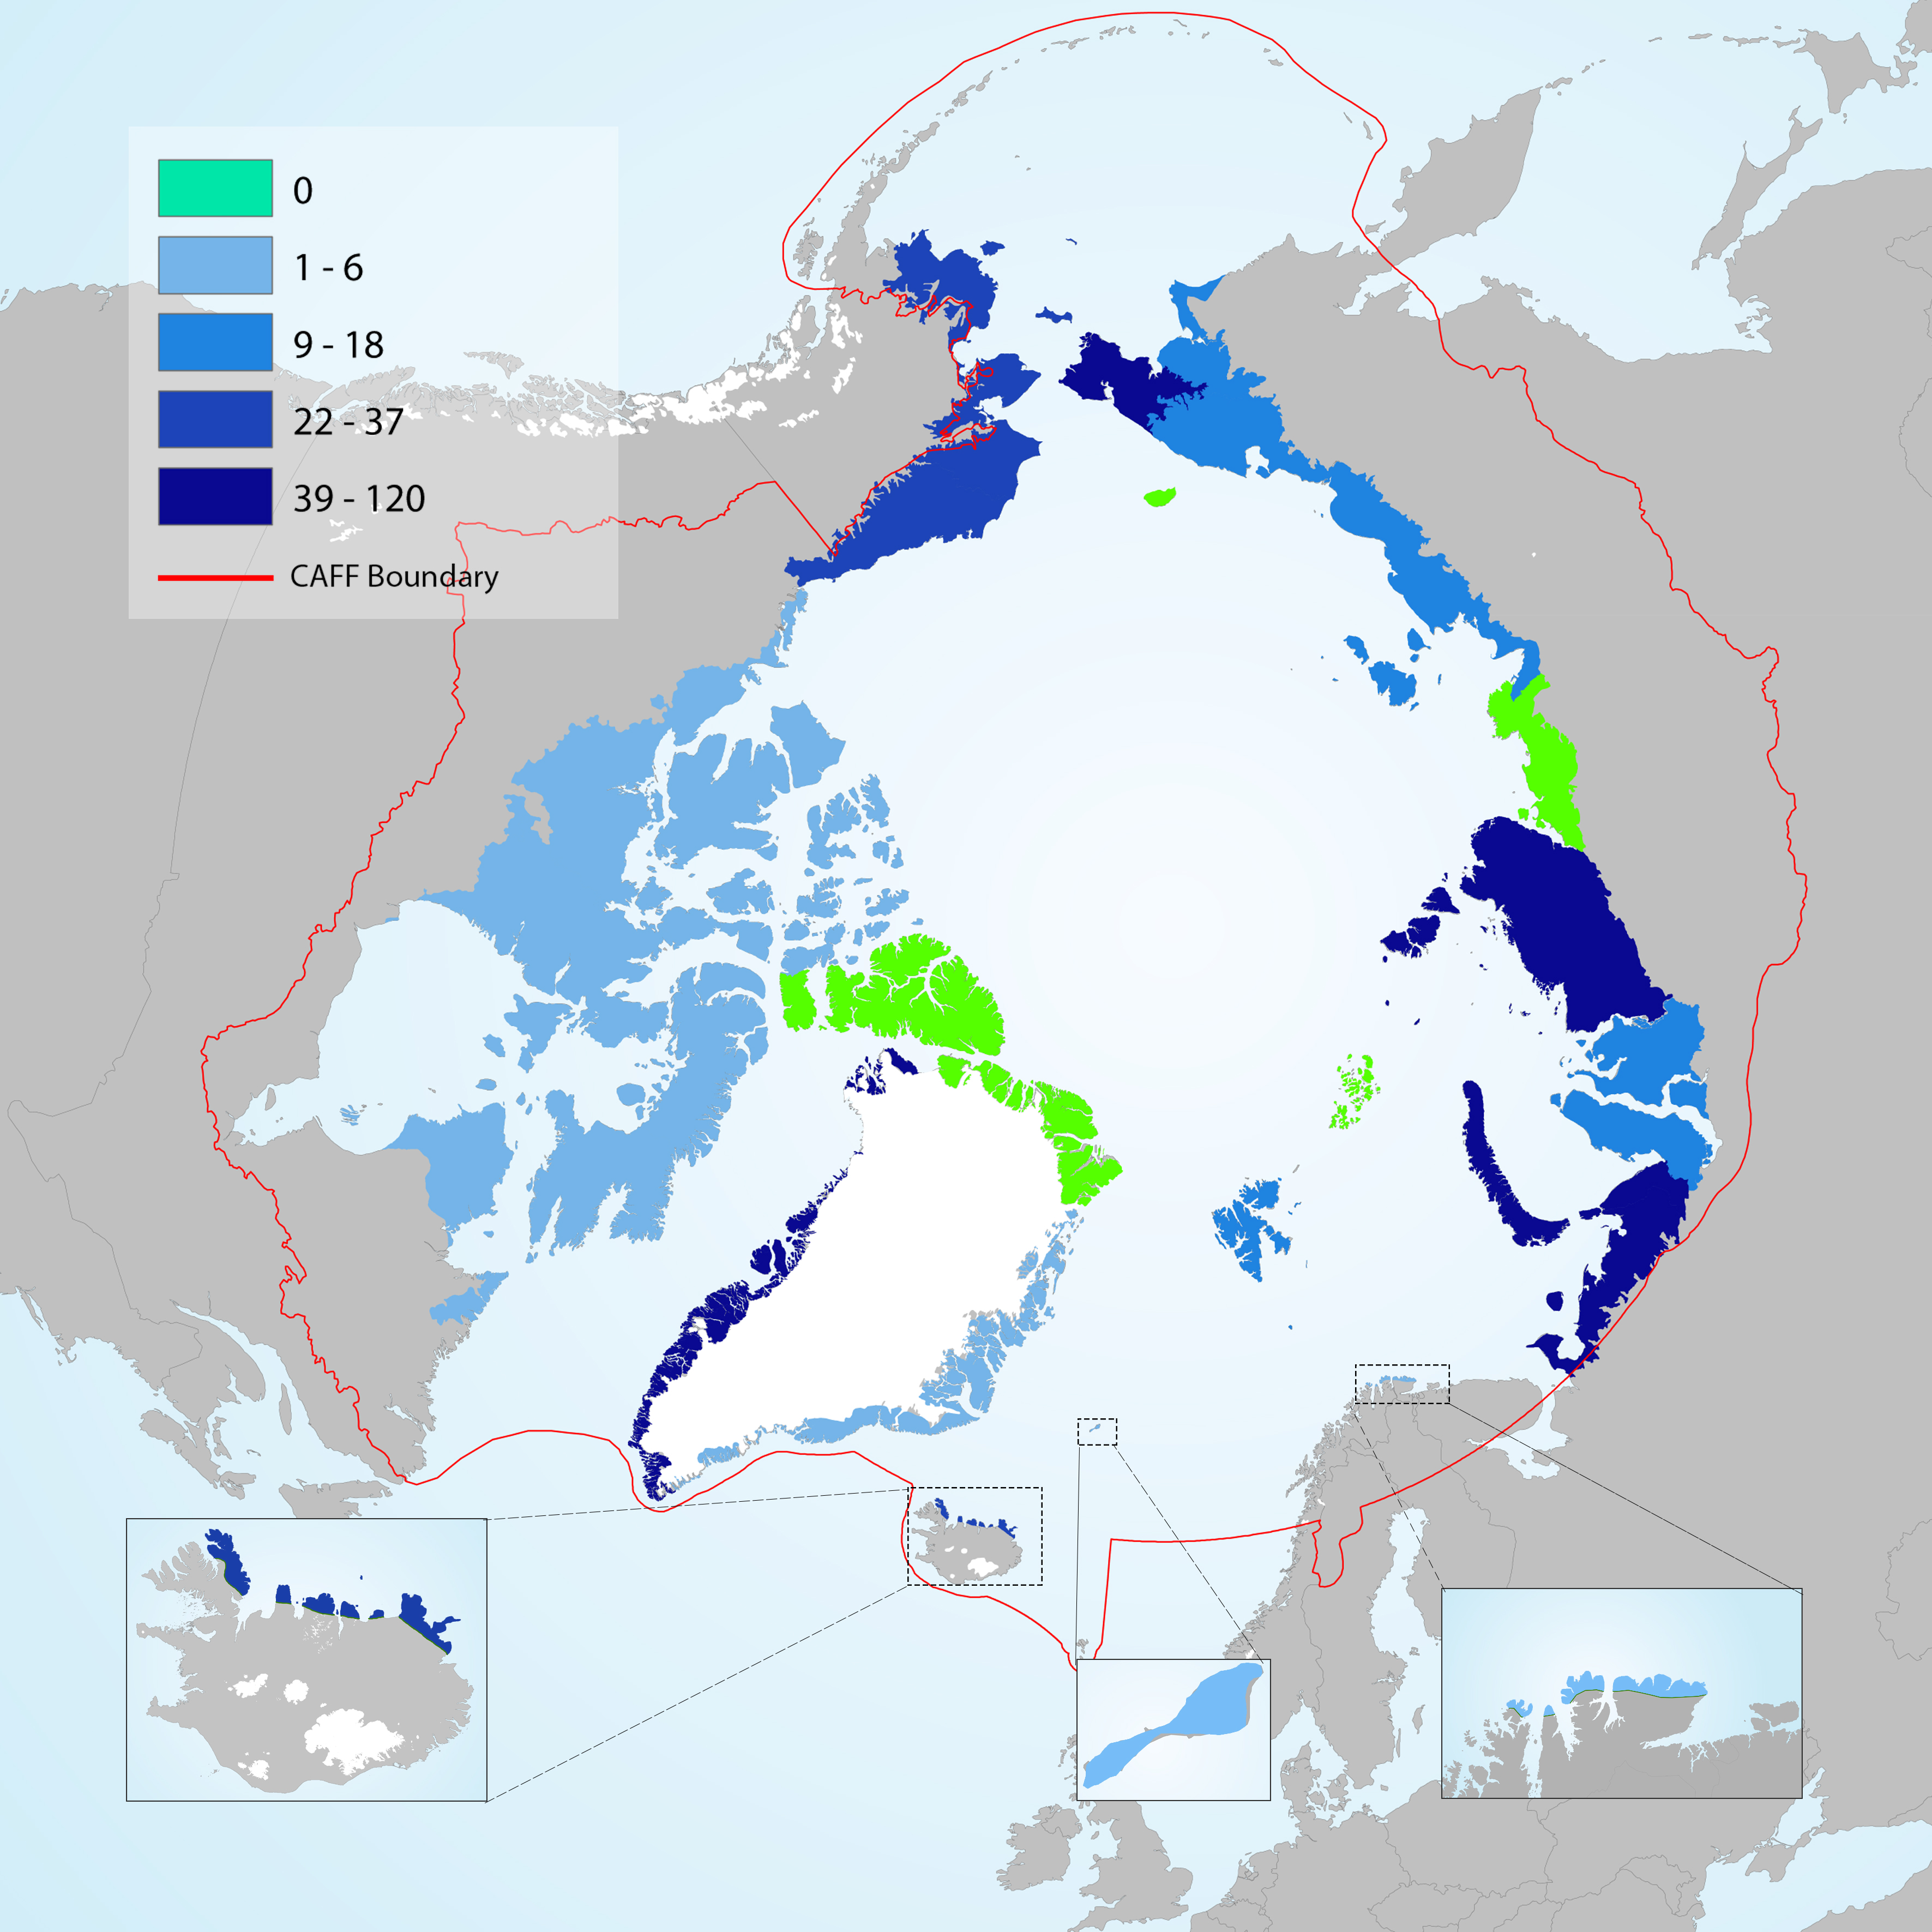
Number of non-native plant taxa that have become naturalised across the Arctic. No naturalised non-native taxa are recorded from Wrangel Island, Ellesmere Land – northern Greenland, Anabar-Olenyok and Frans Josef Land. Modified from Wasowicz et al. 2020 STATE OF THE ARCTIC TERRESTRIAL BIODIVERSITY REPORT - Chapter 3 - Page 32 - Figure 3.4
-

Temporal trends of arthropod abundance, 1996–2009. Estimated by the number of individuals caught per trap per day during the season from four different pitfall trap plots, each consisting of eight (1996–2006) or four (2007–2009) traps. Modified from Høye et al. 2013. STATE OF THE ARCTIC TERRESTRIAL BIODIVERSITY REPORT - Chapter 3 - Page 41 - Figure 3.16