 CAFF - Arctic Biodiversity Data Service (ABDS)
Barents Sea
Type of resources
Available actions
Topics
Keywords
Contact for the resource
Provided by
Representation types
Update frequencies
status
-
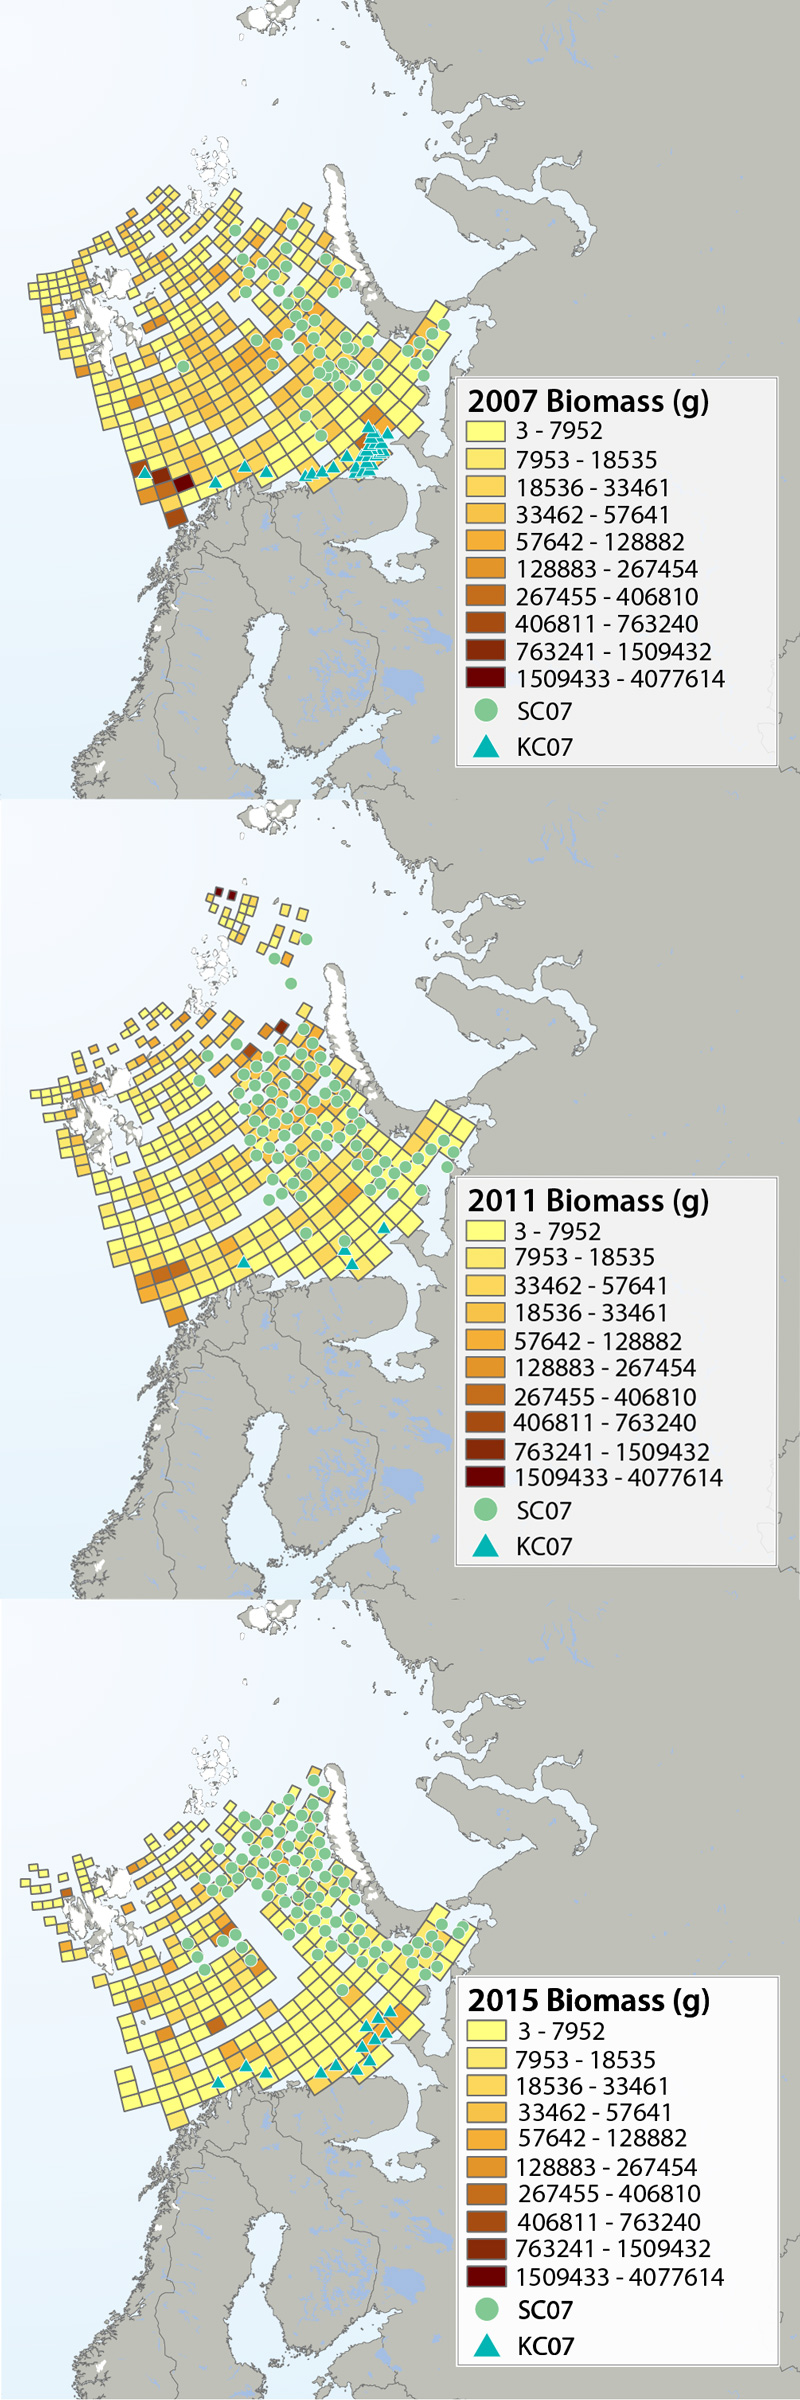
Megafauna distribution of biomass (g/15 min trawling) in the Barents Sea in 2007, 2011 and 2015. The green circles show the distribution of the snow crab as it spreads from east to west, and the blue triangles show the invasion of king crab along the coast of the southern Barents Sea. Data from Institute of Marine Research, Norway and the Polar Research Institute of Marine Fisheries and Oceanography, Murmansk, Russia. STATE OF THE ARCTIC MARINE BIODIVERSITY REPORT - <a href="https://arcticbiodiversity.is/findings/benthos" target="_blank">Chapter 3</a> - Page 95 - Figure 3.3.2 The annual joint Norwegian–Russian Ecosystem Survey provides from more than 400 stations and during extensive cruise tracks covering more or less the whole Barents Sea in August– September. The sampling is based on a regular grid spanning about 1.5 millionkm2 with fixed positions of stations which make it possible to measure changes in spatial distribution over time. The trawl is a Campelen 1800 bottom trawl rigged with rock-hopper groundgear and towed on double Warps. The mesh size is 80 mm (stretched) in the front and 16–22 mmin the cod end, allowing the capture and retention of smaller fish and the largest benthos from the seabed (benthic megafauna). The horizontal opening was 11.7 m, and the vertical opening 4–5 m (Teigsmark and Øynes, 1982). The trawl configuration and bottom contact was monitored remotely by SCANMAR trawl sensors. The standard distance between trawl stations was 35 nautical miles (65 km), except north and west of Svalbard where a stratified sampling was adapted to the steep continental shelve. The standard procedure was to tow 15 min after the trawl had made contact with the bottom, but the actual tow duration ranged between 5 min and 1 h and data were subsequently standardized to 15 min trawl time. Towing speed was 3 knots, equivalent to a towing distance of 0.75 nautical miles (1.4 km) during a 15 min tow. The trawl catches were recorded using the same procedures on the Russian and the Norwegian Research vessels to ensure comparability across Barents Sea regions. The benthic megafauna was separated from the fish and shrimp catch, washed, and sorted to lowest possible taxonomic level, in most cases to species, on-Board the vessel. Species identification was standardized between the researcher teams by annually exchanging the benthic expert’s among the vessels and taxon names were fixed each year according toWORMSwhen possible.This resulted in an Electronic identification manual and photo-compendium as a tool to standardize taxon identifications, in addition to various sources of identification literature. Difficult taxa were photographed and, in some cases, brought back as preserved voucher specimens for further identification. Wet-weight biomass was recorded with electronic scales in the ship laboratories for each taxon.The biomass determination included all fragments.
-
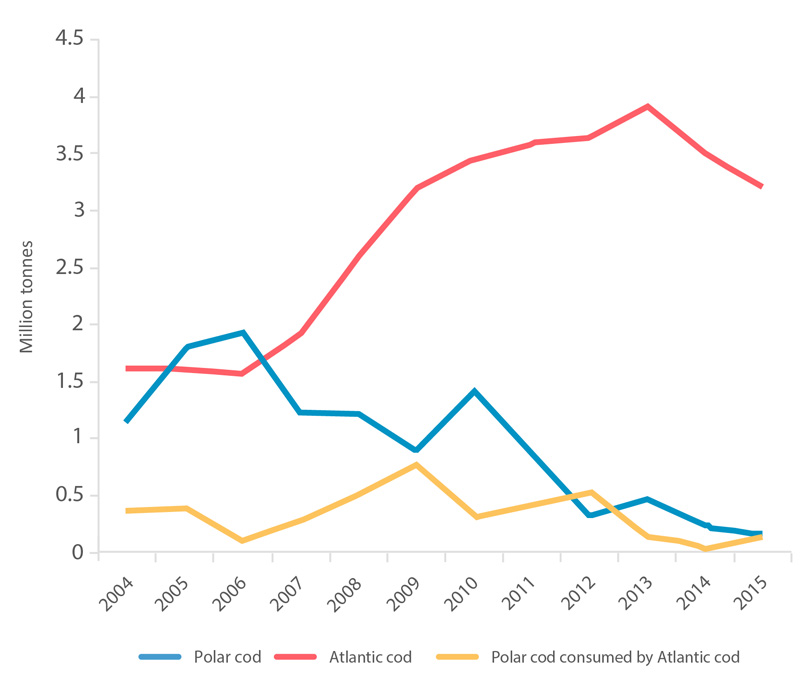
Estimated consumption of polar cod by Atlantic cod in the Barents Sea (yellow line) and biomass of the Atlantic cod stock in the Barents Sea (red line) (ICES 2016). The blue line is the biomass of the Barents Sea polar cod (Prozorkevich 2016). STATE OF THE ARCTIC MARINE BIODIVERSITY REPORT - <a href="https://arcticbiodiversity.is/findings/marine-fishes" target="_blank">Chapter 3</a> - Page 116 - Box figure 3.4.1
-
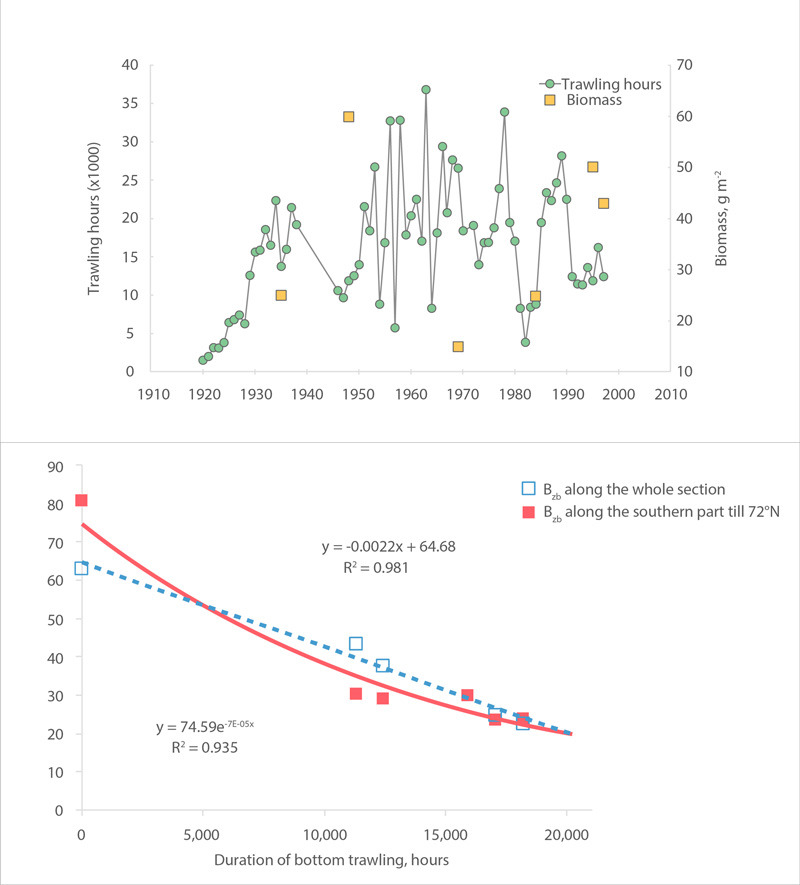
Variation of average annual trawling activity (in hours) and macrobenthic biomass (g m-2), (a) and relationship of biomass with a four-year lag (mean value of time of the turnover in biomass value) to trawling activity, (b) along the Kola section of the Barents Sea during 1920-1997 (Denisenko 2001, 2013). STATE OF THE ARCTIC MARINE BIODIVERSITY REPORT - <a href="https://arcticbiodiversity.is/findings/benthos" target="_blank">Chapter 3</a> - Page 97 - Figure 3.3.5
-
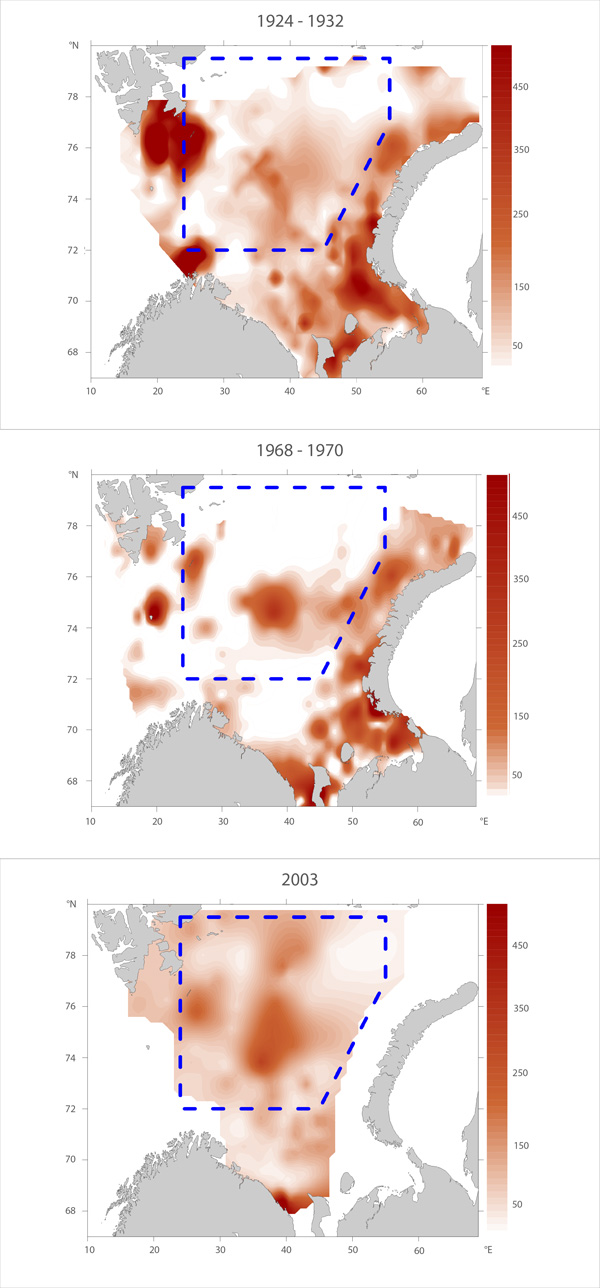
Macrofauna distribution of biomass (g wet fixed weight m-2) in the Barents Sea over three time periods: 1924-32 (Figure A), 1968-70 (Figure B) and 2003 (Figure C, constructed from original archive data, except for area south of 72° N where digitized megafaunal-data taken from Anisimova et al. (2010) was used. Adapted from Denisenko (2013). Blue boxes delineate the areas within which the zoobenthos biomass values were compared. STATE OF THE ARCTIC MARINE BIODIVERSITY REPORT - <a href="https://arcticbiodiversity.is/findings/benthos" target="_blank">Chapter 3</a> - Page 96- Figure 3.3.3
-
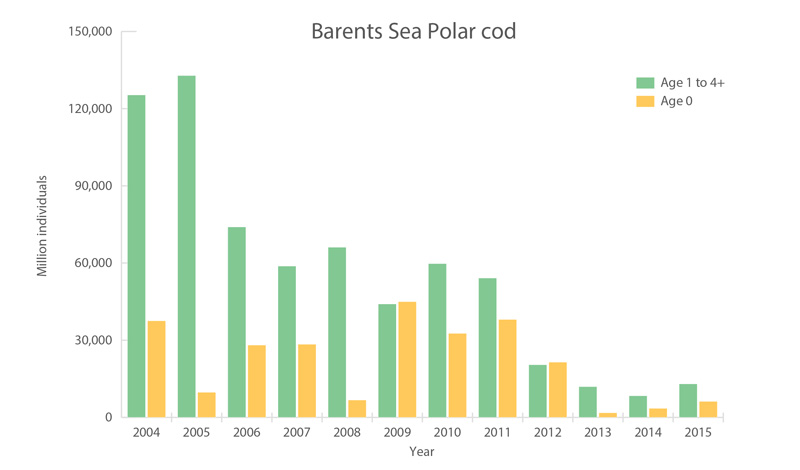
Polar cod in the Barents Sea. Acoustic estimate of polar cod 1-year-old and older (green) and pelagic trawl index of age 0-group abundance (yellow). Source: Joint IMR-PINRO ecosystem survey (Prozorkevich 2016). STATE OF THE ARCTIC MARINE BIODIVERSITY REPORT - <a href="https://arcticbiodiversity.is/findings/marine-fishes" target="_blank">Chapter 3</a> - Page 116 - Figure 3.4.3
-
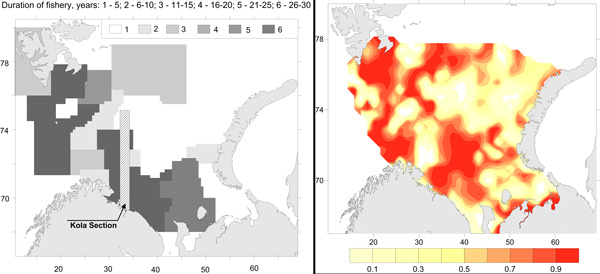
Commercial fishery impact on zoobenthos of the Barents Sea. Figure A) Intensity and duration of fishery efforts in standard commercial fishery areas in the Barents Sea. The darker the area the longer the fishery has been in operation. Figure B) Level of decline in macrobenthic biomass between 1926-1932 and 1968-1970 calculated as 1-b1968/b1930. The largest biomass decreases correspond to the darker colour, whereas lighter colour refers to no change (Denisenko 2013). STATE OF THE ARCTIC MARINE BIODIVERSITY REPORT - <a href="https://arcticbiodiversity.is/findings/benthos" target="_blank">Chapter 3</a> - Page 97 - Figure 3.3.4