 CAFF - Arctic Biodiversity Data Service (ABDS)
dataset
Type of resources
Available actions
Topics
Keywords
Contact for the resource
Provided by
Years
Formats
Representation types
Update frequencies
status
Scale
-
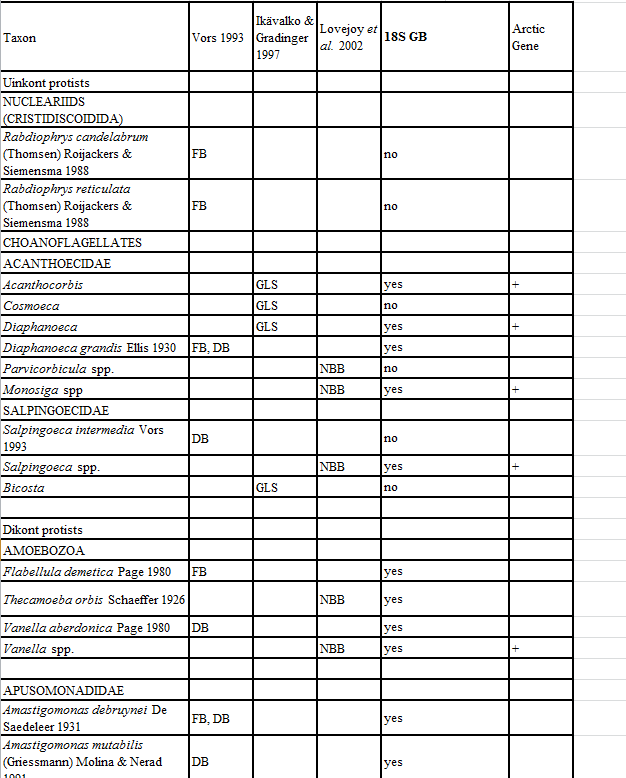
Appendix 11. Taxa of hetorotrophic protists reported from Foxe Basin, Canada (FB), Disko Bay, W Greenland (DB; Vors 1993), the Greenland Sea (GLS; Ikävalko & Gradinger 1997) and Northern Baffin Bay, Canada (NBB; Lovejoy et al. 2002).
-
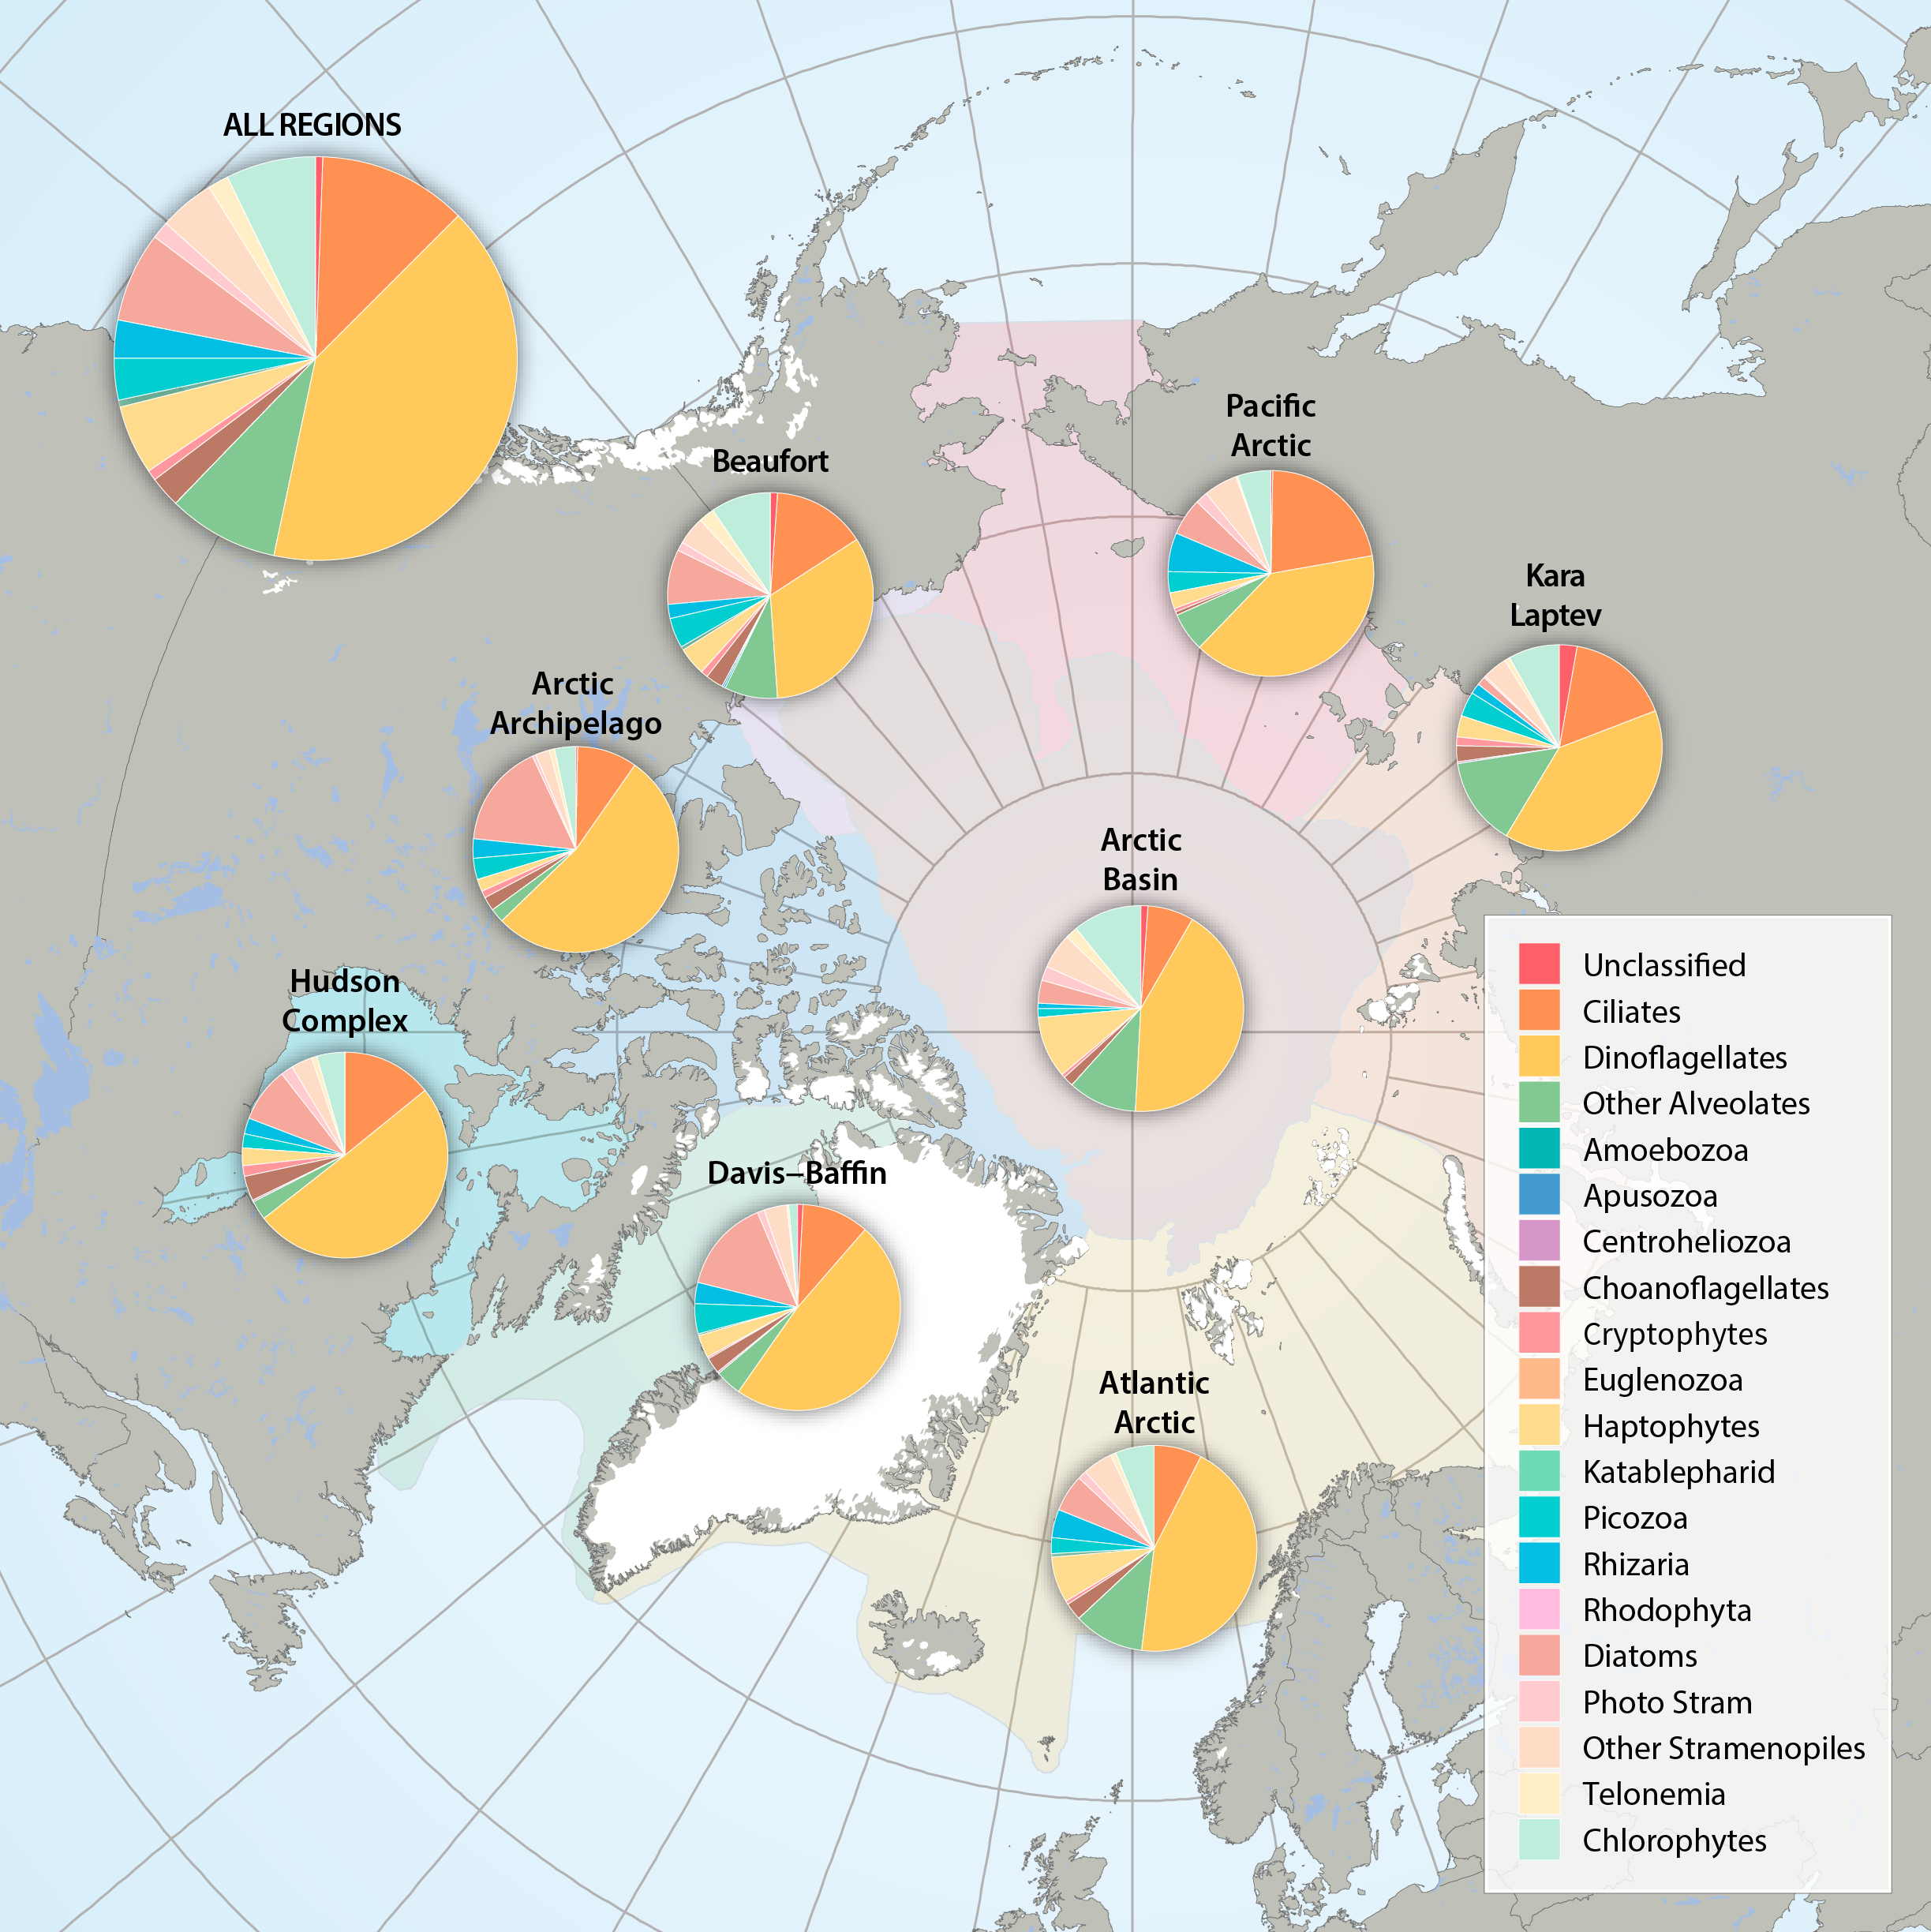
Figure 3.2.2a: Relative abundance of major eukaryote taxonomic groups found by high throughput sequencing of the small-subunit (18S) rRNA gene across Arctic Marine Areas. Figure 3.2.2b: Relative abundance of major eukaryote functional groups found by microscopy in the Arctic Marine Areas. STATE OF THE ARCTIC MARINE BIODIVERSITY REPORT - <a href="https://arcticbiodiversity.is/findings/plankton" target="_blank">Chapter 3</a> - Page 70 - Figures 3.2.2a and 3.2.2b
-
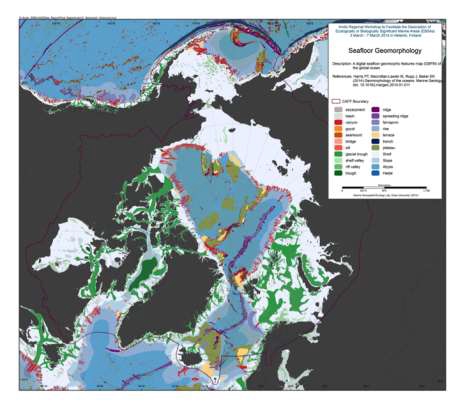
We present the first digital seafloor geomorphic features map (GSFM) of the global ocean. The GSFM includes 131,192 separate polygons in 29 geomorphic feature categories, used here to assess differences between passive and active continental margins as well as between 8 major ocean regions (the Arctic, Indian, North Atlantic, North Pacific, South Atlantic, South Pacific and the Southern Oceans and the Mediterranean and Black Seas). The GSFM provides quantitative assessments of differences between passive and active margins: continental shelf width of passive margins (88 km) is nearly three times that of active margins (31 km); the average width of active slopes (36 km) is less than the average width of passive margin slopes (46 km); active margin slopes contain an area of 3.4 million km2 where the gradient exceeds 5°, compared with 1.3 million km2 on passive margin slopes; the continental rise covers 27 million km2 adjacent to passive margins and less than 2.3 million km2 adjacent to active margins. Examples of specific applications of the GSFM are presented to show that: 1) larger rift valley segments are generally associated with slow-spreading rates and smaller rift valley segments are associated with fast spreading; 2) polar submarine canyons are twice the average size of non-polar canyons and abyssal polar regions exhibit lower seafloor roughness than non-polar regions, expressed as spatially extensive fan, rise and abyssal plain sediment deposits – all of which are attributed here to the effects of continental glaciations; and 3) recognition of seamounts as a separate category of feature from ridges results in a lower estimate of seamount number compared with estimates of previous workers. Reference: Harris PT, Macmillan-Lawler M, Rupp J, Baker EK Geomorphology of the oceans. Marine Geology.
-
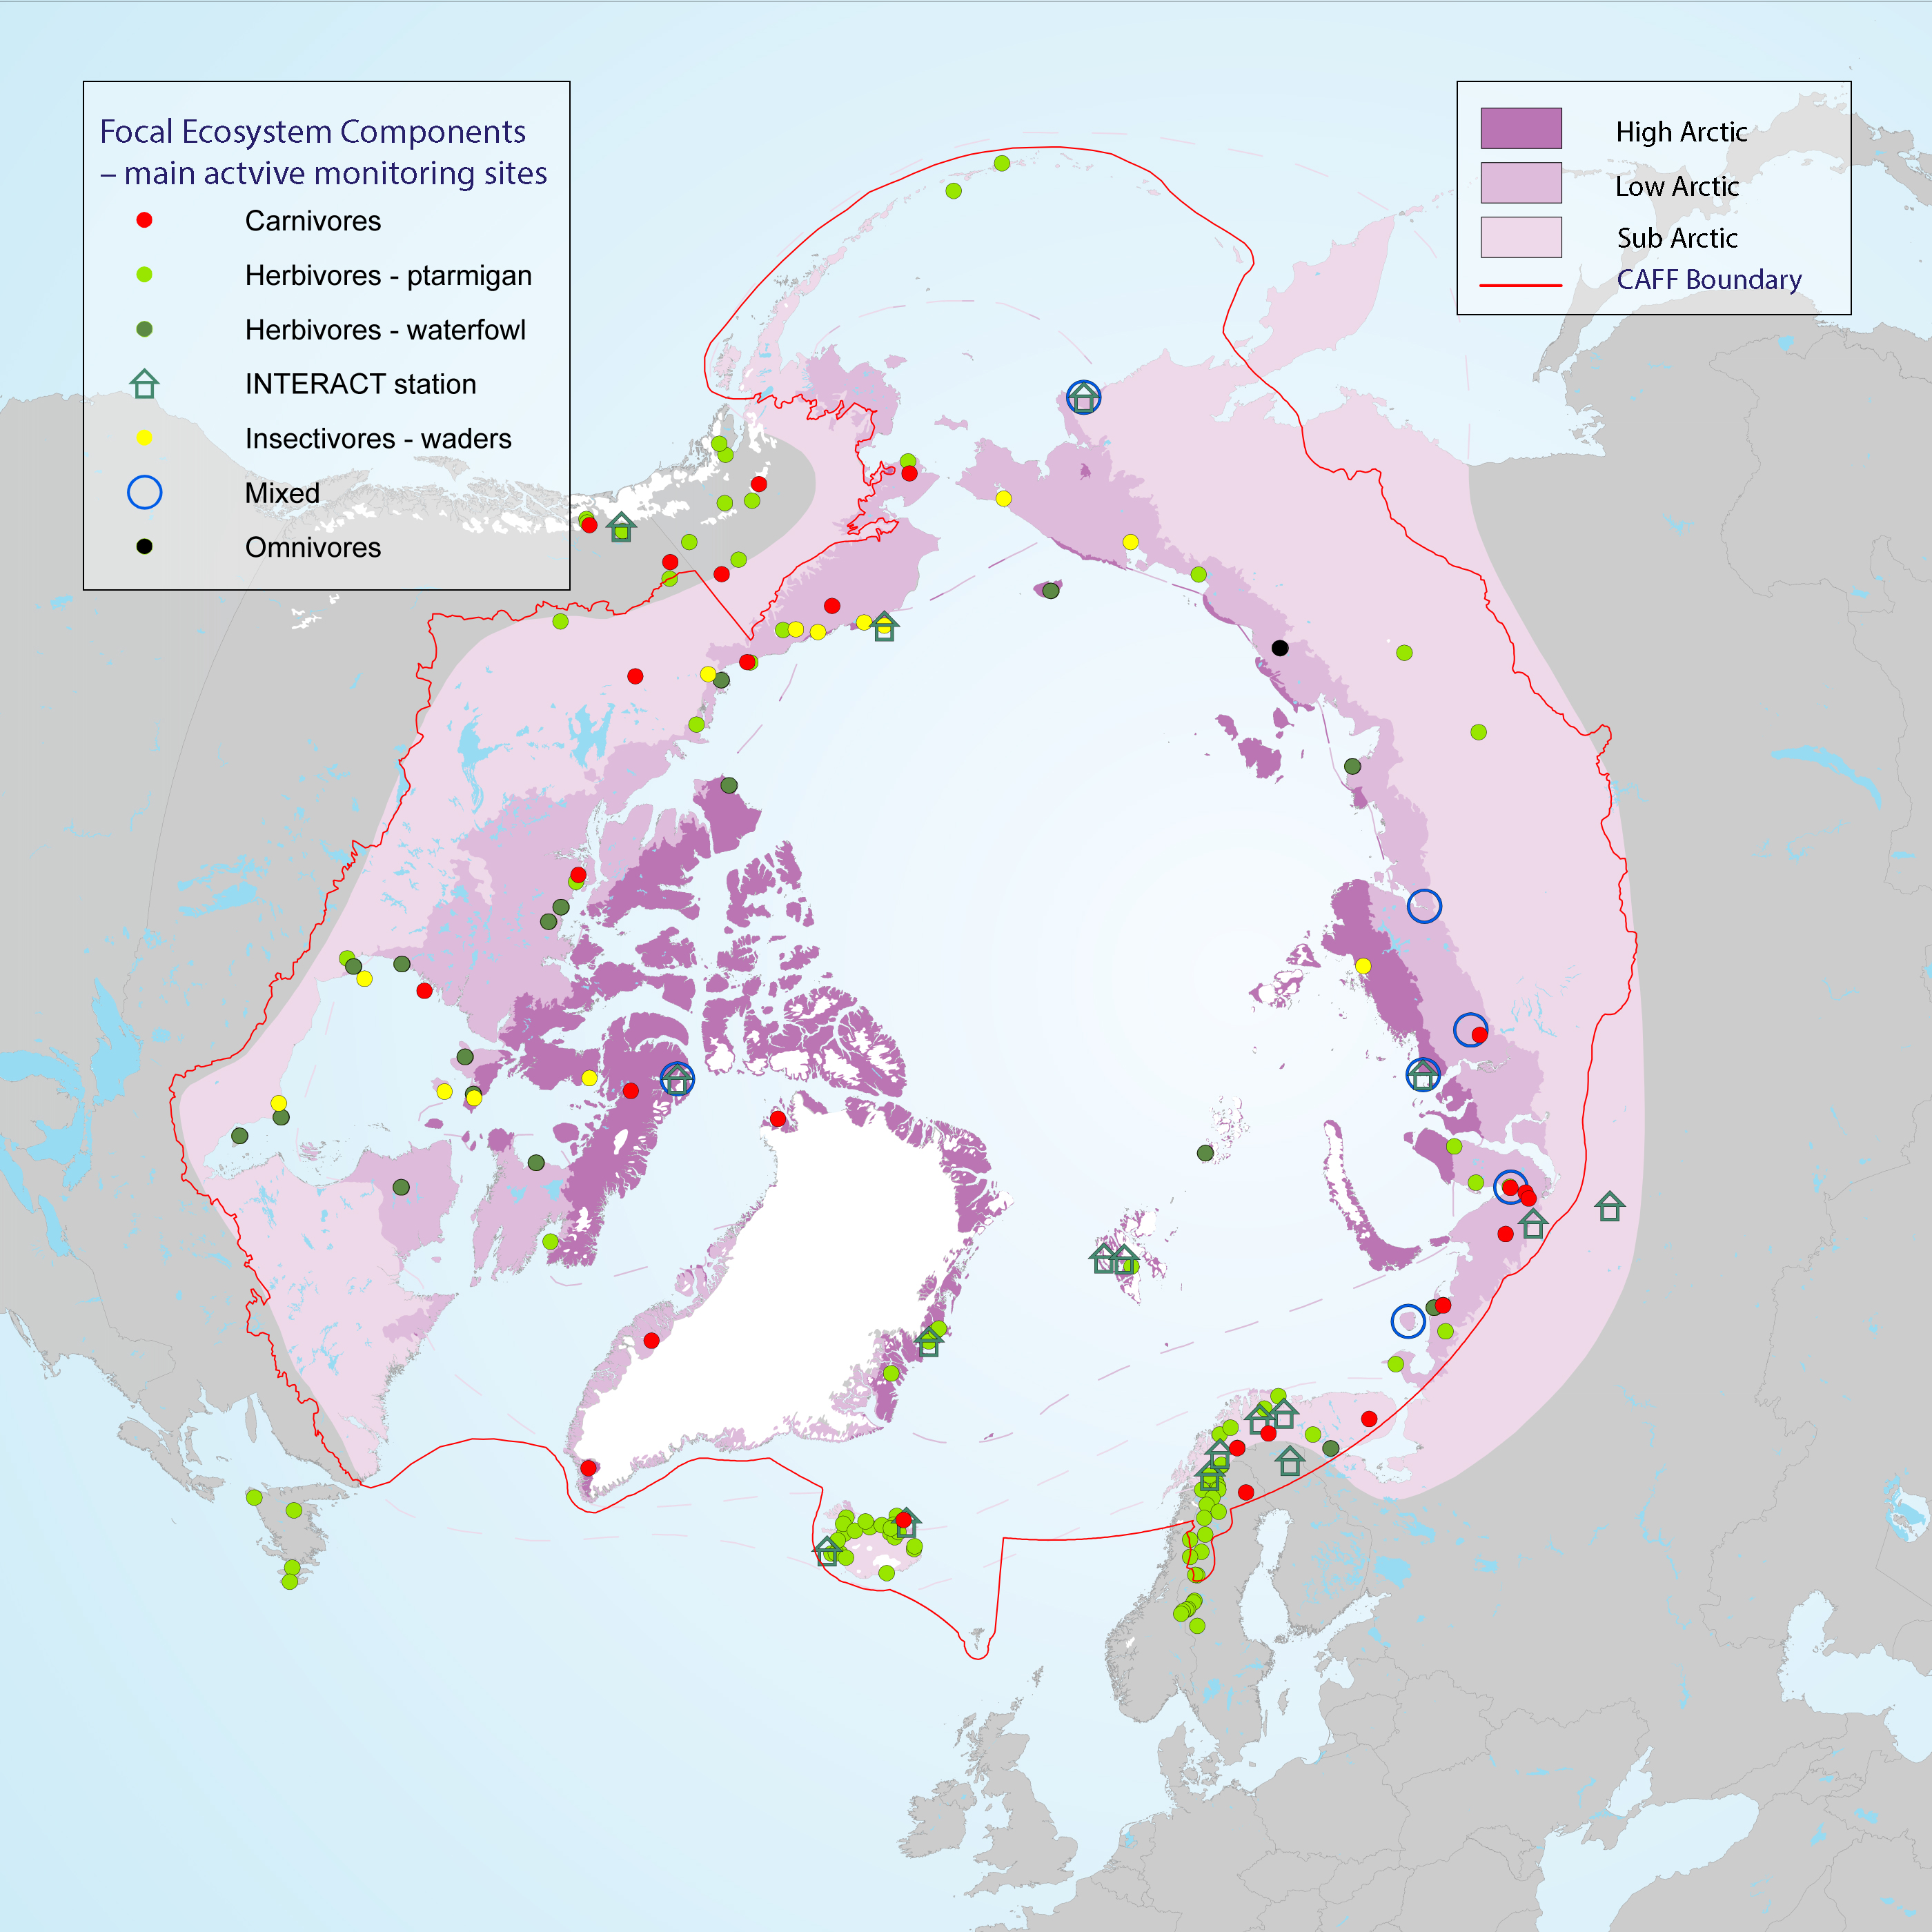
Many population counts of gregarious migrant species, such as waders and geese, take place along the flyways and at wintering grounds outside the Arctic which stresses the importance of continued development of movement ecology studies. Monitoring of FEC attributes related to breeding success and links to environmental drivers within the Arctic takes place in a wide network of research sites across the Arctic, although with low coverage of the high Arctic zone (Figure 3-25) STATE OF THE ARCTIC TERRESTRIAL BIODIVERSITY REPORT - Chapter 3 - Page 58 - Figure 3.25
-
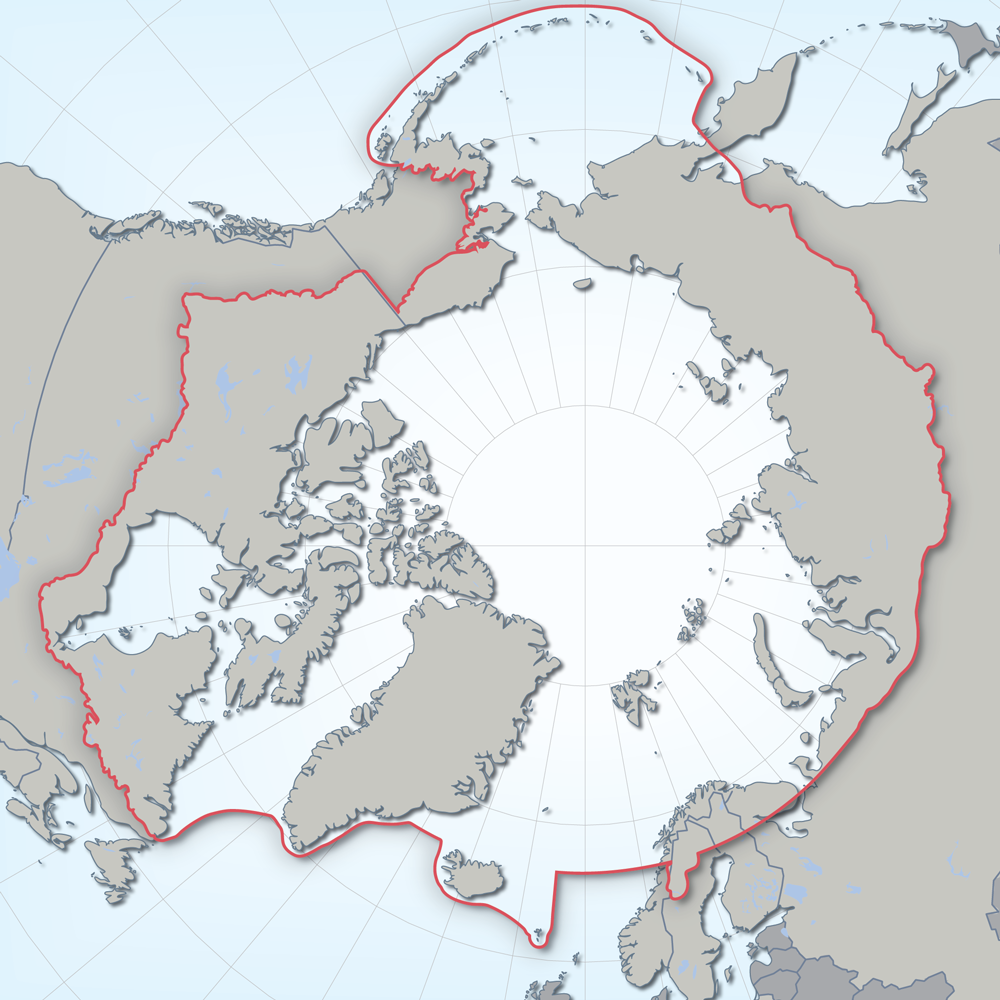
Defines the area covered by the the Conservation of Arctic Flora and Fauna (CAFF) working group of the Arctic Council. Each Arctic Council country was responsible for defining their Arctic boundary.
-

We present the first digital seafloor geomorphic features map (GSFM) of the global ocean. The GSFM includes 131,192 separate polygons in 29 geomorphic feature categories, used here to assess differences between passive and active continental margins as well as between 8 major ocean regions (the Arctic, Indian, North Atlantic, North Pacific, South Atlantic, South Pacific and the Southern Oceans and the Mediterranean and Black Seas). The GSFM provides quantitative assessments of differences between passive and active margins: continental shelf width of passive margins (88 km) is nearly three times that of active margins (31 km); the average width of active slopes (36 km) is less than the average width of passive margin slopes (46 km); active margin slopes contain an area of 3.4 million km2 where the gradient exceeds 5°, compared with 1.3 million km2 on passive margin slopes; the continental rise covers 27 million km2 adjacent to passive margins and less than 2.3 million km2 adjacent to active margins. Examples of specific applications of the GSFM are presented to show that: 1) larger rift valley segments are generally associated with slow-spreading rates and smaller rift valley segments are associated with fast spreading; 2) polar submarine canyons are twice the average size of non-polar canyons and abyssal polar regions exhibit lower seafloor roughness than non-polar regions, expressed as spatially extensive fan, rise and abyssal plain sediment deposits – all of which are attributed here to the effects of continental glaciations; and 3) recognition of seamounts as a separate category of feature from ridges results in a lower estimate of seamount number compared with estimates of previous workers. Reference: Harris PT, Macmillan-Lawler M, Rupp J, Baker EK Geomorphology of the oceans. Marine Geology.
-
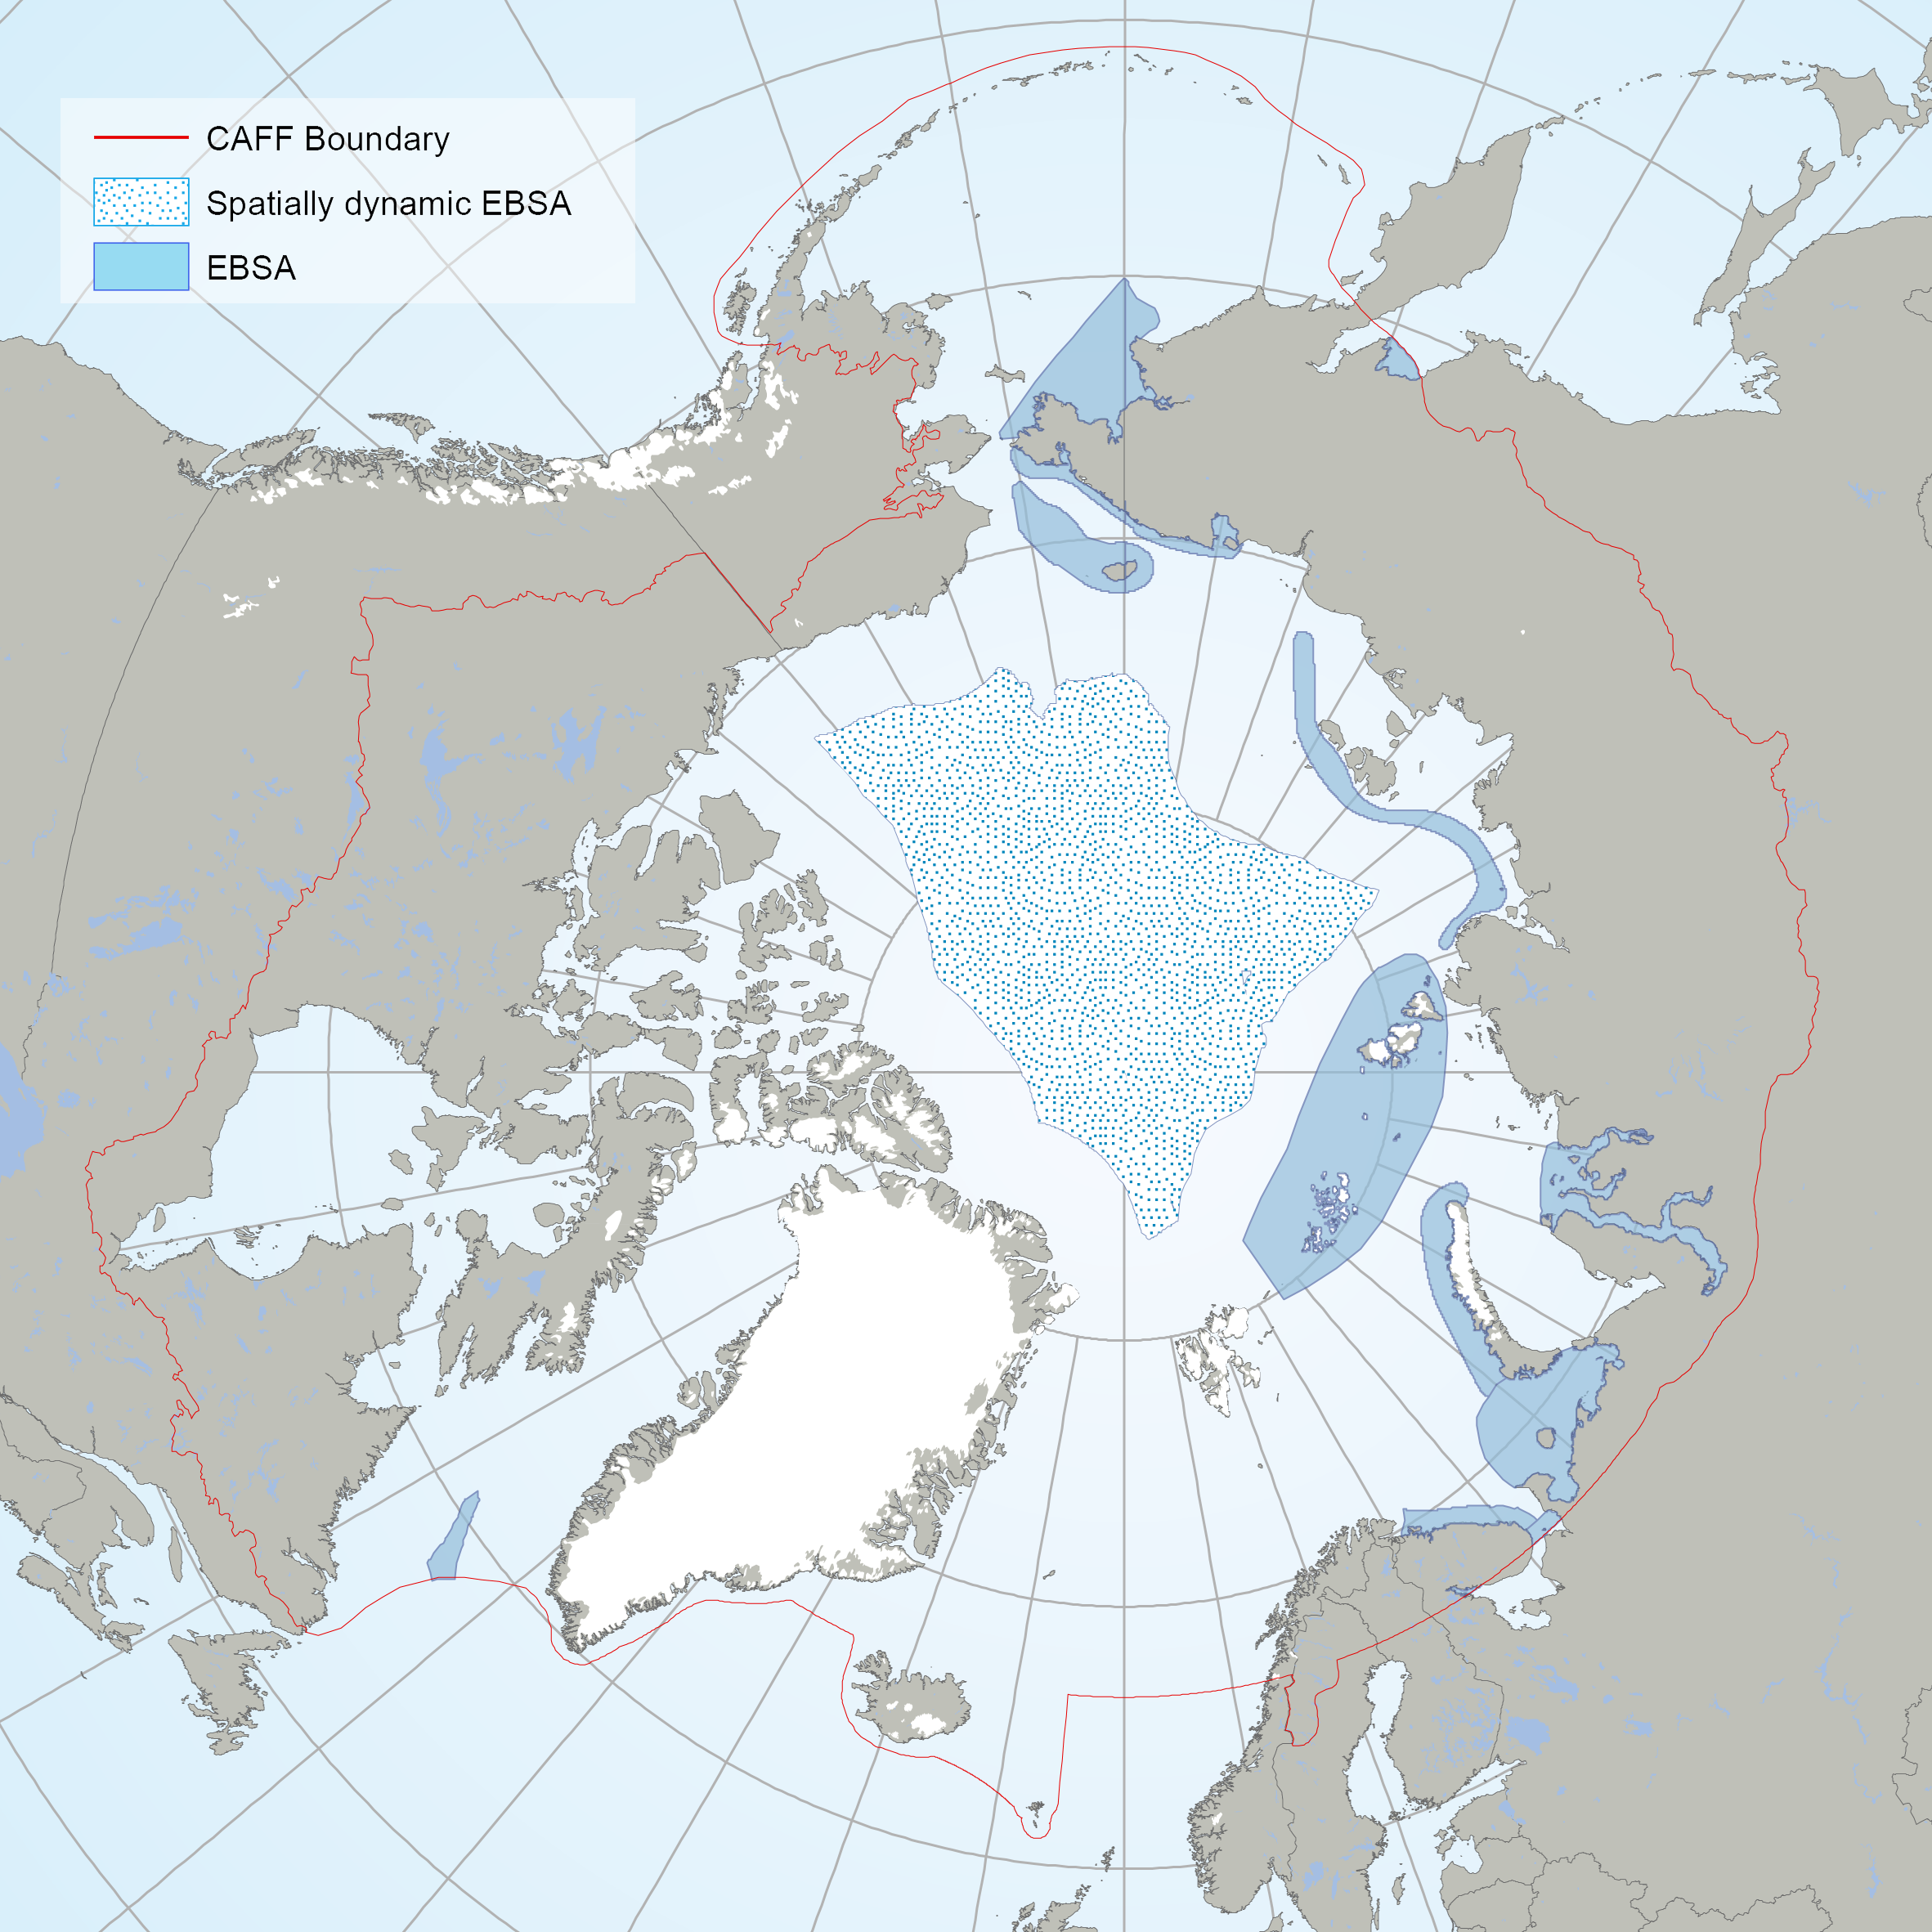
The EBSAs are special areas in the ocean that serve important purposes, in one way or another, to support the healthy functioning of oceans and the many services that it provides. The EBSAs contained din this dataset are the result of an Arctic Regional Workshop to Facilitate the Description of Ecologically or Biologically Significant Marine Areas (EBSAs) held in Finland on 3-7 march, 2014. <a href="https://www.cbd.int/ebsa/ebsas" target="_blank">Resource</a>
-
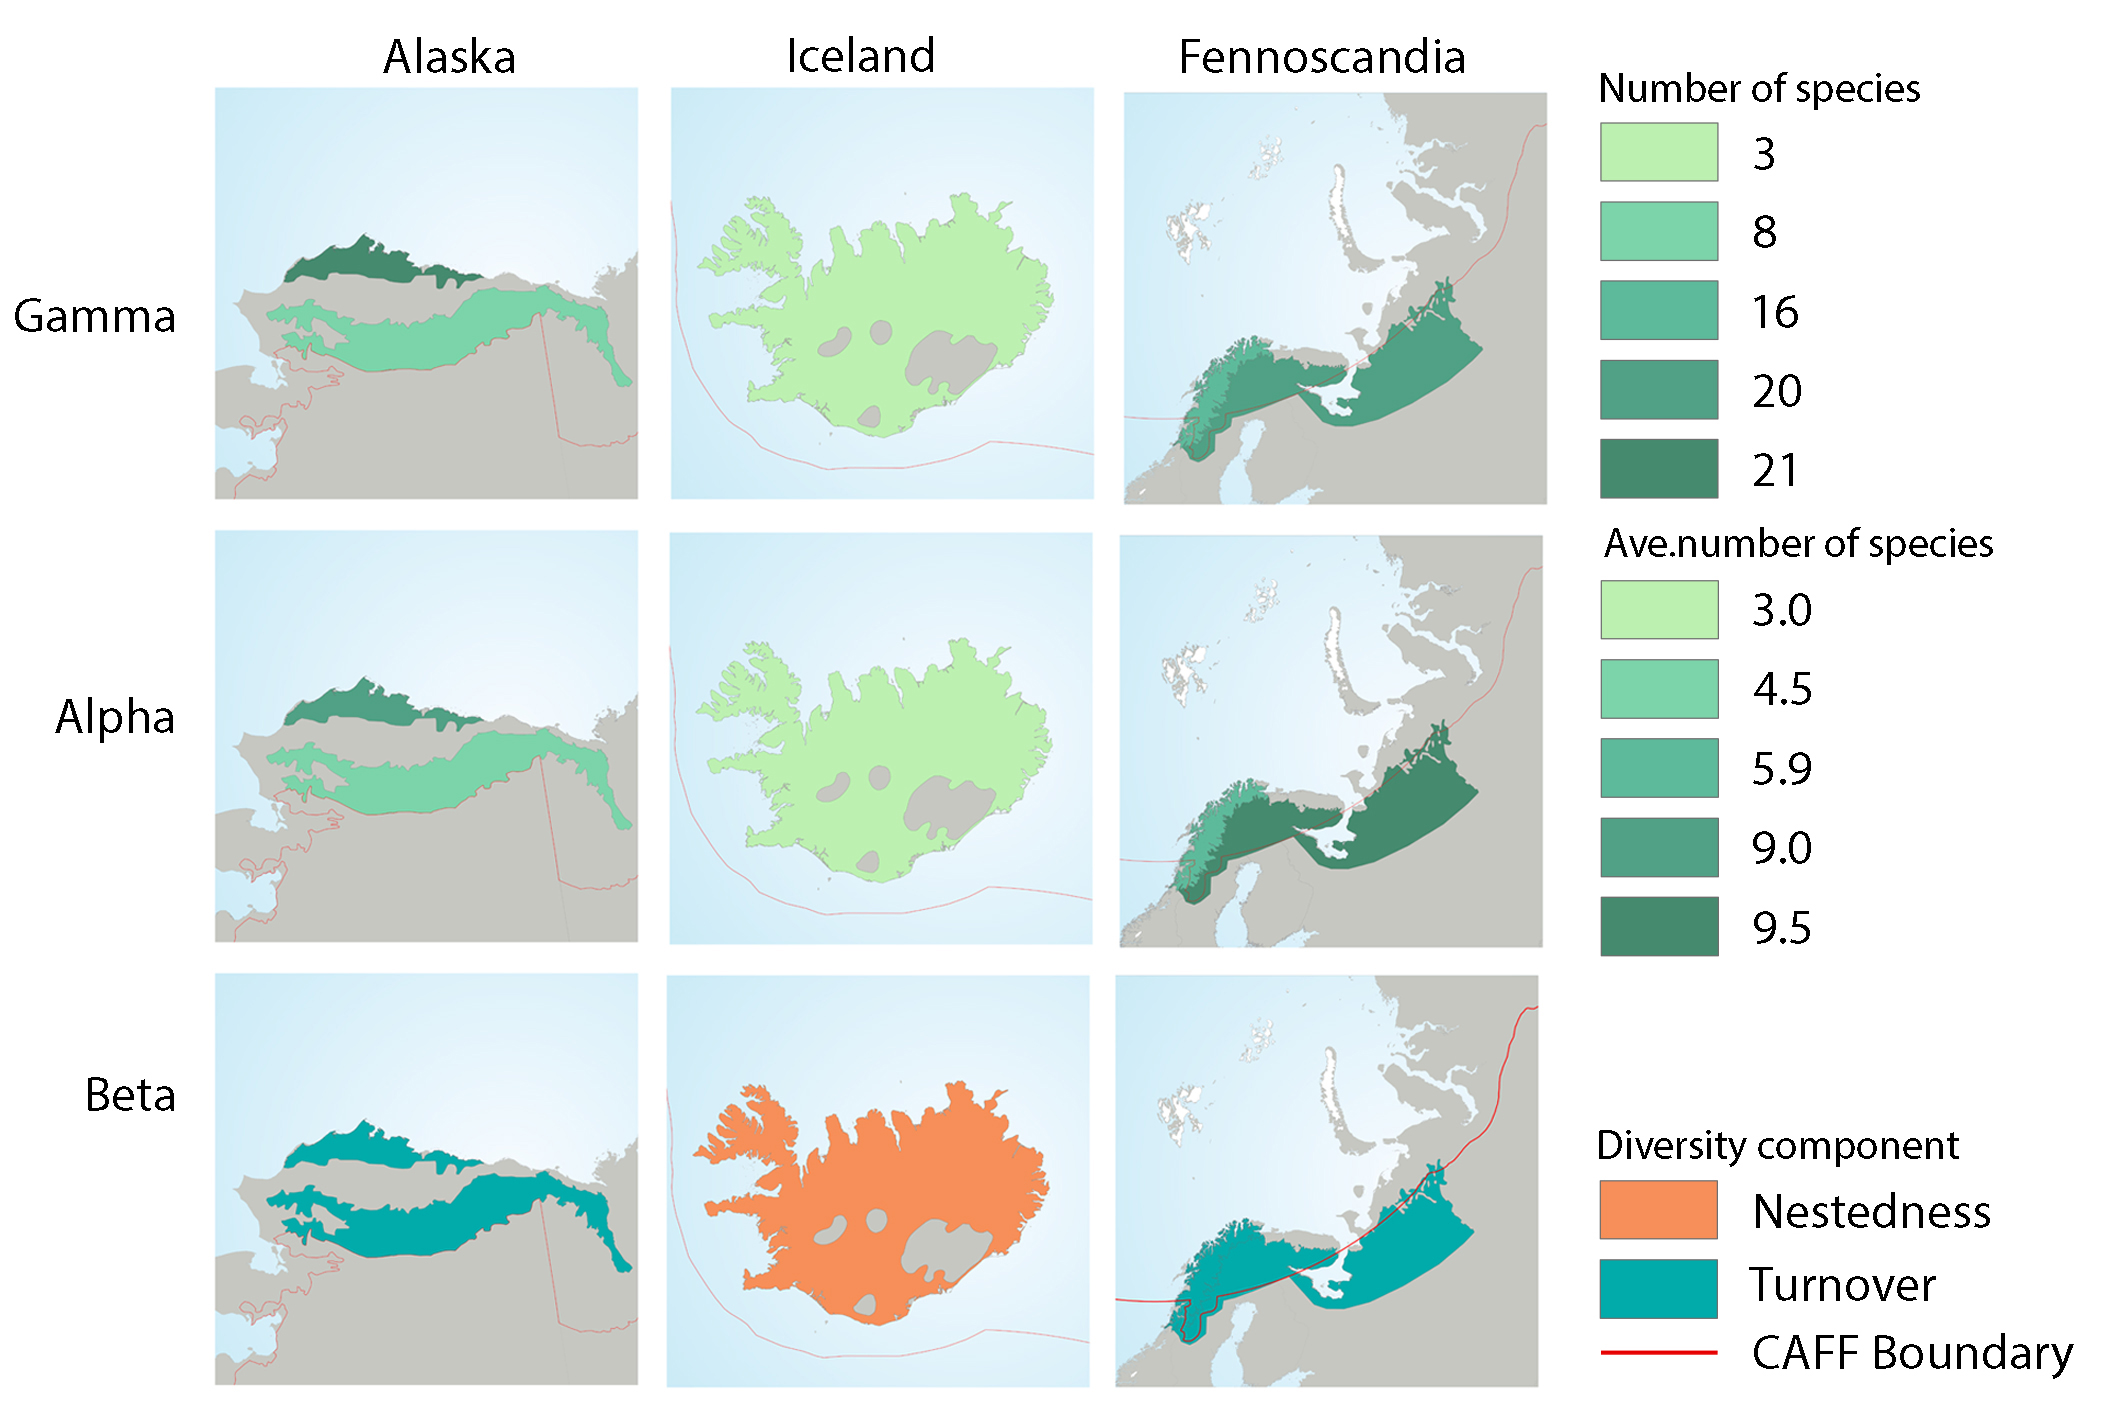
Fish diversity characteristics in three geographical regions: Alaska, Iceland, and Fennoscandia. Gamma diversity is based the total number of species sampled in hydrobasins of each ecoregion. Alpha diversity shows the mean basin species richness (95% confidence interval) and beta diversity shows the component of beta diversity, nestedness or turnover, that dominated within each of the ecoregions; gamma, alpha, and beta diversity estimates were based on a subset of basins where a minimum of 10 stations were sampled. All maps are drawn to the same scale. State of the Arctic Freshwater Biodiversity Report - Chapter 4 - Page 77 - Figure 4-39
-

Locations and associated attributes of circumpolar Muskox studies. Attributes include animal count, population estimate, estimate error and associated report citation.
-

We present the first digital seafloor geomorphic features map (GSFM) of the global ocean. The GSFM includes 131,192 separate polygons in 29 geomorphic feature categories, used here to assess differences between passive and active continental margins as well as between 8 major ocean regions (the Arctic, Indian, North Atlantic, North Pacific, South Atlantic, South Pacific and the Southern Oceans and the Mediterranean and Black Seas). The GSFM provides quantitative assessments of differences between passive and active margins: continental shelf width of passive margins (88 km) is nearly three times that of active margins (31 km); the average width of active slopes (36 km) is less than the average width of passive margin slopes (46 km); active margin slopes contain an area of 3.4 million km2 where the gradient exceeds 5°, compared with 1.3 million km2 on passive margin slopes; the continental rise covers 27 million km2 adjacent to passive margins and less than 2.3 million km2 adjacent to active margins. Examples of specific applications of the GSFM are presented to show that: 1) larger rift valley segments are generally associated with slow-spreading rates and smaller rift valley segments are associated with fast spreading; 2) polar submarine canyons are twice the average size of non-polar canyons and abyssal polar regions exhibit lower seafloor roughness than non-polar regions, expressed as spatially extensive fan, rise and abyssal plain sediment deposits – all of which are attributed here to the effects of continental glaciations; and 3) recognition of seamounts as a separate category of feature from ridges results in a lower estimate of seamount number compared with estimates of previous workers. Reference: Harris PT, Macmillan-Lawler M, Rupp J, Baker EK Geomorphology of the oceans. Marine Geology.