 CAFF - Arctic Biodiversity Data Service (ABDS)
inlandWaters
Type of resources
Available actions
Topics
Keywords
Contact for the resource
Provided by
Representation types
Update frequencies
status
-
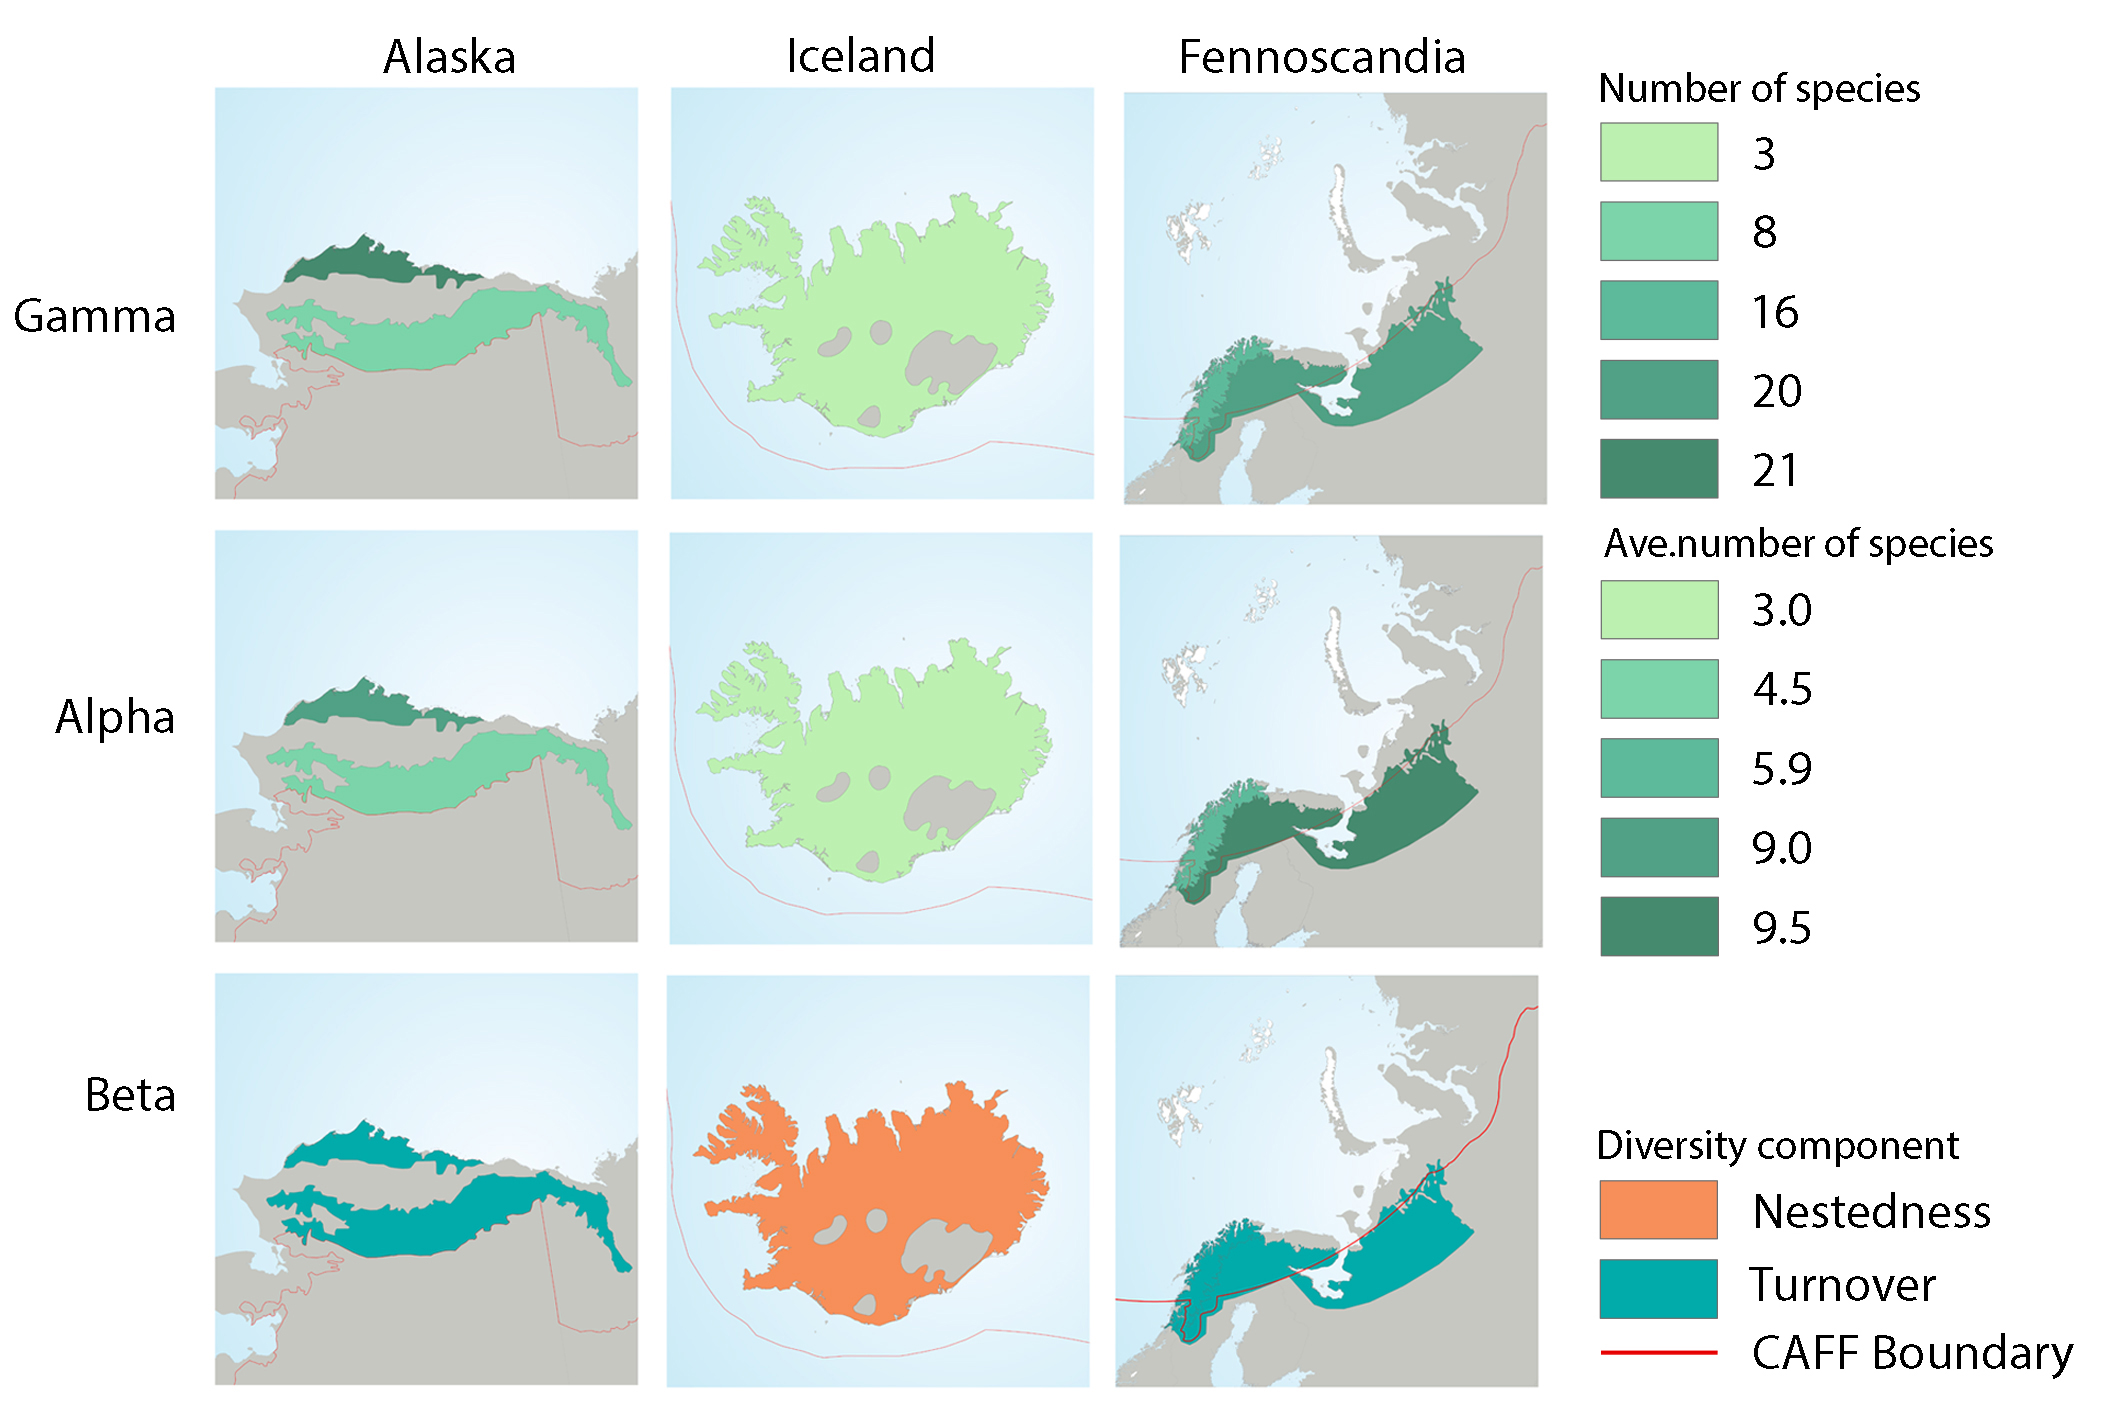
Fish diversity characteristics in three geographical regions: Alaska, Iceland, and Fennoscandia. Gamma diversity is based the total number of species sampled in hydrobasins of each ecoregion. Alpha diversity shows the mean basin species richness (95% confidence interval) and beta diversity shows the component of beta diversity, nestedness or turnover, that dominated within each of the ecoregions; gamma, alpha, and beta diversity estimates were based on a subset of basins where a minimum of 10 stations were sampled. All maps are drawn to the same scale. State of the Arctic Freshwater Biodiversity Report - Chapter 4 - Page 77 - Figure 4-39
-

Results of circumpolar assessment of river diatoms, indicating (a) the location of river diatom stations, underlain by circumpolar ecoregions; (b) ecoregions with many river diatom stations, colored on the basis of alpha diversity rarefied to 40 stations; (c) all ecoregions with river diatom stations, colored on the basis of alpha diversity rarefied to 10 stations; (d) ecoregions with at least two stations in a hydrobasin, colored on the basis of the dominant component of beta diversity (species turnover, nestedness, approximately equal contribution, or no diversity) when averaged across hydrobasins in each ecoregion. State of the Arctic Freshwater Biodiversity Report - Chapter 4 - Page 36 - Figure 4-8
-
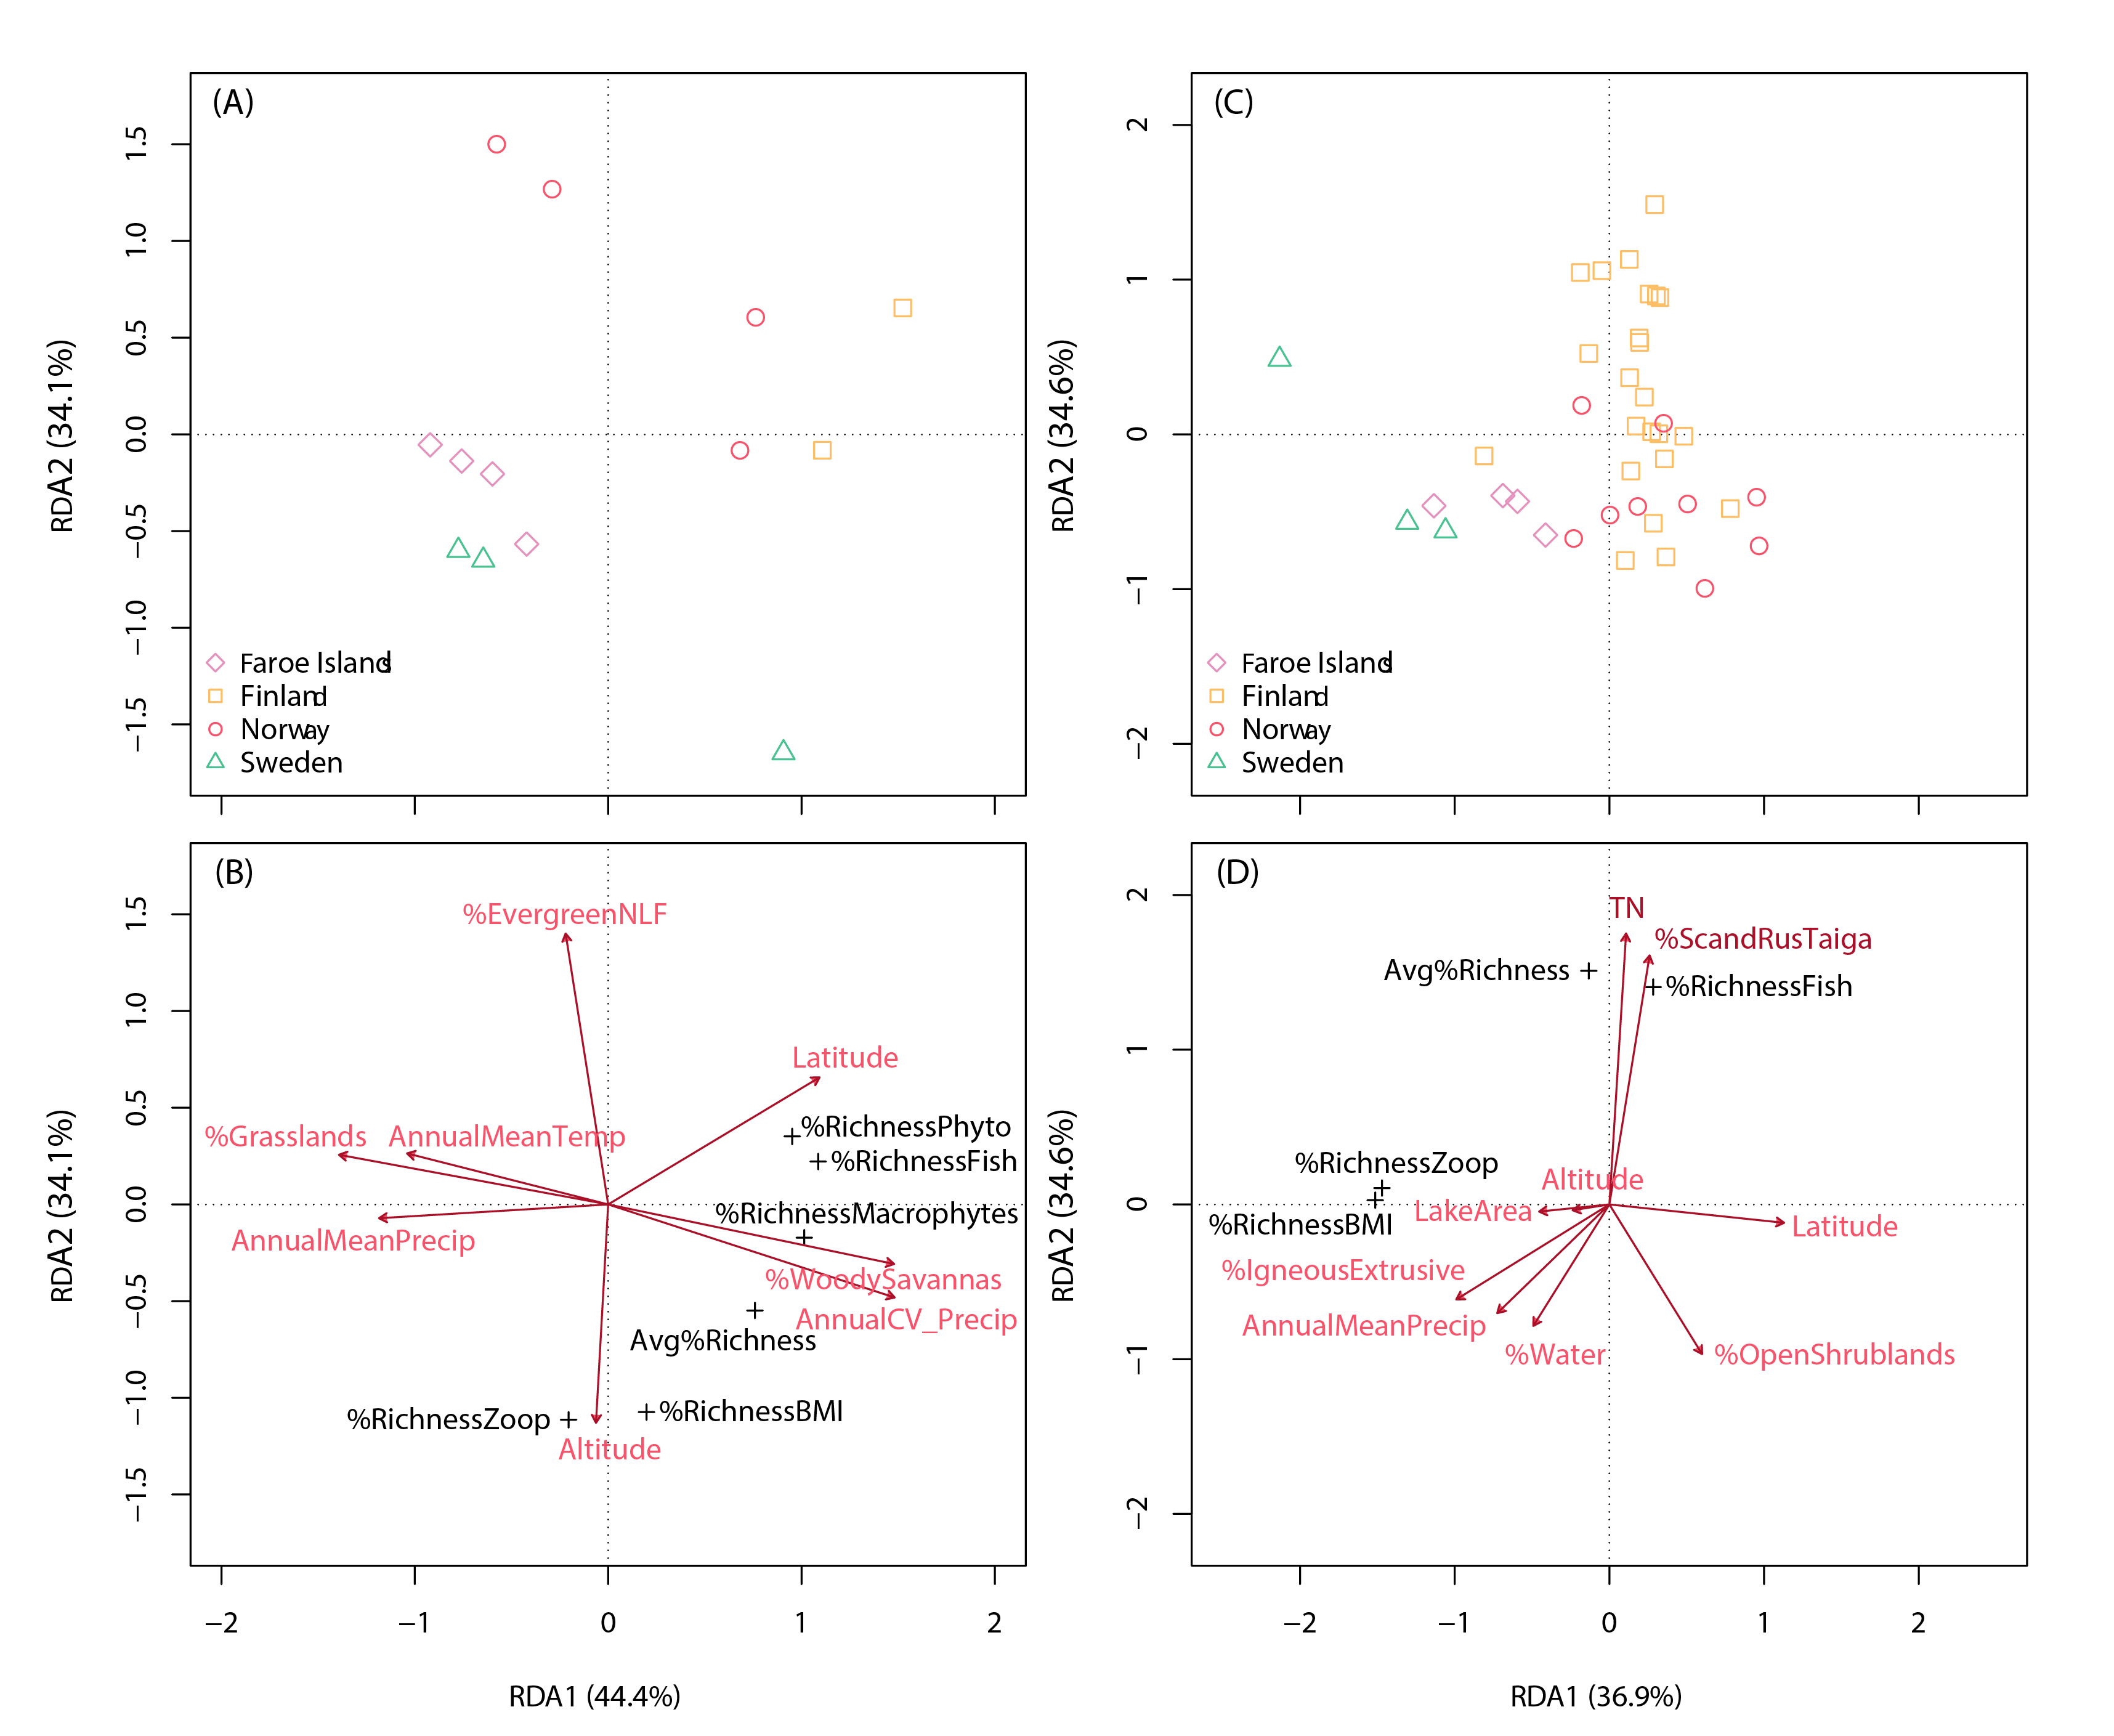
Redundancy analysis of percentage species taxa share (taxa richness relative to richness of all taxa) among 5 FECs (phytoplankton, macrophytes, zooplankton, benthic macroinvertebrates and fish) in 13 Fennoscandian lakes (panels A and B) and among 3 FECs in 39 Fennoscandian lakes (panels C and D).The upper panels show lake ordinations, while the bottom panels show explanatory environmental variables (red arrows), as indicated by permutation tests (p < 0.05). Avg%Richness: average species taxa richness as a percentage of richness of all FECs (i.e., including benthic algae if present); %Richness BMI: relative taxa share in benthic macroinvertebrates; %EvergreenNLF: percentage cover of evergreen needle-leaf forests. State of the Arctic Freshwater Biodiversity Report - Chapter 5 - Page 87 - Figure 5-4
-
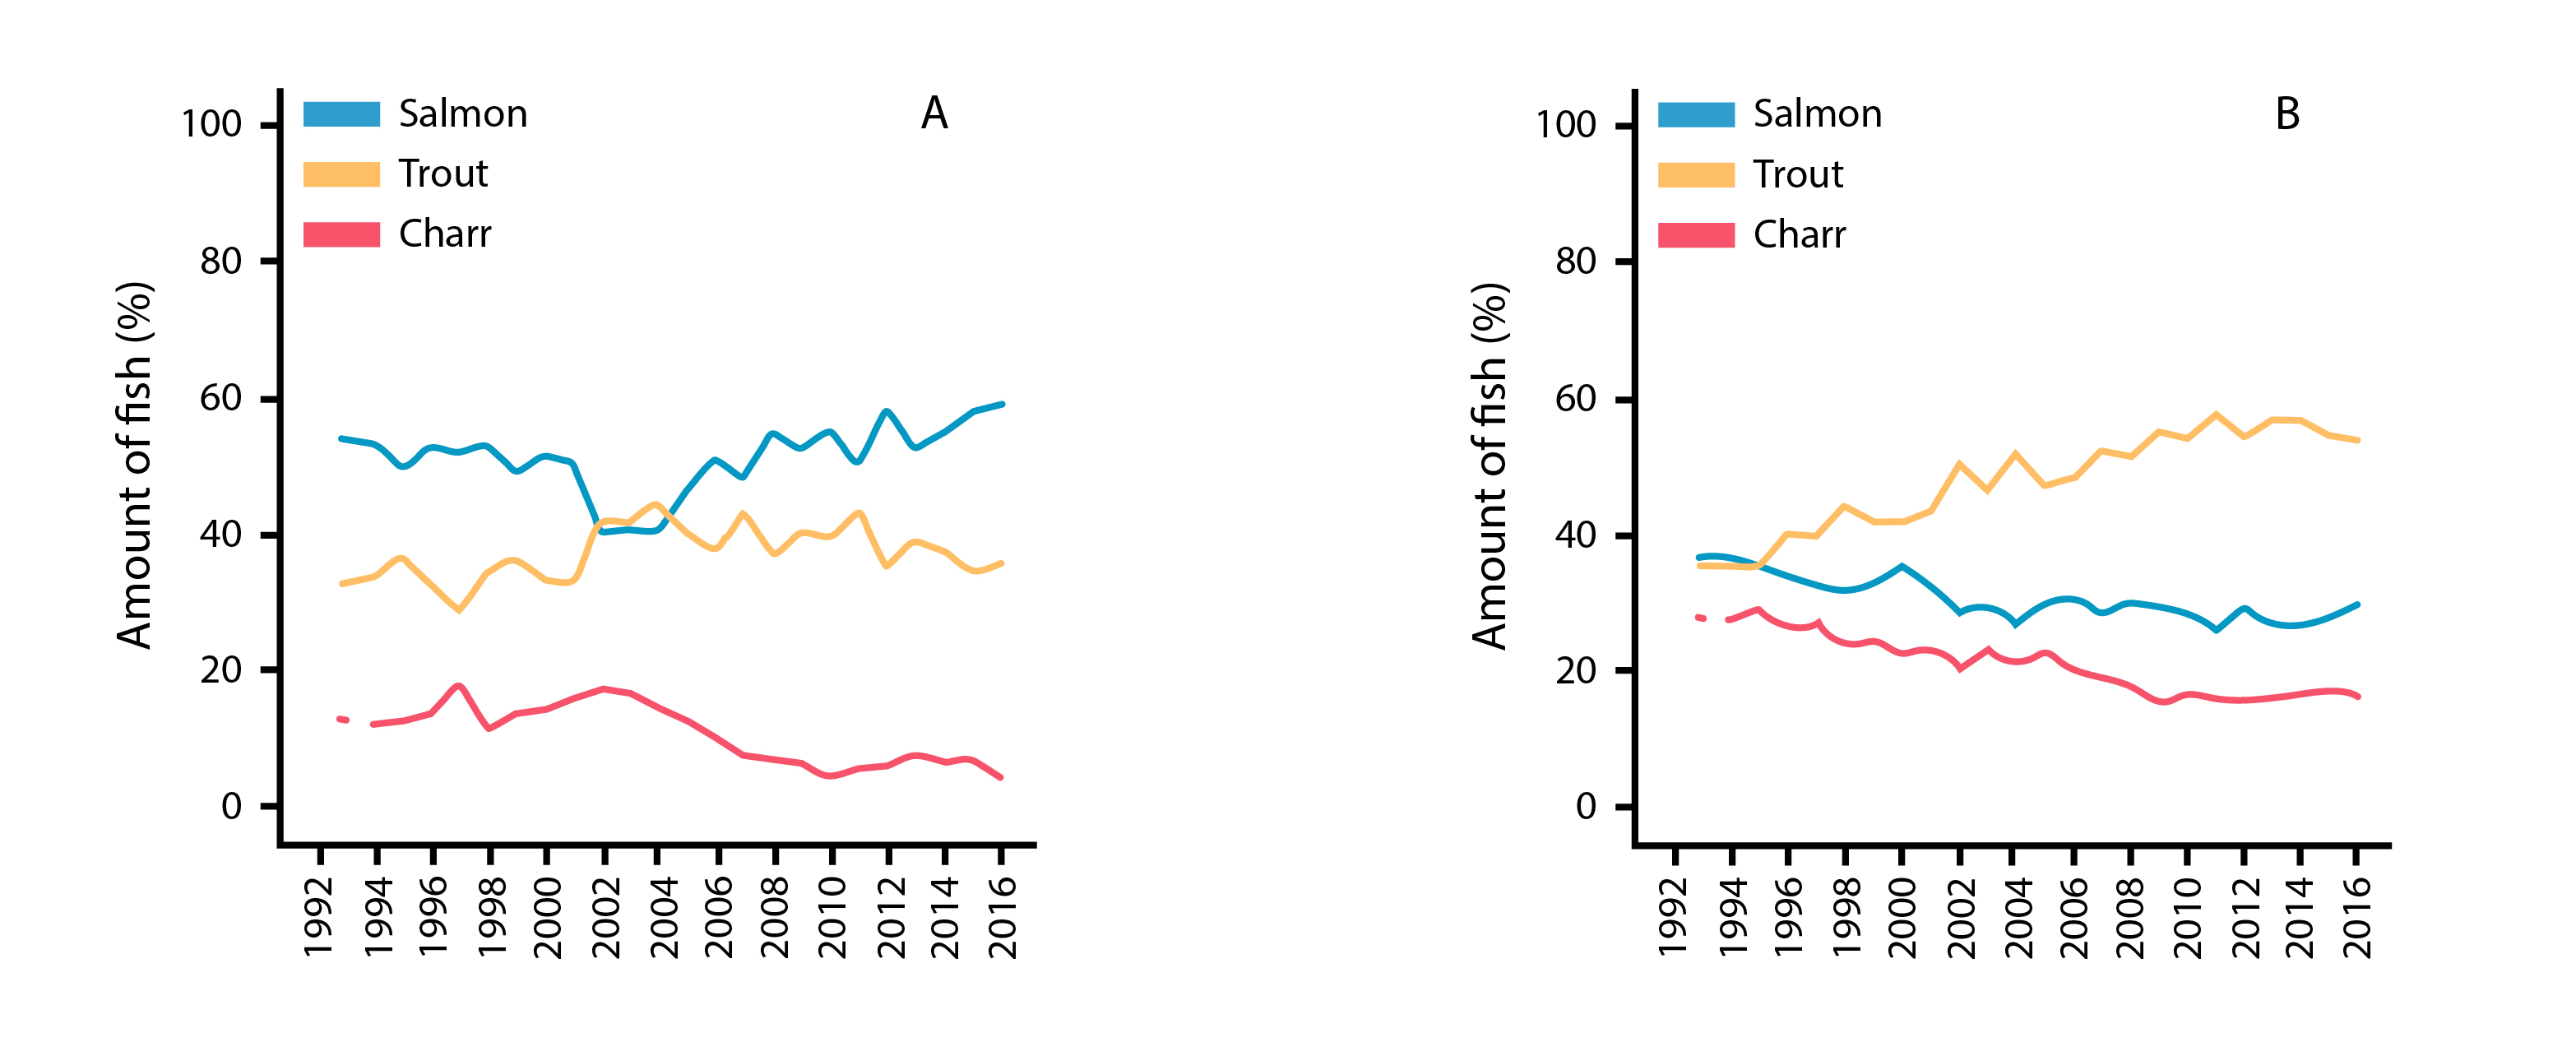
Temporal patterns in % abundance of Atlantic salmon, brown trout, and anadromous Arctic charr from catch statistics in northern Norway rivers monitored from 1993 to 2016, including basins dominated by (a) rivers and (b) lakes. State of the Arctic Freshwater Biodiversity Report - Chapter 4 - Page 81- Figure 4-42
-

Figure 3-5 Changes in alpha diversity (red line), predator body size (blue dashed line), and ecosystem metabolism (blue solid line) with a shift in glacial cover from high (left) to low (right). Redrawn from Milner et al. (2017). State of the Arctic Freshwater Biodiversity Report - Chapter 3 - Page 22 - Figure 3-5
-

Although the circumpolar countries endeavor to support monitoring programs that provide good coverage of Arctic and subarctic regions, this ideal is constrained by the high costs associated with repeated sampling of a large set of lakes and rivers in areas that often are very remote. Consequently, freshwater monitoring has sparse, spatial coverage in large parts of the Arctic, with only Fennoscandia and Iceland having extensive monitoring coverage of lakes and streams Figure 6-2 Current state of monitoring for river FECs in each Arctic country State of the Arctic Freshwater Biodiversity Report - Chapter 6 - Page 94 - Figure 6-2
-
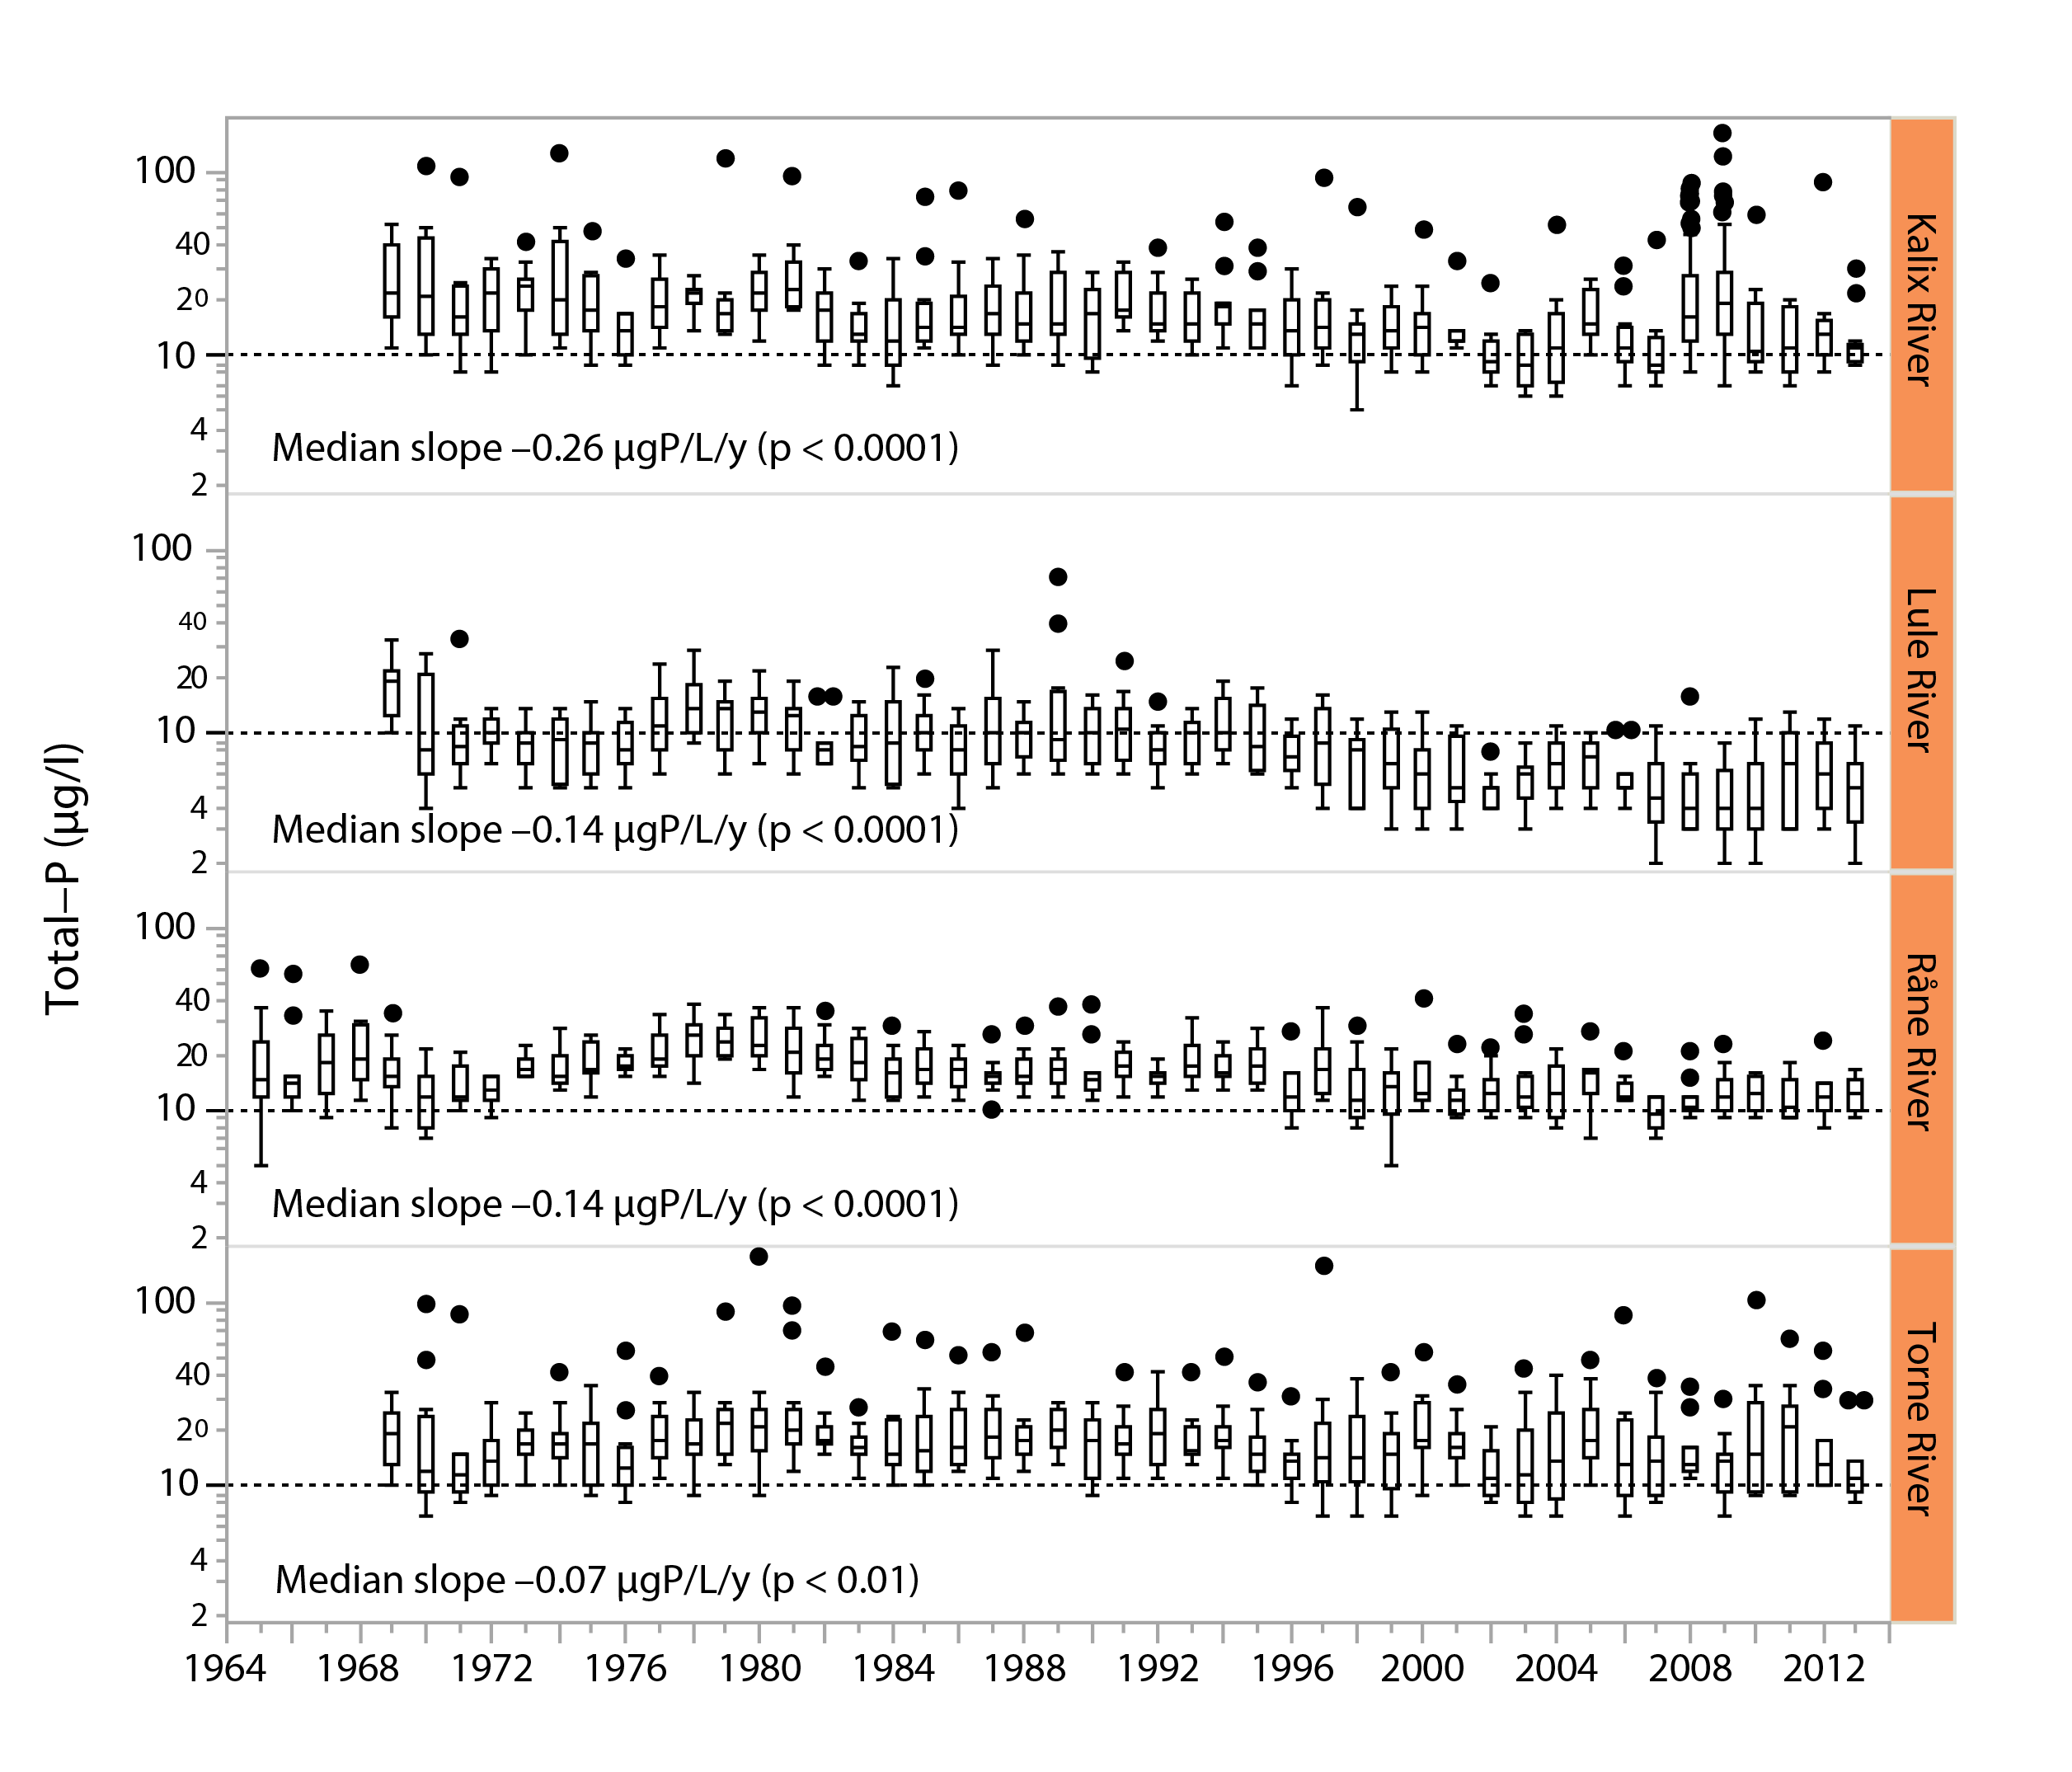
Figure 3-3 Long-term trends in total phosphorus water concentrations (μg/L) in four major, unregulated rivers that drain the subarctic Arctic/alpine ecoregion of the Scandinavian peninsula, the Kalix river, The Lule river, the Råne river, and the Torne river. Slopes and p-values are given in the different panels. Boxes indicate medians and 25th and 75th percentiles, while whiskers give the 10th and 90th percentiles. State of the Arctic Freshwater Biodiversity Report - Chapter 3 - Page 21 - Figure 3-3
-
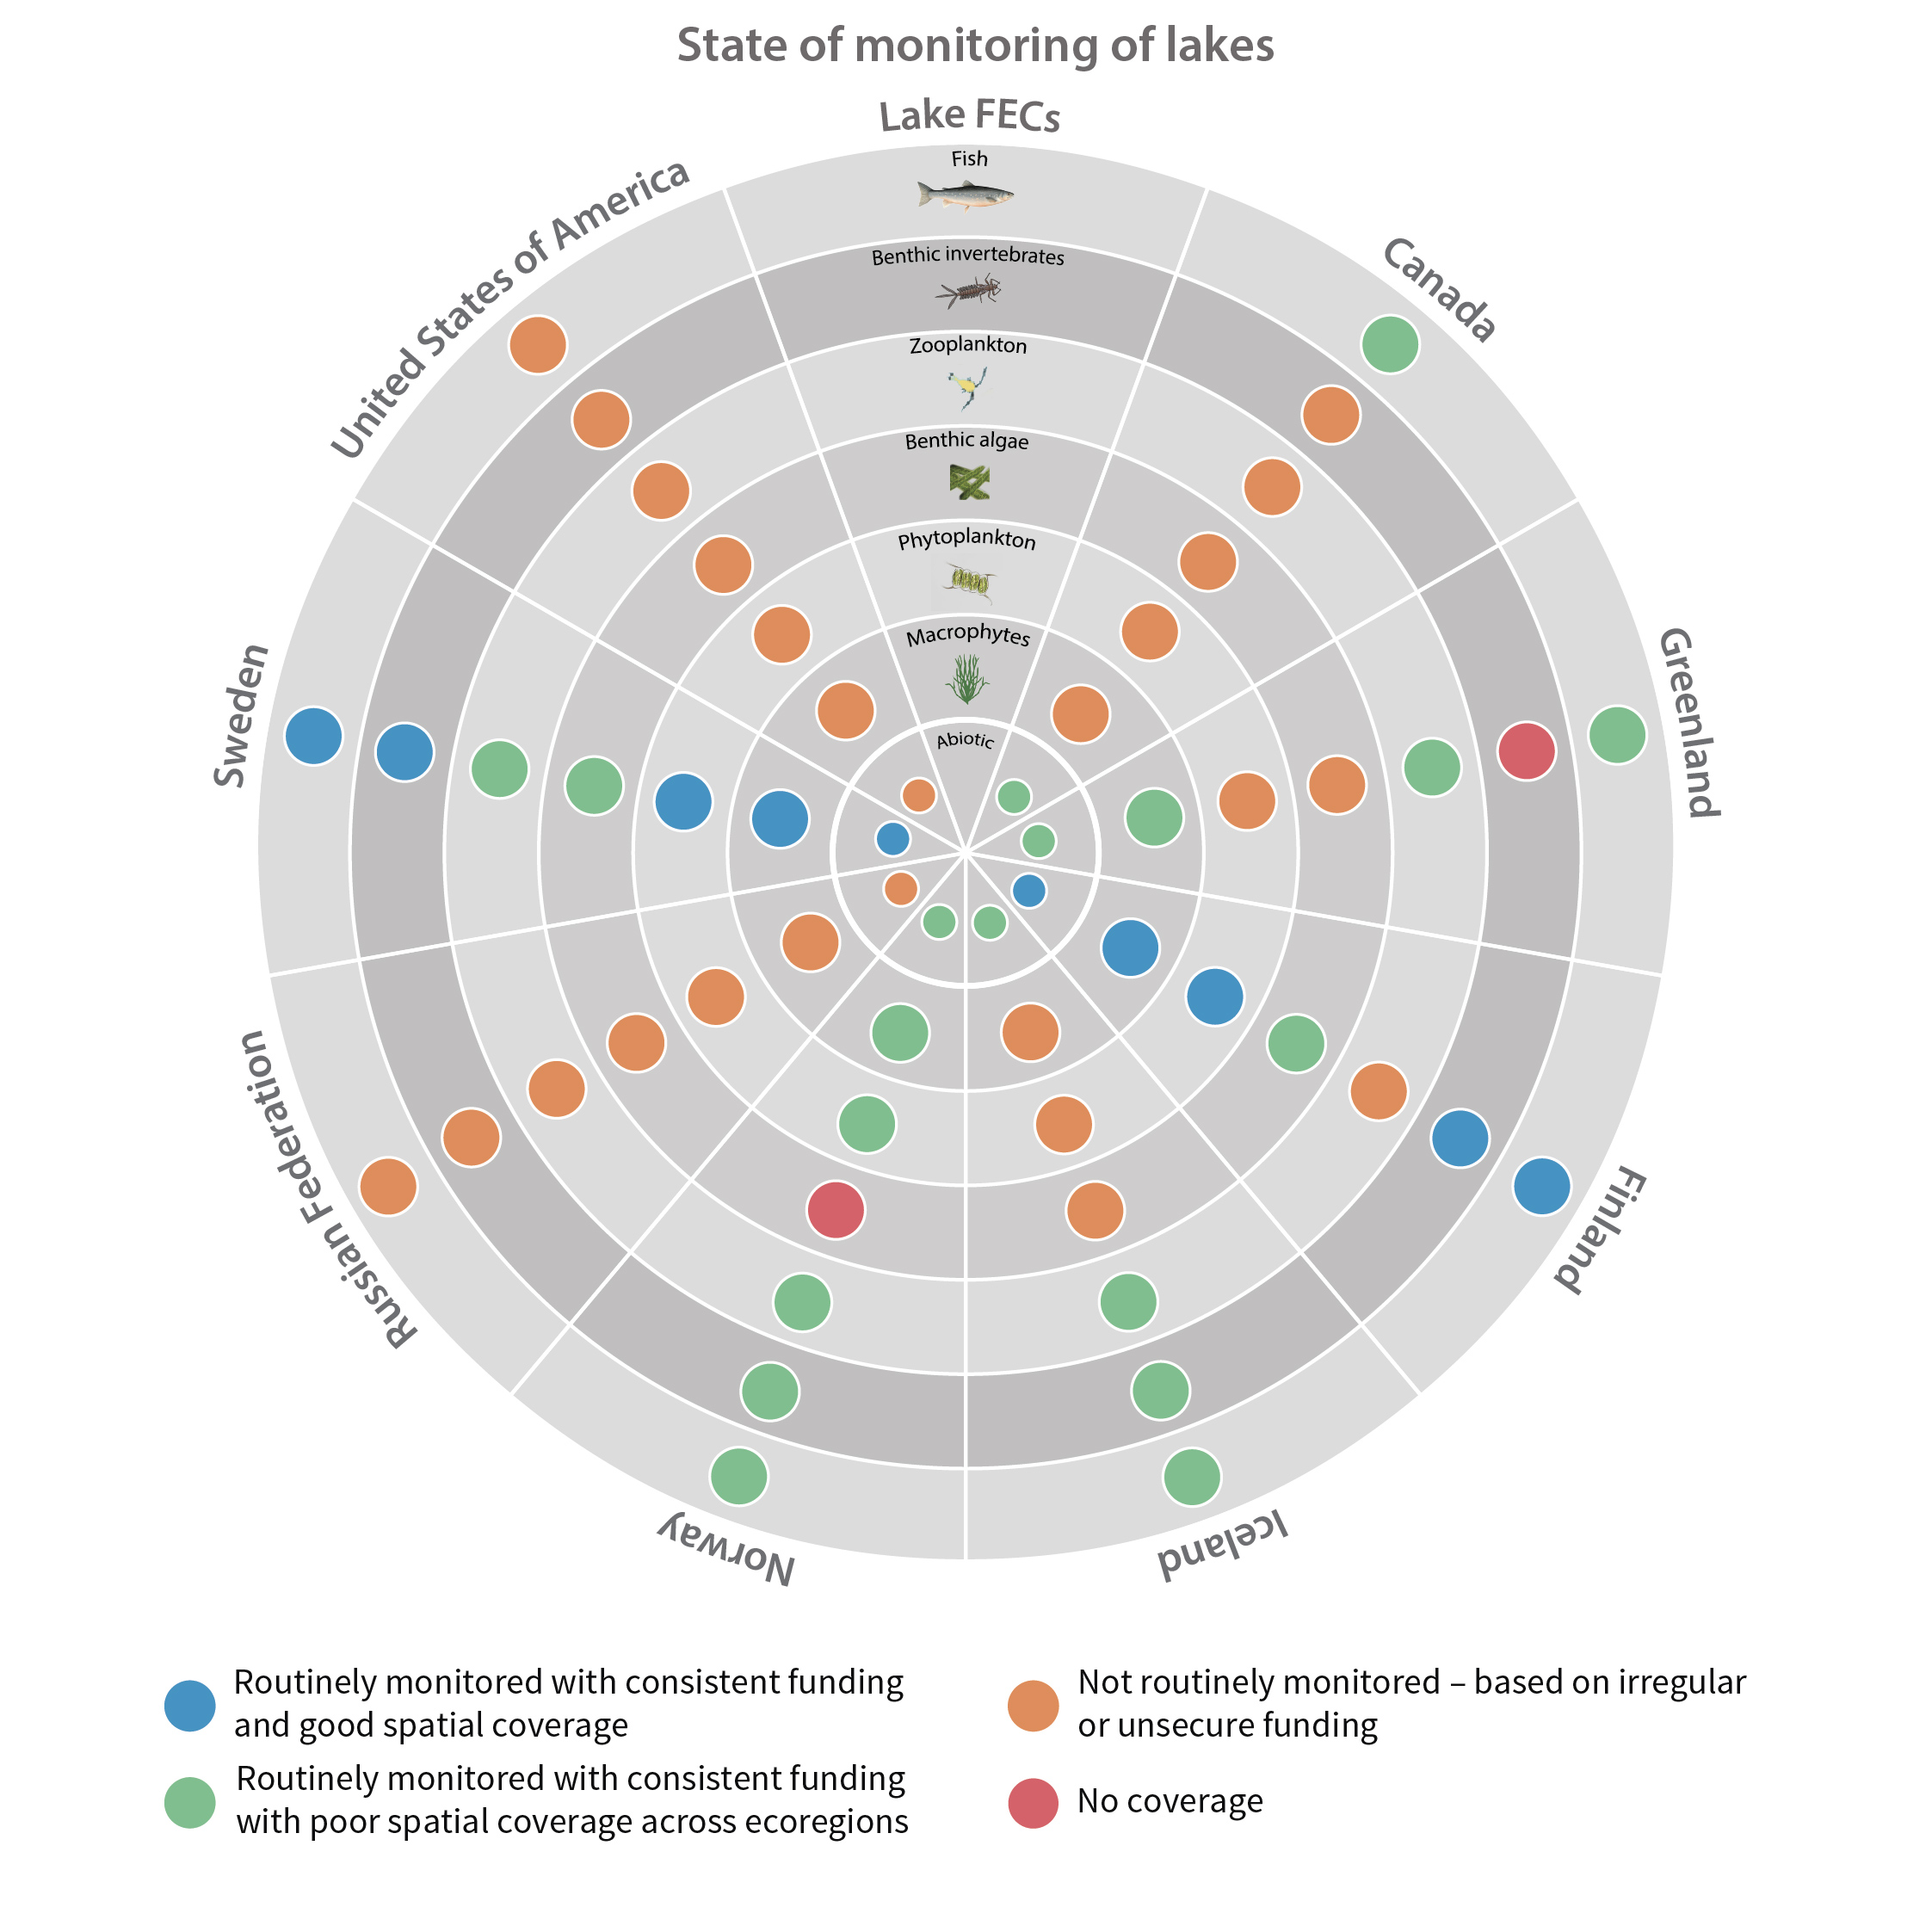
Although the circumpolar countries endeavor to support monitoring programs that provide good coverage of Arctic and subarctic regions, this ideal is constrained by the high costs associated with repeated sampling of a large set of lakes and rivers in areas that often are very remote. Consequently, freshwater monitoring has sparse, spatial coverage in large parts of the Arctic, with only Fennoscandia and Iceland having extensive monitoring coverage of lakes and streams Figure 6-1 Current state of monitoring for lake FECs in each Arctic country. State of the Arctic Freshwater Biodiversity Report - Chapter 6 - Page 93 - Figure 6-1
-
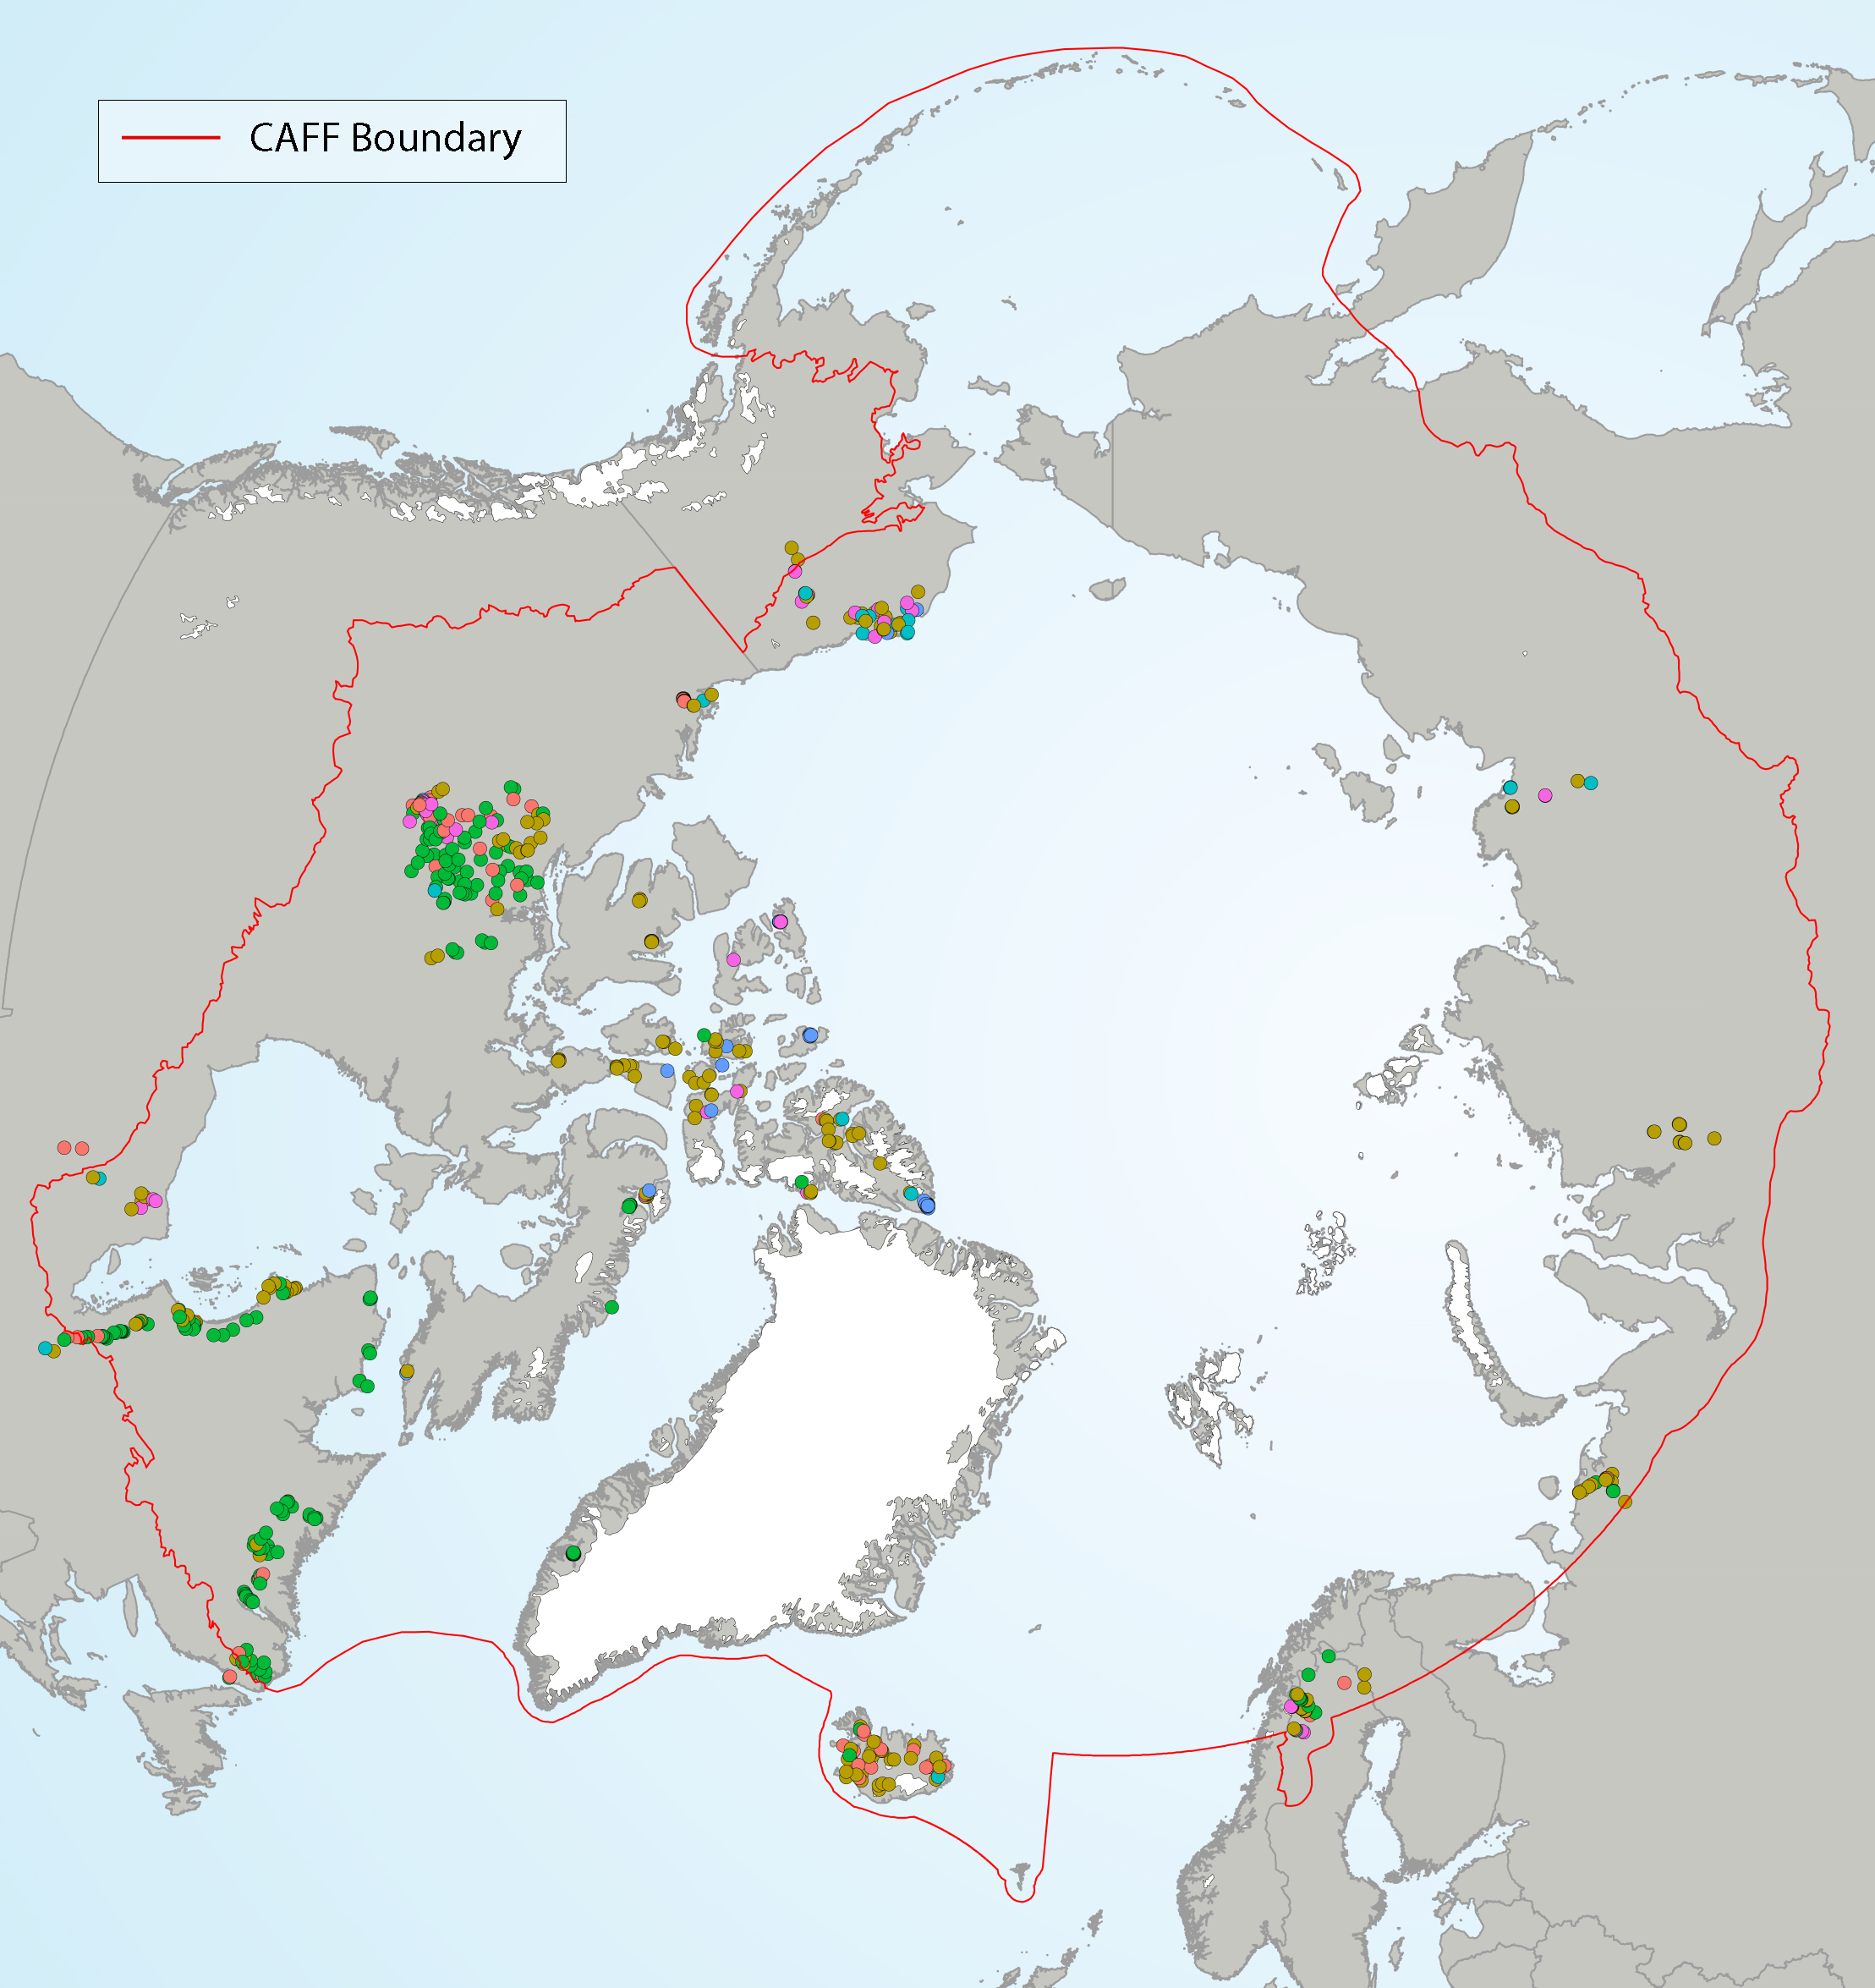
Figure 4 12 Diatom groups from Self Organizing Maps (SOMs) in lake top sediments, showing the geographical distribution of each group (with colors representing different SOM groups). State of the Arctic Freshwater Biodiversity Report - Chapter 4 - Page 39 - Figure 4-12
-
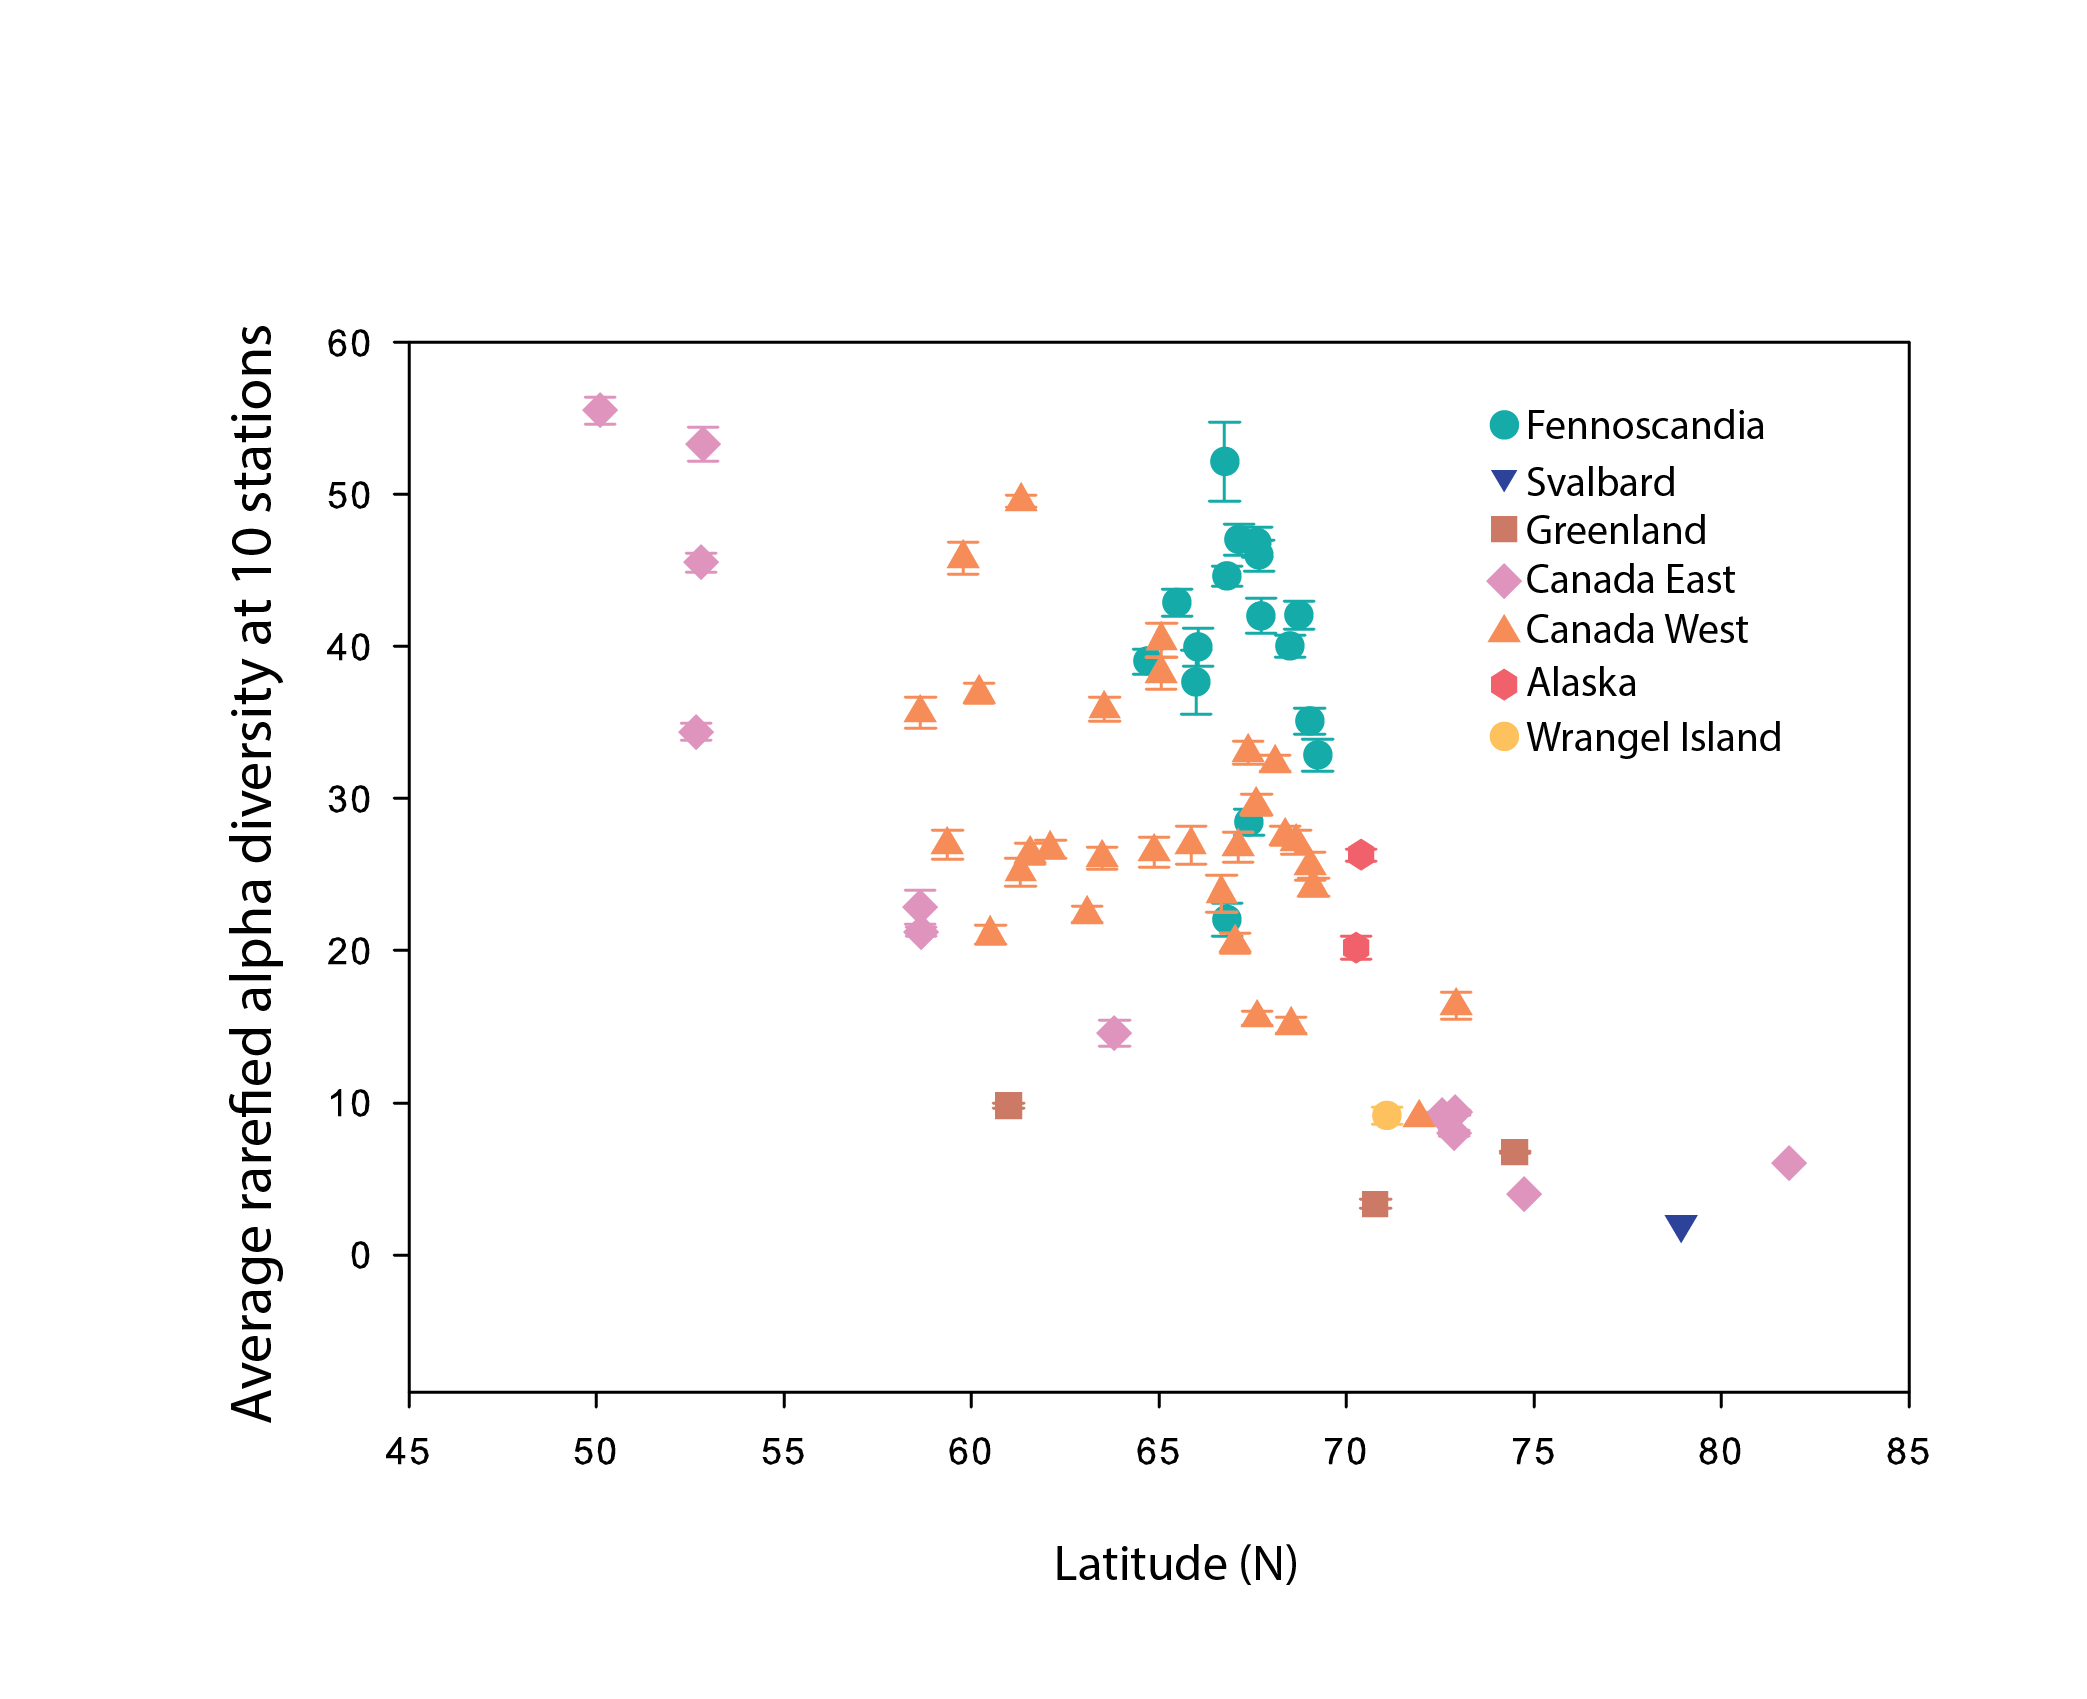
Alpha diversity (rarefied to 10 stations, with error bars indicating standard error) of river benthic macroinvertebrates plotted as a function of the average latitude of stations in each hydrobasin. Hydrobasins are coloured based on country/region State of the Arctic Freshwater Biodiversity Report - Chapter 4 - Page 68 - Figure 4-32