 CAFF - Arctic Biodiversity Data Service (ABDS)
Circumpolar Trends
Type of resources
Available actions
Topics
Keywords
Contact for the resource
Provided by
Representation types
Update frequencies
status
-
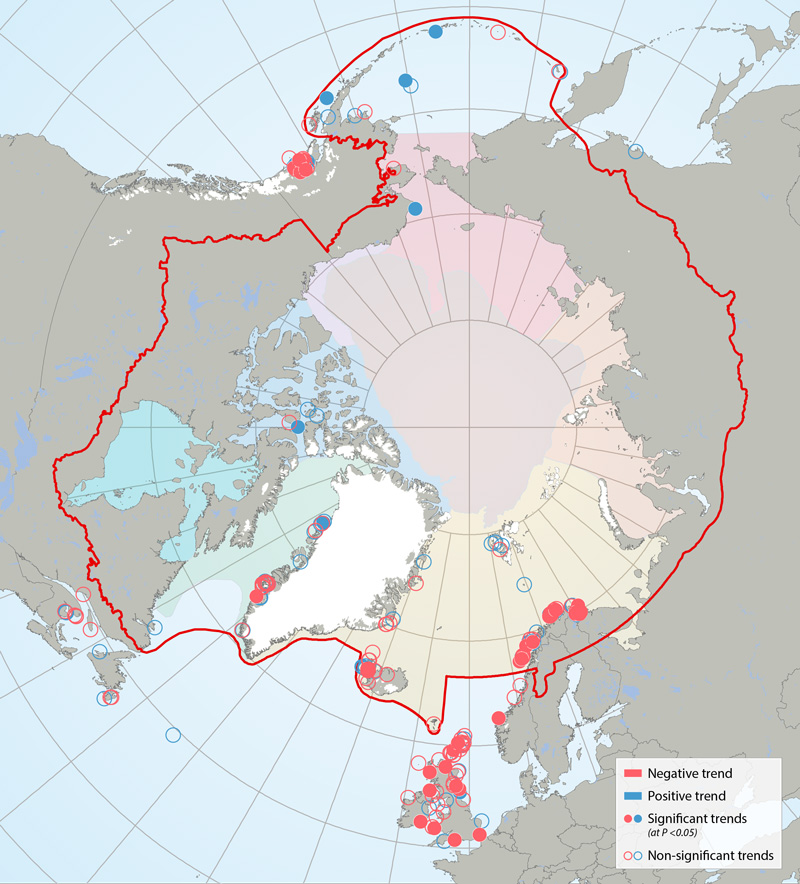
Trends in kittiwake colonies 2001-2010, based on linear regression with year as the explanatory variable. Slope of the regression is red = negative trend, blue = positive trend; shaded circle = significant trend (at p<0.05), open circle = non-significant trend. Non-significant deviation from zero could imply a stable population, but in some cases was due to low sample size and low power. Provided with permission from Descamps et al. (in prep). STATE OF THE ARCTIC MARINE BIODIVERSITY REPORT - <a href="https://arcticbiodiversity.is/findings/seabirds" target="_blank">Chapter 3</a> - Page 135 - Figure 3.5.3 This figure is compiled from data from researchers working throughout circumpolar regions, primarily members of the Circumpolar Seabird Group, an EN of CAFF/seabirds. Dr. Sebastien Decamps conducted the analysis and produced the original figure; the full results will be available in an article in prep titled: “Descamps et al. in prep. Circumpolar dynamics of black-legged kittiwakes track large-scale environmental shifts and oceans' warming rate.” [expected submission spring 2016]. Colony population trends were analyzed using a linear regression with the year as explanatory variable. Based on slope of the regression (which cannot be exactly 0) colonies are either Declining (Slope of the regression <0) or Increasing (Slope of the regression >0). (Colonies may have had a negative but not significant slope, and could be stable but for some others, the slope is not significant due to small sample size / low power; thus we cannot say that all colonies with a non- significant slope are stable. The threshold was put at 5% to assess the significance of the trend.