 CAFF - Arctic Biodiversity Data Service (ABDS)
Conservation of Arctic Flora and Fauna (CAFF)
Type of resources
Available actions
Topics
Keywords
Contact for the resource
Provided by
Years
Formats
Representation types
Update frequencies
status
Service types
Scale
-
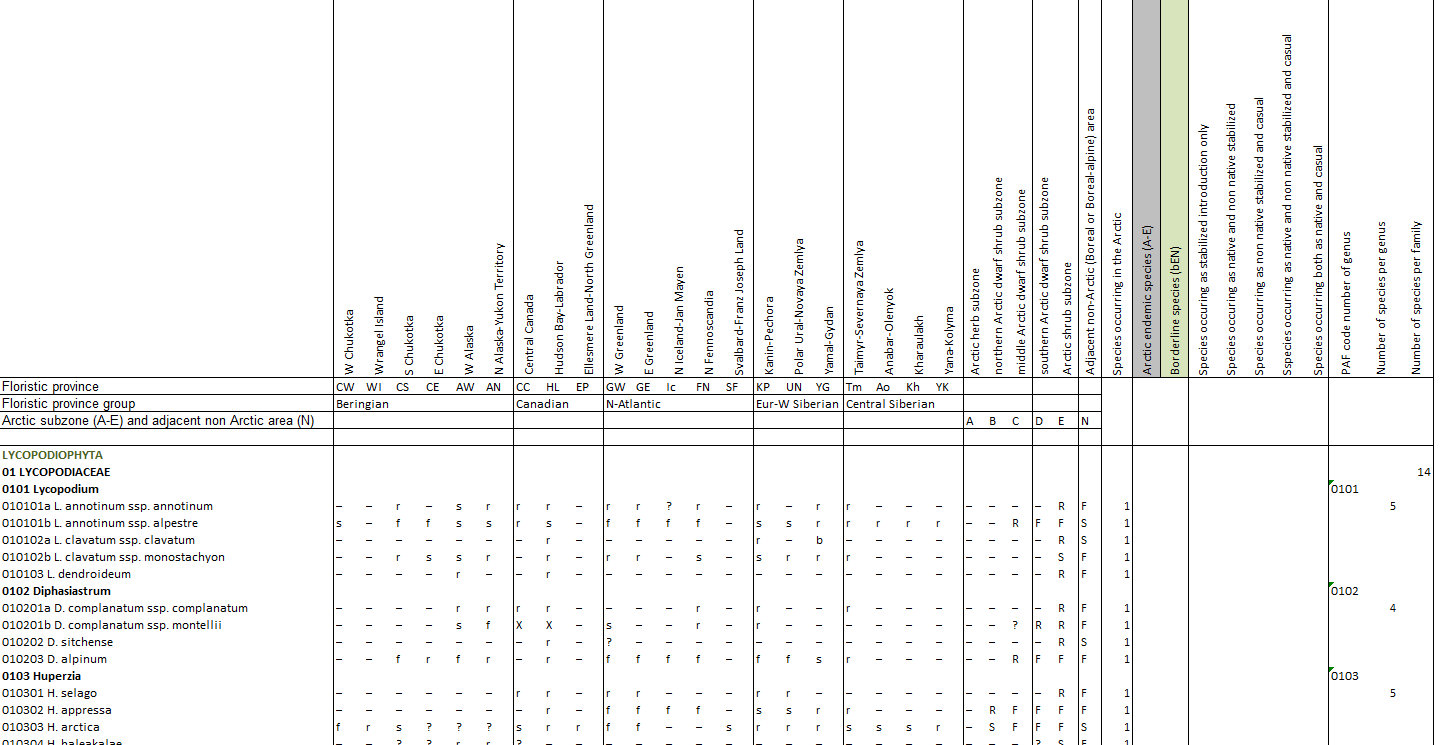
Appendix 9.1 List of all Arctic vascular plant species (with PAF code number) and their distribution in the 21 Arctic floristic provinces and 5 subzones based on Elven (2007).
-
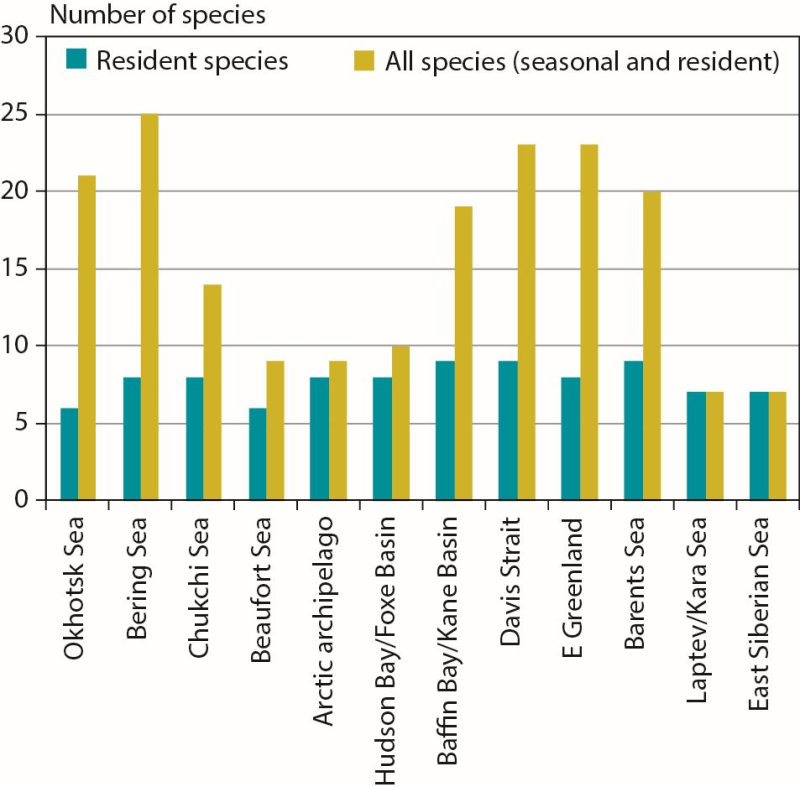
Number of marine mammal species in Arctic marine regions classified by resident species (n = 11 total) or all species (including seasonal visitors, n = 35 total). CAFF 2013. Arctic Biodiversity Assessment. Status and Trends in Arctic biodiversity. Conservation of Arctic Flora and Fauna, Akureyri - Mammal (Chapter 3) page 84
-
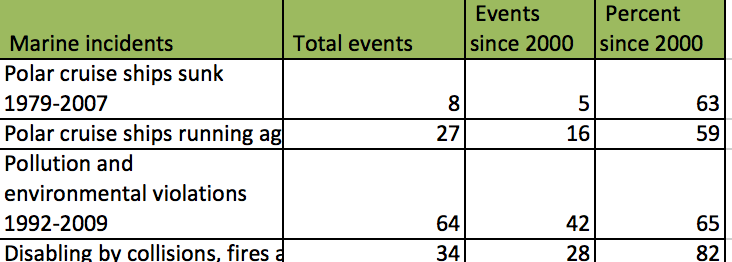
Arctic Biodiversity Assessment (ABA) 2013. Table 18.1. Marine incidents involving cruise ships in Arctic and Antarctic waters (the same vessels often alternate polar region according to season) (aggregated from reports from national coast guards, admiralty courts and insurers, and www.cruisejunkie.com).
-
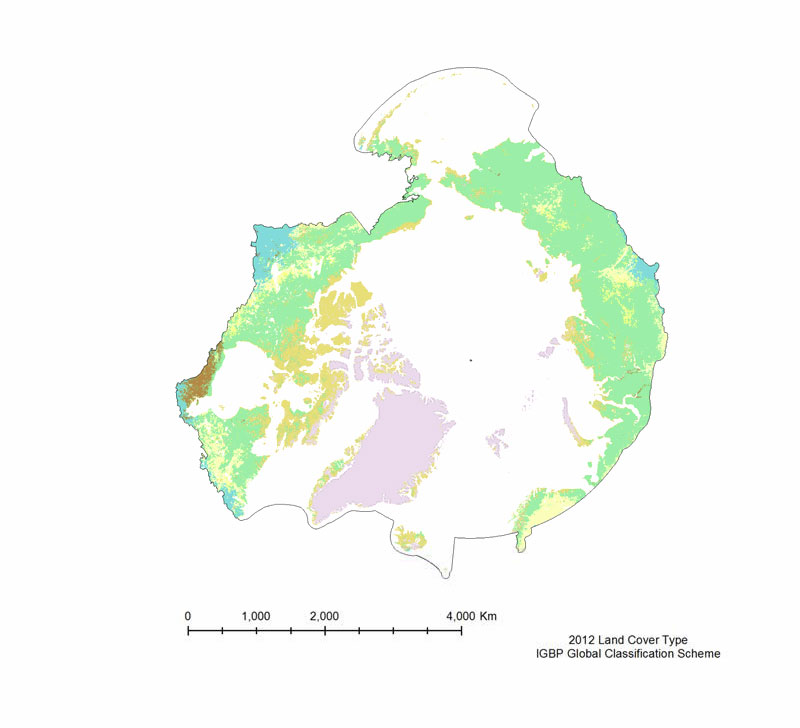
The MODIS Land Cover Type product is created yearly using three landclassification schemes; the International Geosphere Biosphere Programme (IGBP)classification scheme, the Univertiy of Maryland (UMD) classification scheme, and aMODIS-derived Leaf Area Index /Fraction of Photosynthetically Active Radiation(LAI/fPAR) classification scheme (Table 3). The International Geosphere Biosphere Programme (IGBP) identifies seventeenland cover classes, including eleven natural vegetation classes, three non-vegetated landclasses, and three developed land classes. The product provided is derived using the samealgorithm as the 500 m Land Cover Type (MOD12Q1), but is on a 0.05° Climate Model Grid(CMG), that has been clipped to the pan-Arctic extent. The UMD classification scheme issimilar to the IGBP classification scheme, but it excludes the Permanent wetlands,Cropland/Natural vegetation mosaic, and the Snow and ice classes. The LAI/fPARclassification scheme is the smallest of the three, and focuses on forest structure; it only haseleven classes. All three land cover classification schemes are provided, but the IGBPclassification scheme is the most amenable to the Pan-Arctic region.
-
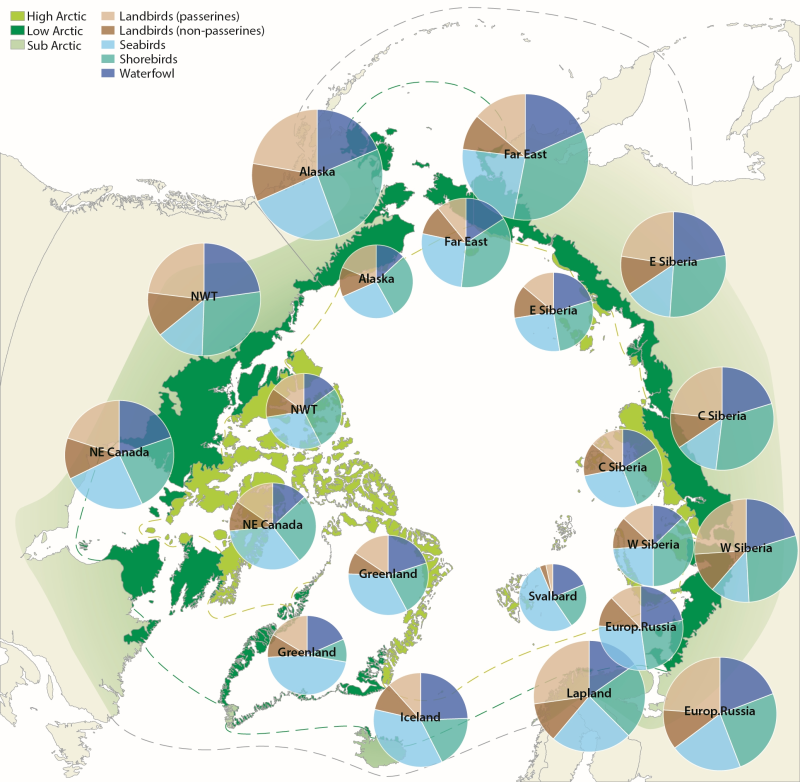
Figure 4.1. Avian biodiversity in different regions of the Arctic. Charts on the inner circle show species numbers of different bird groups in the high Arctic, on the outer circle in the low Arctic. The size of the charts is scaled to the number of species in each region, which ranges from 32 (Svalbard) to 117 (low Arctic Alaska). CAFF 2013. Arctic Biodiversity Assessment. Status and Trends in Arctic biodiversity. Conservation of Arctic Flora and Fauna, Akureyri - Birds (Chapter 4) page 145
-
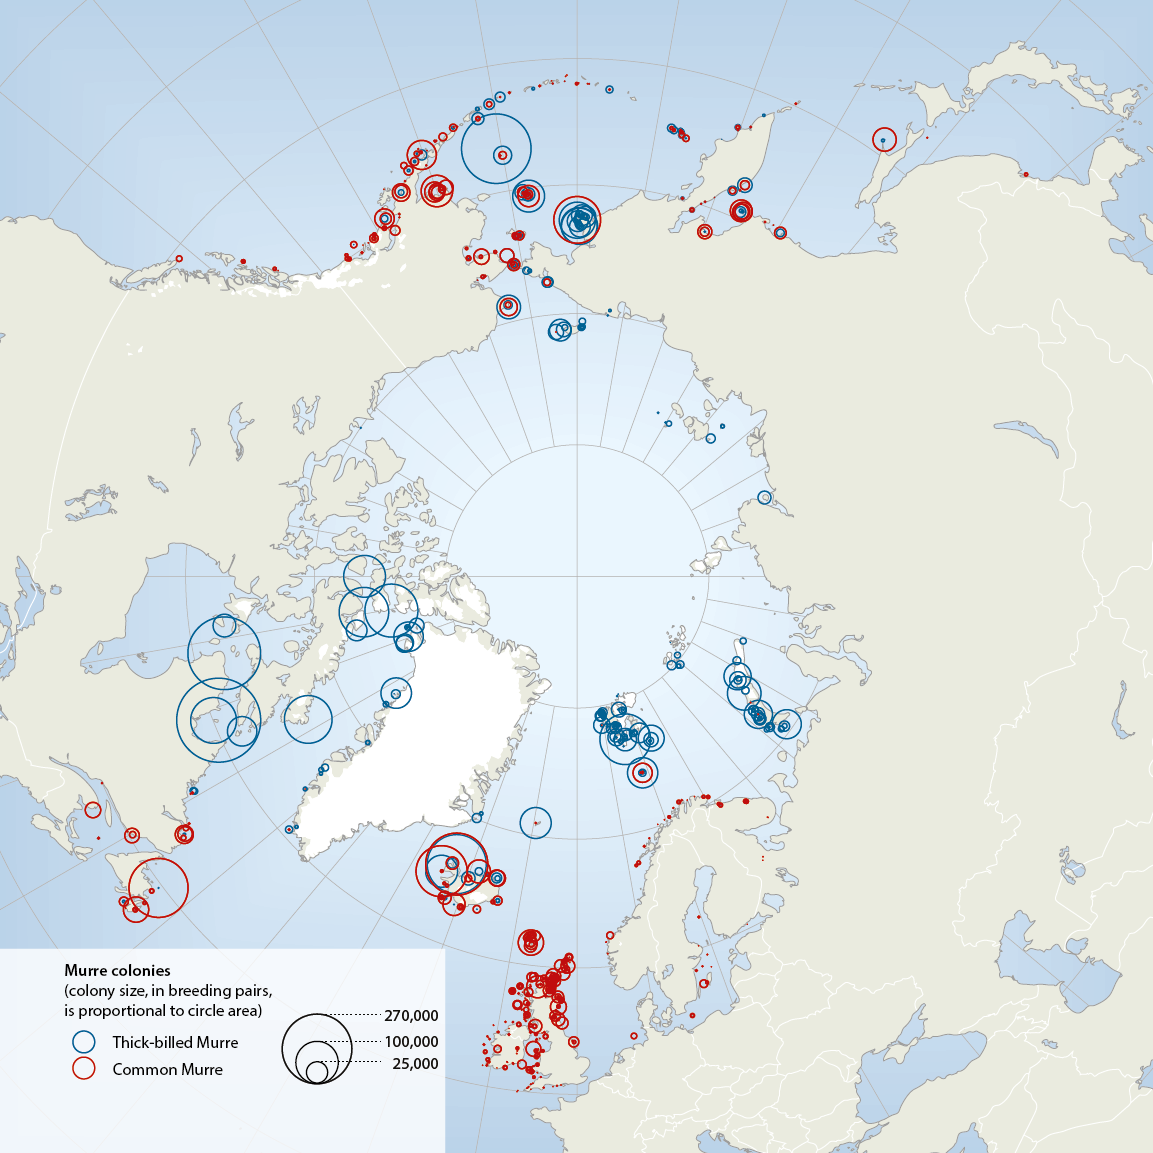
The two species of murres, thick-billed Uria lomvia and common U. aalge, both have circumpolar distributions, breeding in Arctic, sub-Arctic and temperate seas from alifornia and N Spain to N Greenland, high Arctic Canada, Svalbard, Franz Josef Land and Novaya Zemlya (Box 4.3 Fig. 1). Conservation of Arctic Flora and Fauna, CAFF 2013 - Akureyri . Arctic Biodiversity Assessment. Status and Trends in Arctic biodiversity. - Birds(Chapter 4) page 163
-
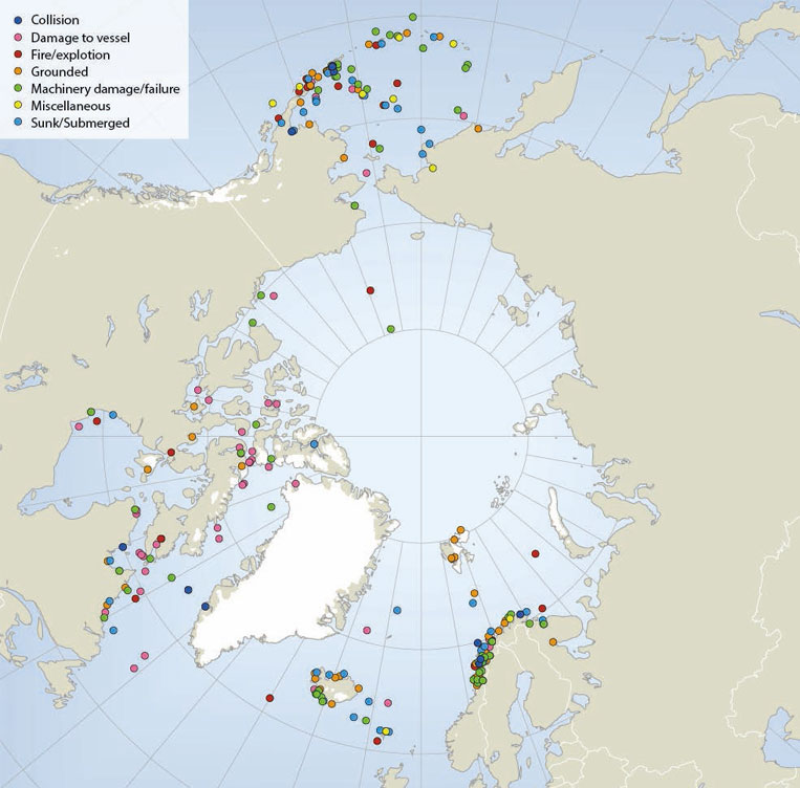
Locations of sub-Arctic and Arctic shipping accidents and incident causes, 1995-2004 (source: Arctic Marine Shipping Assessment 2009). Published in the Arctic Biodiversity Assessment (ABA) released in 2014.
-
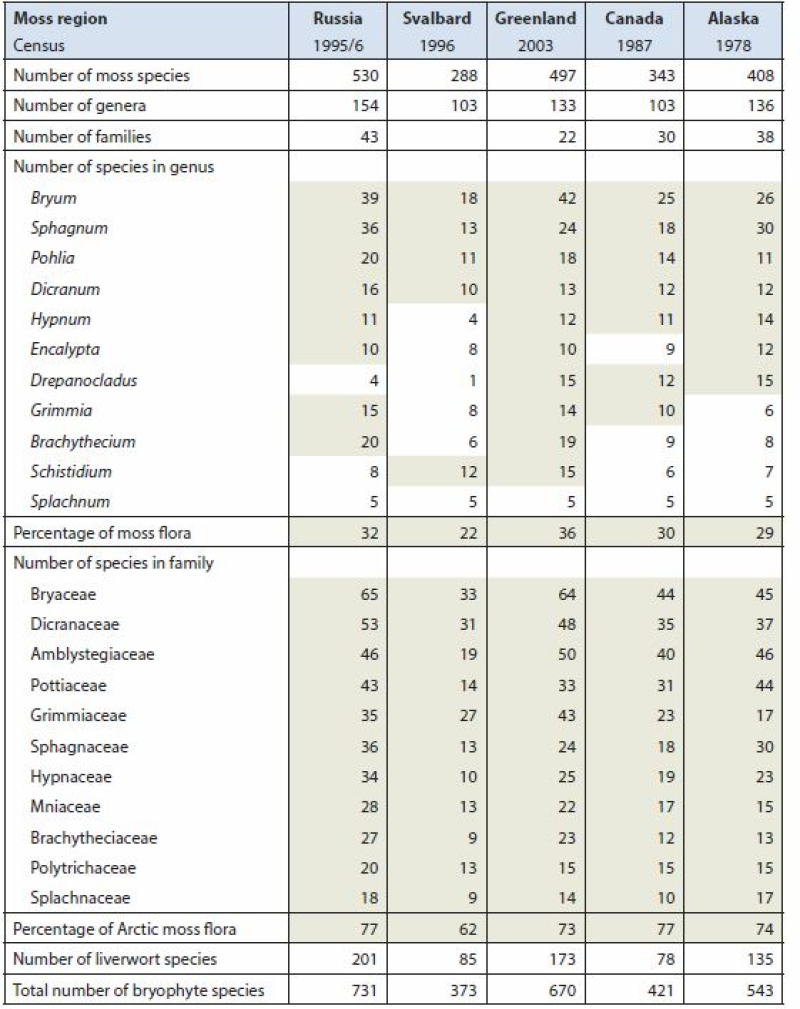
Arctic Biodiversity Assessment (ABA) 2013. Table 9.5. Species numbers of species-rich moss genera and families. Numbers highlighted in grey fields are used in calculating the percentage of the total moss flora. Listed are Splachnum, genera with at least 10 species and families with at least nine species. Conservation of Arctic Flora and Fauna, CAFF 2013 - Akureyri . Arctic Biodiversity Assessment. Status and Trends in Arctic biodiversity. - Plants(Chapter 9) page 333
-
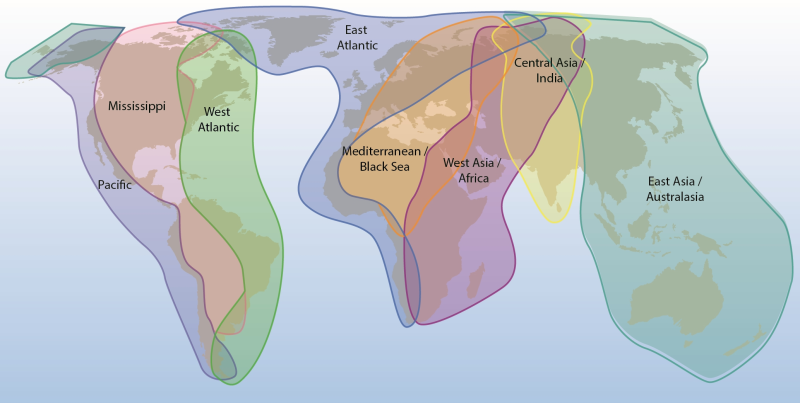
Arctic Biodiversity Assessment (ABA) 2013. Figure 4.2. Major flyways of Arctic birds. Bird migration links Arctic breeding areas to all other parts of the globe (adapted from ACIA 2005). Conservation of Arctic Flora and Fauna, CAFF 2013 - Akureyri . Arctic Biodiversity Assessment. Status and Trends in Arctic biodiversity. - Birds(Chapter 4) page 146
-
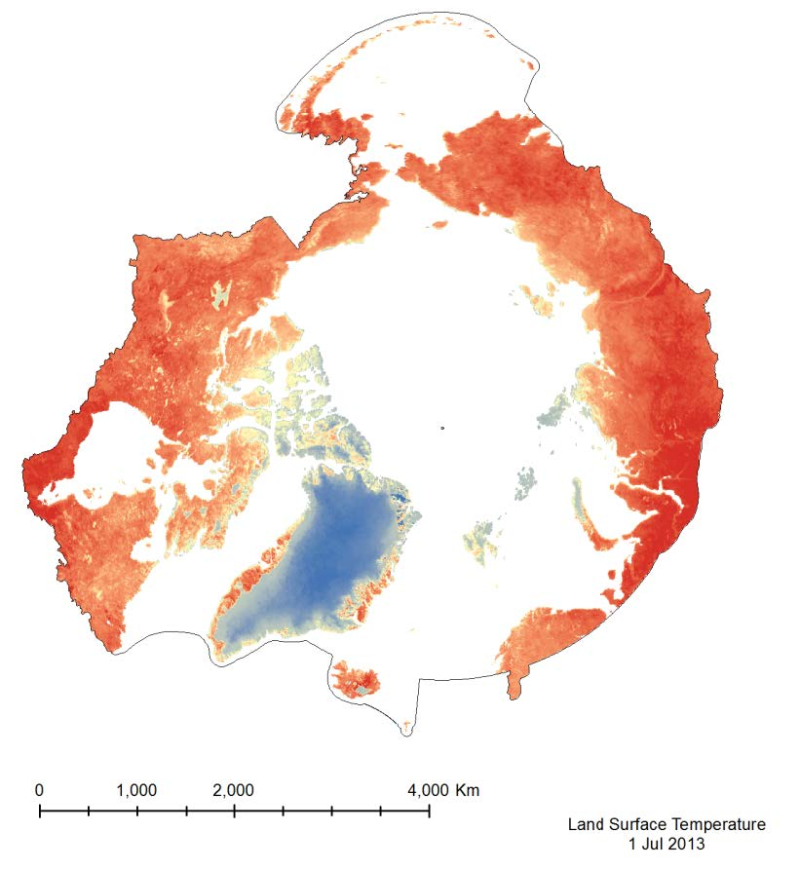
The MODIS Land Surface Temperature (LST) product provided is a monthlycomposite configured on a 0.05° Climate Model Grid (CMG). It includes both daytime andnighttime surface temperatures, taken at 11 um and 4 um (night). This product has beenscaled. To convert the raster values to a Kelvin temperature scale, multiply by a factor of 0.02.