 CAFF - Arctic Biodiversity Data Service (ABDS)
Sea regions
Type of resources
Available actions
Topics
Keywords
Contact for the resource
Provided by
Years
Formats
Representation types
Update frequencies
status
Scale
-
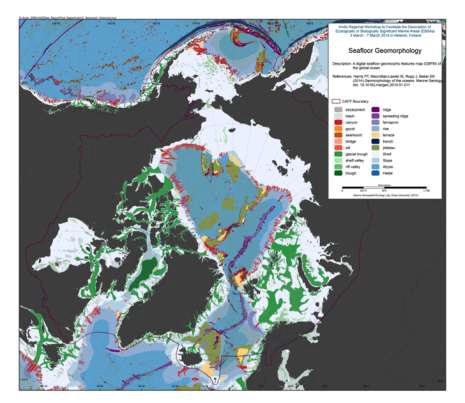
We present the first digital seafloor geomorphic features map (GSFM) of the global ocean. The GSFM includes 131,192 separate polygons in 29 geomorphic feature categories, used here to assess differences between passive and active continental margins as well as between 8 major ocean regions (the Arctic, Indian, North Atlantic, North Pacific, South Atlantic, South Pacific and the Southern Oceans and the Mediterranean and Black Seas). The GSFM provides quantitative assessments of differences between passive and active margins: continental shelf width of passive margins (88 km) is nearly three times that of active margins (31 km); the average width of active slopes (36 km) is less than the average width of passive margin slopes (46 km); active margin slopes contain an area of 3.4 million km2 where the gradient exceeds 5°, compared with 1.3 million km2 on passive margin slopes; the continental rise covers 27 million km2 adjacent to passive margins and less than 2.3 million km2 adjacent to active margins. Examples of specific applications of the GSFM are presented to show that: 1) larger rift valley segments are generally associated with slow-spreading rates and smaller rift valley segments are associated with fast spreading; 2) polar submarine canyons are twice the average size of non-polar canyons and abyssal polar regions exhibit lower seafloor roughness than non-polar regions, expressed as spatially extensive fan, rise and abyssal plain sediment deposits – all of which are attributed here to the effects of continental glaciations; and 3) recognition of seamounts as a separate category of feature from ridges results in a lower estimate of seamount number compared with estimates of previous workers. Reference: Harris PT, Macmillan-Lawler M, Rupp J, Baker EK Geomorphology of the oceans. Marine Geology.
-
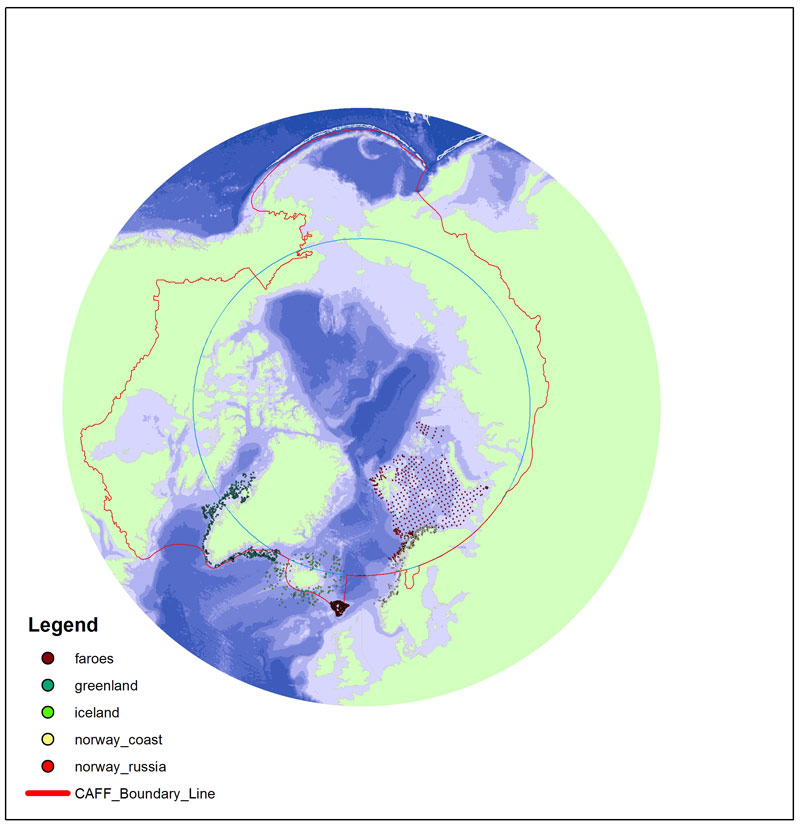
Long-term monitoring programs on benthic fauna are missing for large areas of the Arctic. In areas where repeated monitoring has occurred, it is difficult to compare data due to different sampling approaches and different targets of monitoring efforts. There is a need for an international standardization of long- term benthic monitoring. The CBMP Benthos Expert Network has identified potential ways to improve benthic monitoring coverage, and has come up with a map showing a Pan Arctic station map.
-
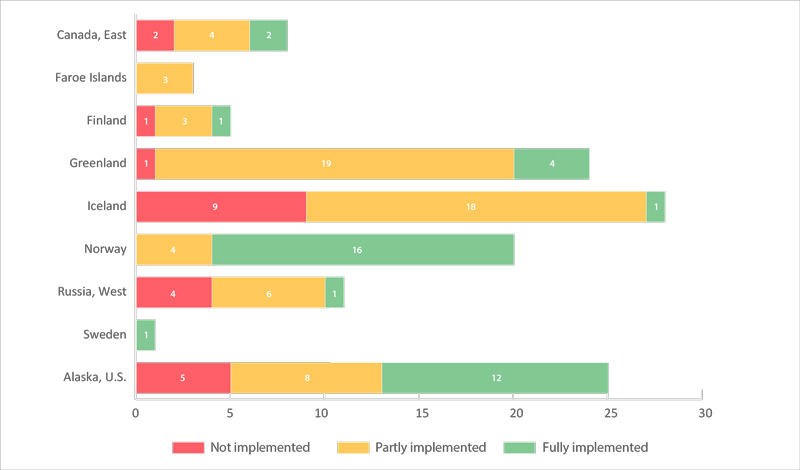
The number of key sites (monitored colonies) for seabirds (in 22 CSMP ecoregions) by country (a total of 125 sites). Sites are categorized as having fully, partially, or not met the CSMP criteria for parameters monitored (see 2.6.2). Data were from Appendix 3 of the CSMP (Irons et al. 2015); the degree of implementation may have changed at some sites since this summary was compiled. STATE OF THE ARCTIC MARINE BIODIVERSITY REPORT - <a href="https://arcticbiodiversity.is/findings/seabirds" target="_blank">Chapter 3</a> - Page 134 - Figure 3.5.2
-
Critical to the successful implementation of EBM in the Arctic is the existence of a cohesive circumpolar approach to the collection and management of data and the application of compatible frameworks, standards and protocols that this entails. STATE OF THE ARCTIC MARINE BIODIVERSITY REPORT - <a href="https://arcticbiodiversity.is/marine" target="_blank">Chapter 2</a> - Page 29 - Box Figure 2.2
-
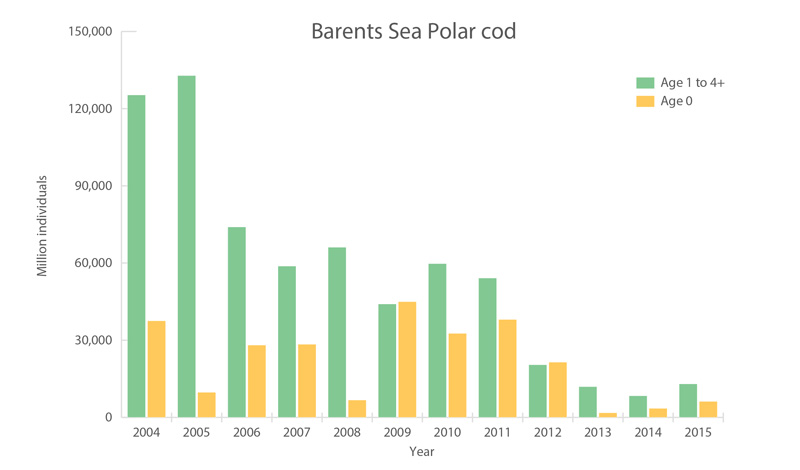
Polar cod in the Barents Sea. Acoustic estimate of polar cod 1-year-old and older (green) and pelagic trawl index of age 0-group abundance (yellow). Source: Joint IMR-PINRO ecosystem survey (Prozorkevich 2016). STATE OF THE ARCTIC MARINE BIODIVERSITY REPORT - <a href="https://arcticbiodiversity.is/findings/marine-fishes" target="_blank">Chapter 3</a> - Page 116 - Figure 3.4.3
-

We present the first digital seafloor geomorphic features map (GSFM) of the global ocean. The GSFM includes 131,192 separate polygons in 29 geomorphic feature categories, used here to assess differences between passive and active continental margins as well as between 8 major ocean regions (the Arctic, Indian, North Atlantic, North Pacific, South Atlantic, South Pacific and the Southern Oceans and the Mediterranean and Black Seas). The GSFM provides quantitative assessments of differences between passive and active margins: continental shelf width of passive margins (88 km) is nearly three times that of active margins (31 km); the average width of active slopes (36 km) is less than the average width of passive margin slopes (46 km); active margin slopes contain an area of 3.4 million km2 where the gradient exceeds 5°, compared with 1.3 million km2 on passive margin slopes; the continental rise covers 27 million km2 adjacent to passive margins and less than 2.3 million km2 adjacent to active margins. Examples of specific applications of the GSFM are presented to show that: 1) larger rift valley segments are generally associated with slow-spreading rates and smaller rift valley segments are associated with fast spreading; 2) polar submarine canyons are twice the average size of non-polar canyons and abyssal polar regions exhibit lower seafloor roughness than non-polar regions, expressed as spatially extensive fan, rise and abyssal plain sediment deposits – all of which are attributed here to the effects of continental glaciations; and 3) recognition of seamounts as a separate category of feature from ridges results in a lower estimate of seamount number compared with estimates of previous workers. Reference: Harris PT, Macmillan-Lawler M, Rupp J, Baker EK Geomorphology of the oceans. Marine Geology.
-
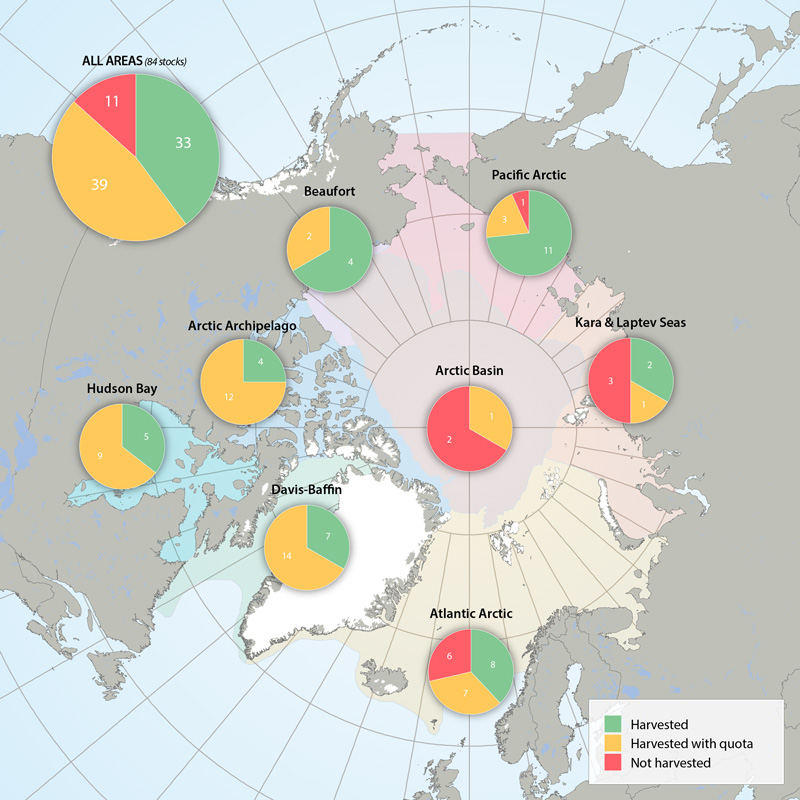
Harvest marine mammal Focal Ecosystem Component stocks in Arctic Marine Areas. Harvested without quotas, with quotas or not harvested. STATE OF THE ARCTIC MARINE BIODIVERSITY REPORT - <a href="https://arcticbiodiversity.is/findings/marine-mammals" target="_blank">Chapter 3</a> - Page 158 - Figure 3.6.4
-
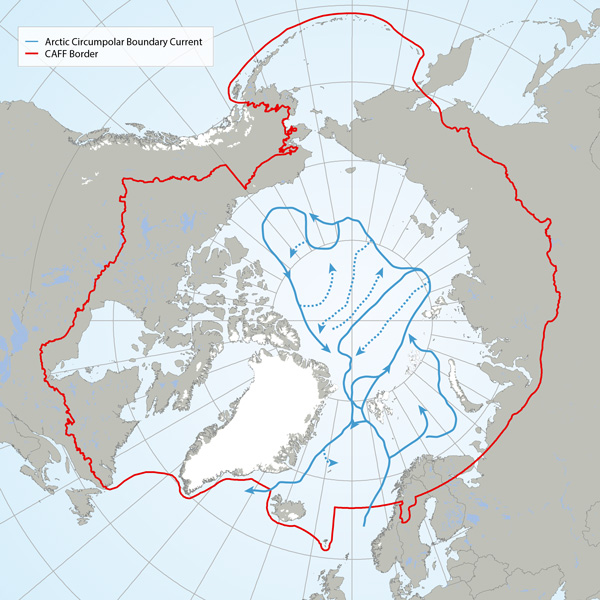
The Arctic Basin where suggested future long-term monitoring of trawl-megafauna should capture possible changes along the flow of the Arctic Circumpolar Boundary Current (Figure A, blue line) and the Arctic deep-water exchange (Figure b, green line). Adapted from Bluhm et al. (2015). STATE OF THE ARCTIC MARINE BIODIVERSITY REPORT - <a href="https://arcticbiodiversity.is/findings/benthos" target="_blank">Chapter 3</a> - Page 88 - Figure 3.3.1
-
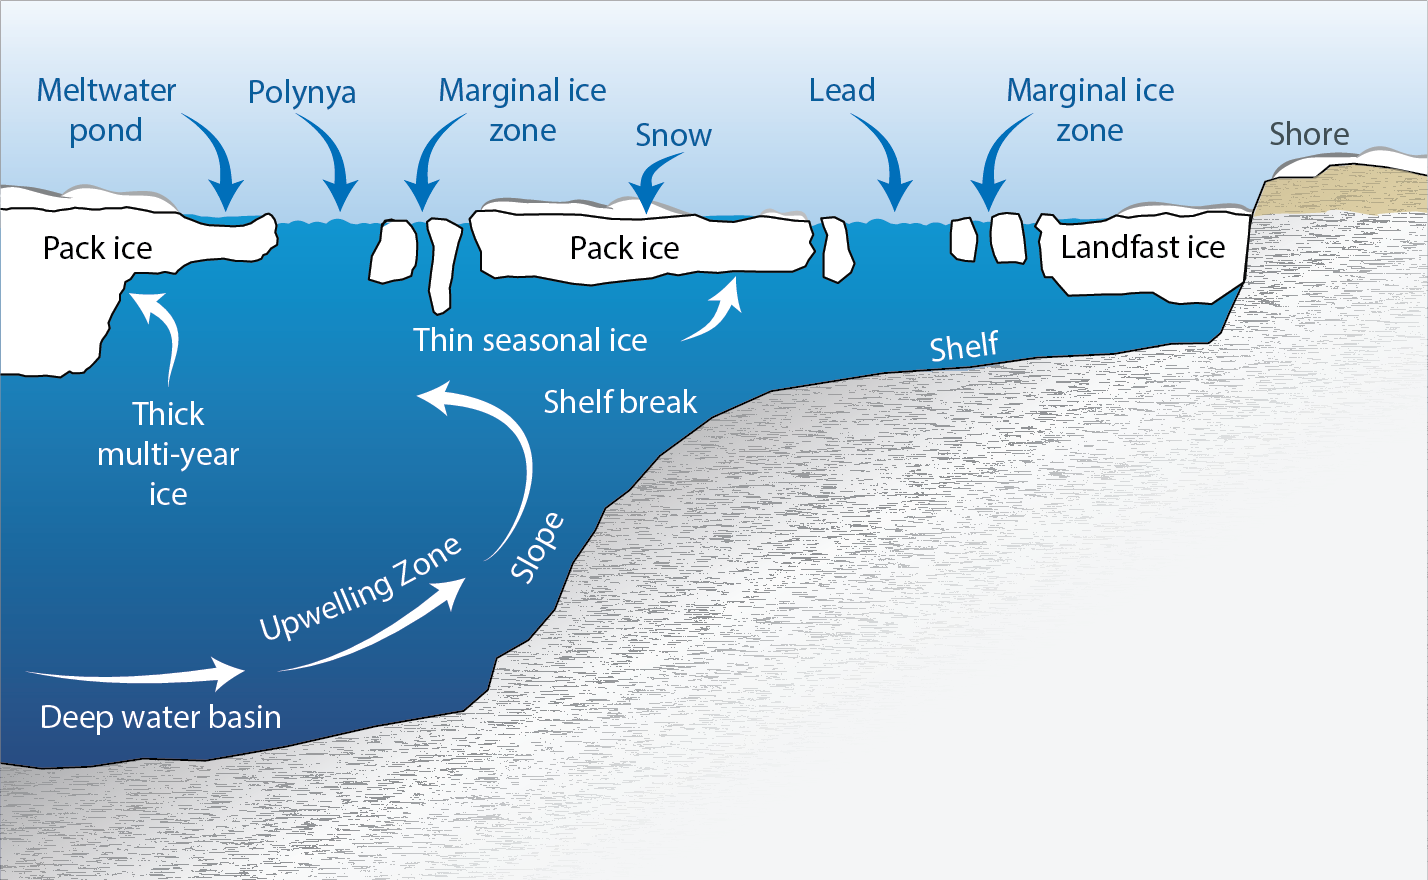
Some features of the sea ice environment. Marine areas seasonally or permanently covered by sea ice are a globally unique habitat. Ice edges and open water areas favour wind-driven mixing of the seawater that enhances local production and can create biological hotspots. Adapted from Eamer et al. (2013). STATE OF THE ARCTIC MARINE BIODIVERSITY REPORT - <a href="https://arcticbiodiversity.is/marine" target="_blank">Chapter 2</a> - Page 20 - Box Fig 2.1
-
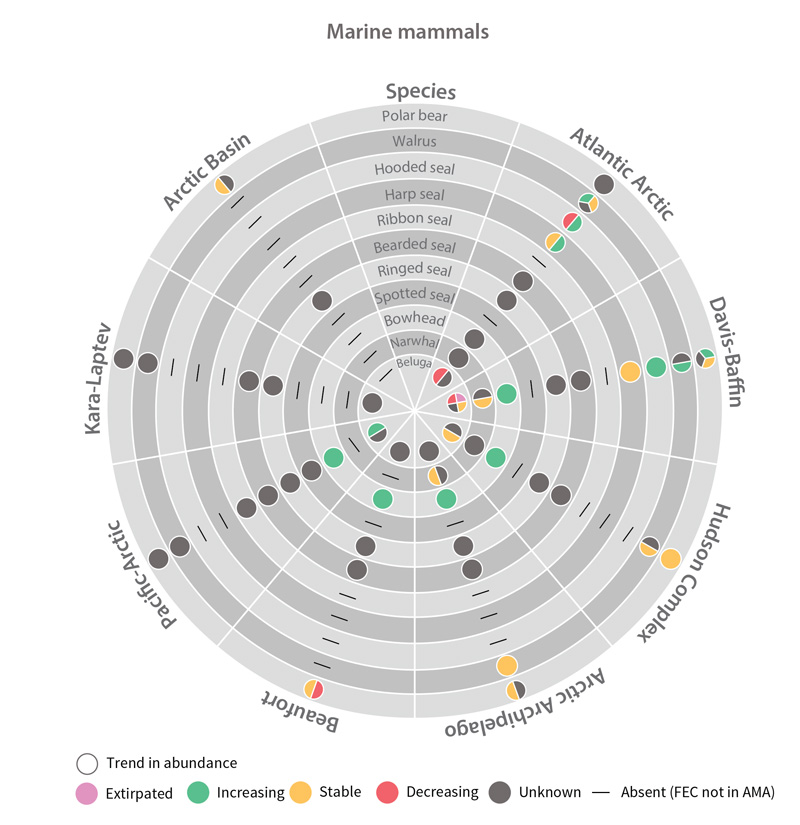
Trends in abundance of marine mammal Focal Ecosystem Components across each Arctic Marine Area. STATE OF THE ARCTIC MARINE BIODIVERSITY REPORT - Chapter 4 - Page 182 - Figure 4.6