 CAFF - Arctic Biodiversity Data Service (ABDS)
oceans
Type of resources
Available actions
Topics
Keywords
Contact for the resource
Provided by
Years
Formats
Representation types
Update frequencies
status
Scale
-
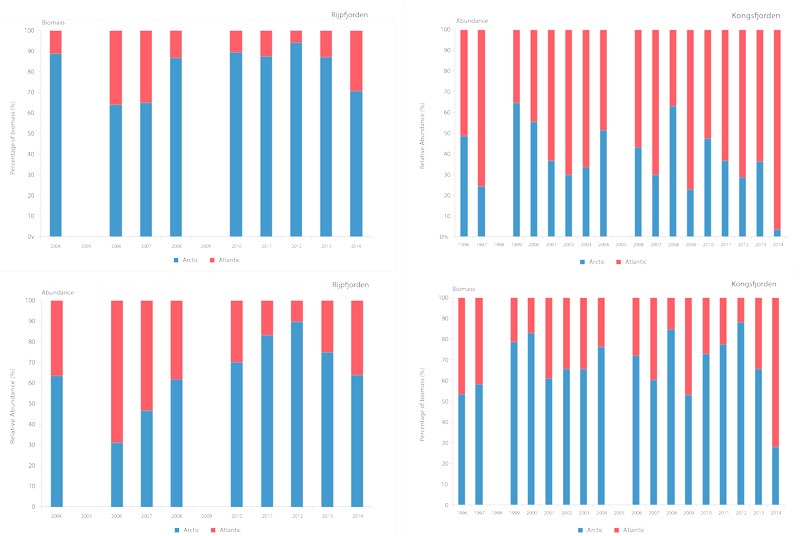
Time series of relative proportions of Arctic and Atlantic Calanus species in Kongsfjorden (top) and Rijpfjorden (bottom) (Source: MOSJ, Norwegian Polar Institute). STATE OF THE ARCTIC MARINE BIODIVERSITY REPORT - <a href="https://arcticbiodiversity.is/findings/plankton" target="_blank">Chapter 3</a> - Page 77 - Figure 3.2.8
-
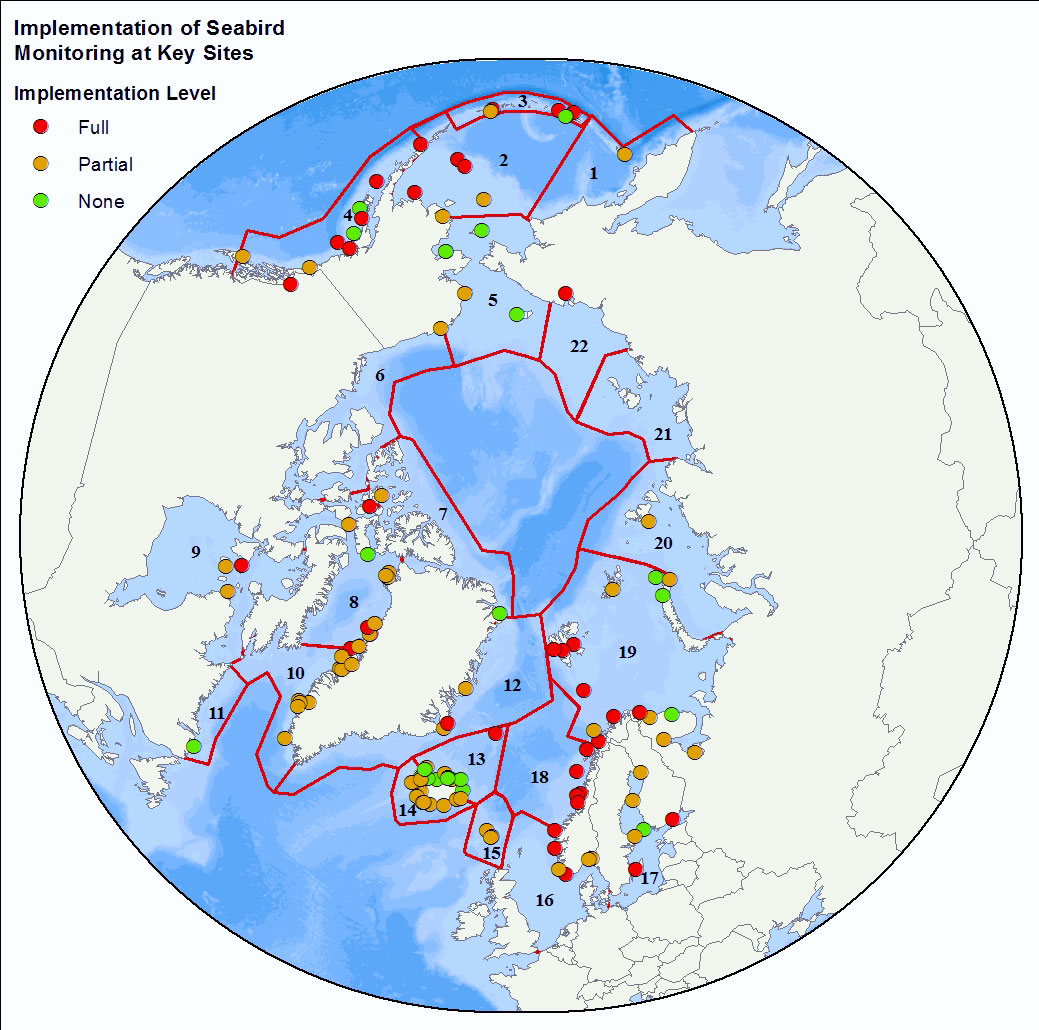
<img width="80px" height="67px" alt="logo" align="left" hspace="10px" src="http://geo.abds.is/geonetwork/srv/eng//resources.get?uuid=7d8986b1-fbd1-4e1a-a7c8-a4cef13e8eca&fname=cbird.png">The Circumpolar Seabird Monitoring Plan is designed to 1) monitor populations of selected Arctic seabird species, in one or more Arctic countries; 2) monitor, as appropriate, survival, diets, breeding phenology, and productivity of seabirds in a manner that allows changes to be detected; 3) provide circumpolar information on the status of seabirds to the management agencies of Arctic countries, in order to broaden their knowledge beyond the boundaries of their country thereby allowing management decisions to be made based on the best available information; 4) inform the public through outreach mechanisms as appropriate; 5) provide information on changes in the marine ecosystem by using seabirds as indicators; and 6) quickly identify areas or issue in the Arctic ecosystem such as declining biodiversity or environmental pressures to target further research and plan management and conservation measures. - <a href="http://caff.is" target="_blank"> Circumpolar Seabird Monitoring plan </a>
-
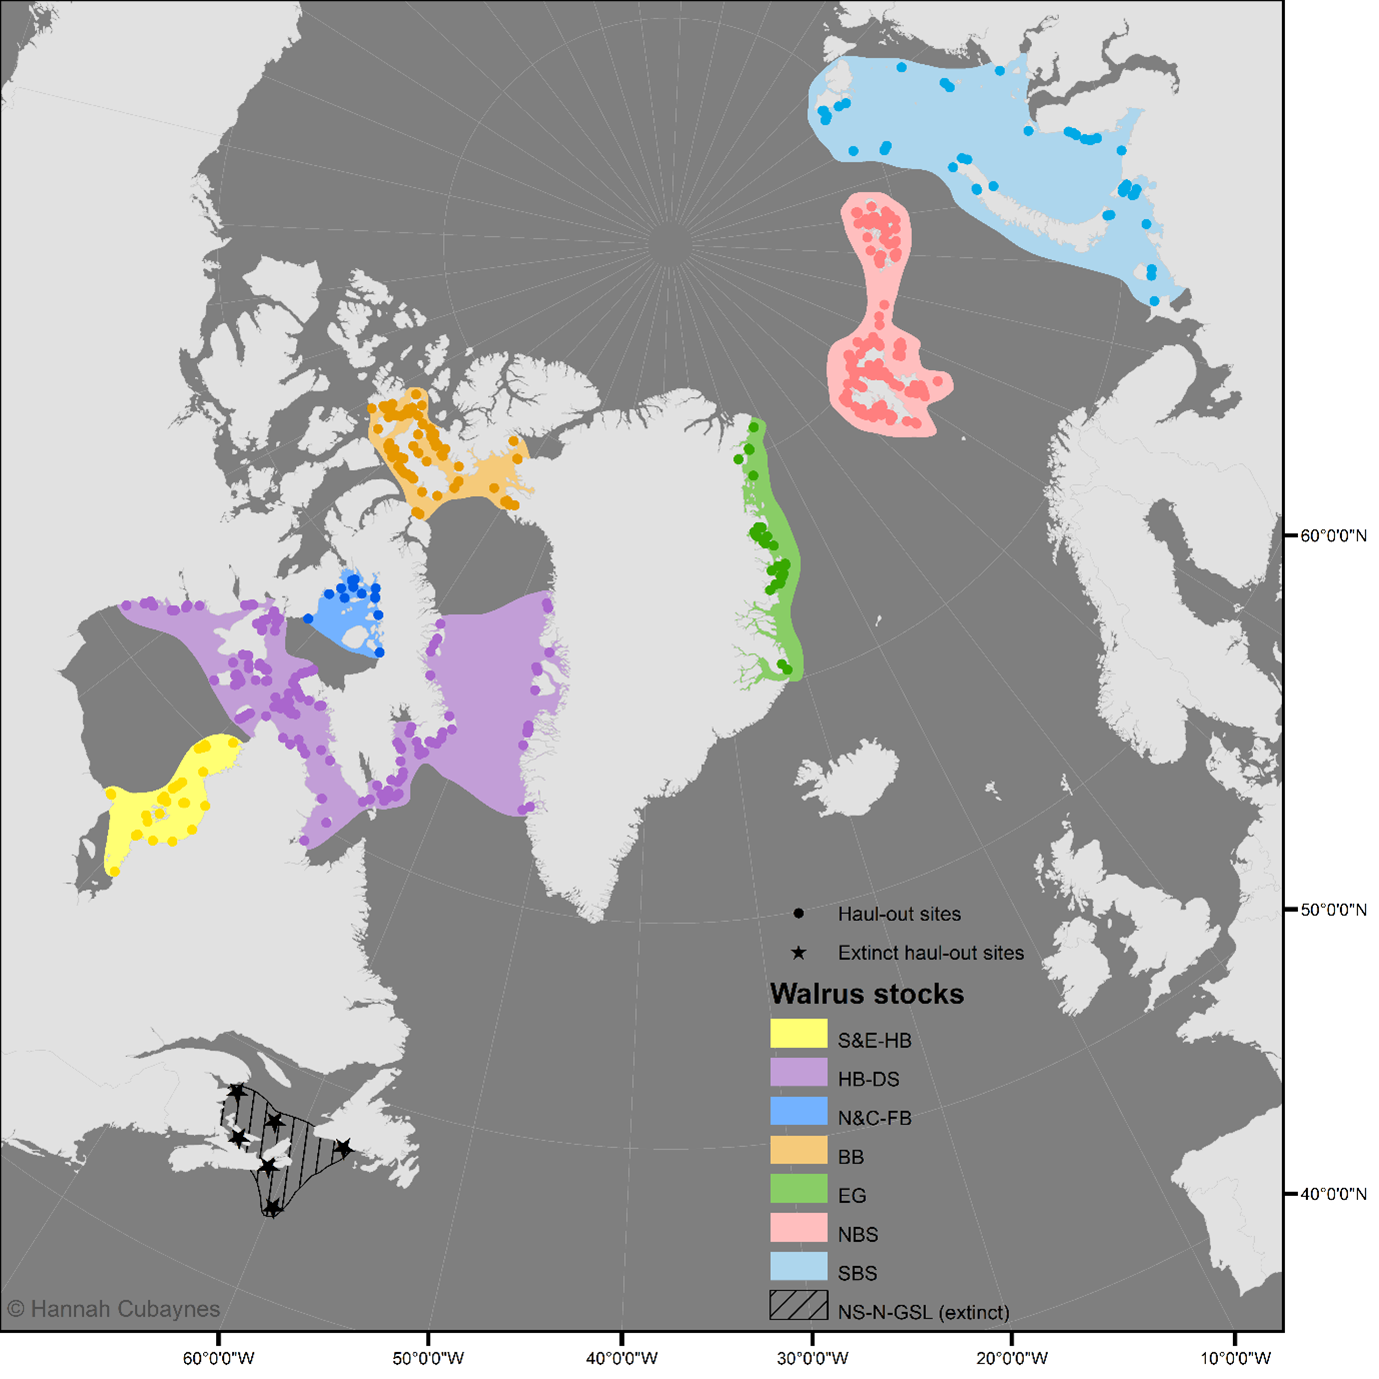
A dataset compiling all known terrestrial haul-out sites for the Atlantic walrus. The dataset comprises of the following documents: (1) the database in .csv format: walrus_haulout_database_Atlantic_caff_v4.csv; (2) the database in .shp format: walrus_haulout_database_Atlantic_caff_v4.shp; and (3) a user guidance document: user_guidance_atlantic_walrus_db.docx. The dataset will be updated annually. The latest update was 14th May 2025.
-
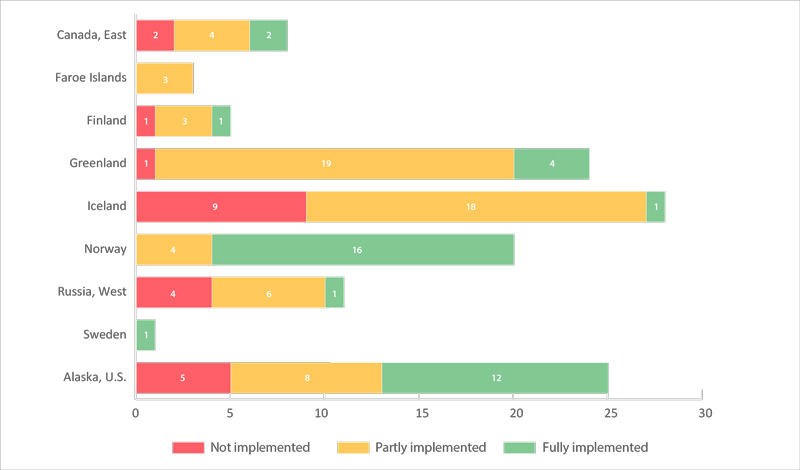
The number of key sites (monitored colonies) for seabirds (in 22 CSMP ecoregions) by country (a total of 125 sites). Sites are categorized as having fully, partially, or not met the CSMP criteria for parameters monitored (see 2.6.2). Data were from Appendix 3 of the CSMP (Irons et al. 2015); the degree of implementation may have changed at some sites since this summary was compiled. STATE OF THE ARCTIC MARINE BIODIVERSITY REPORT - <a href="https://arcticbiodiversity.is/findings/seabirds" target="_blank">Chapter 3</a> - Page 134 - Figure 3.5.2
-
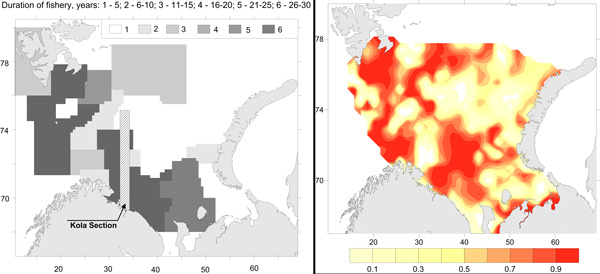
Commercial fishery impact on zoobenthos of the Barents Sea. Figure A) Intensity and duration of fishery efforts in standard commercial fishery areas in the Barents Sea. The darker the area the longer the fishery has been in operation. Figure B) Level of decline in macrobenthic biomass between 1926-1932 and 1968-1970 calculated as 1-b1968/b1930. The largest biomass decreases correspond to the darker colour, whereas lighter colour refers to no change (Denisenko 2013). STATE OF THE ARCTIC MARINE BIODIVERSITY REPORT - <a href="https://arcticbiodiversity.is/findings/benthos" target="_blank">Chapter 3</a> - Page 97 - Figure 3.3.4
-
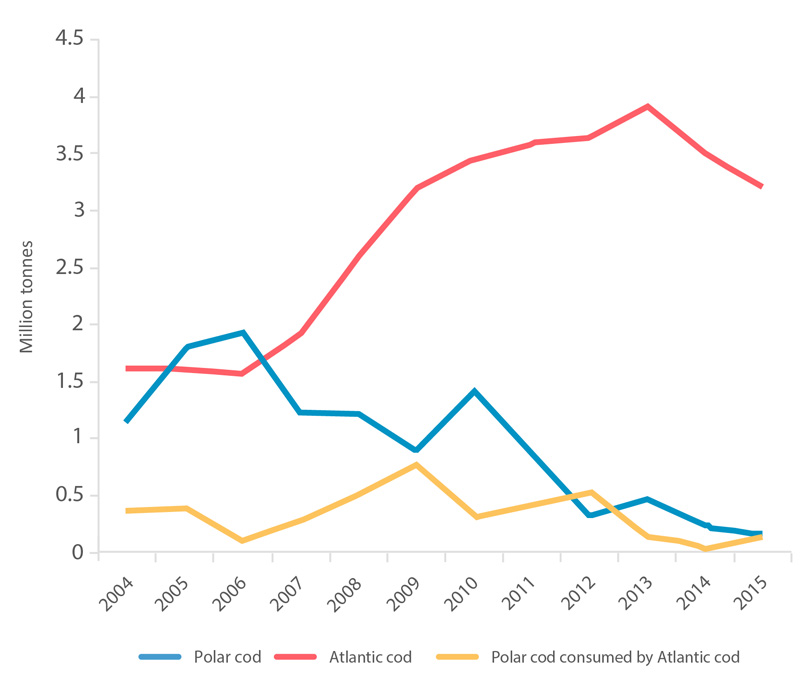
Estimated consumption of polar cod by Atlantic cod in the Barents Sea (yellow line) and biomass of the Atlantic cod stock in the Barents Sea (red line) (ICES 2016). The blue line is the biomass of the Barents Sea polar cod (Prozorkevich 2016). STATE OF THE ARCTIC MARINE BIODIVERSITY REPORT - <a href="https://arcticbiodiversity.is/findings/marine-fishes" target="_blank">Chapter 3</a> - Page 116 - Box figure 3.4.1
-
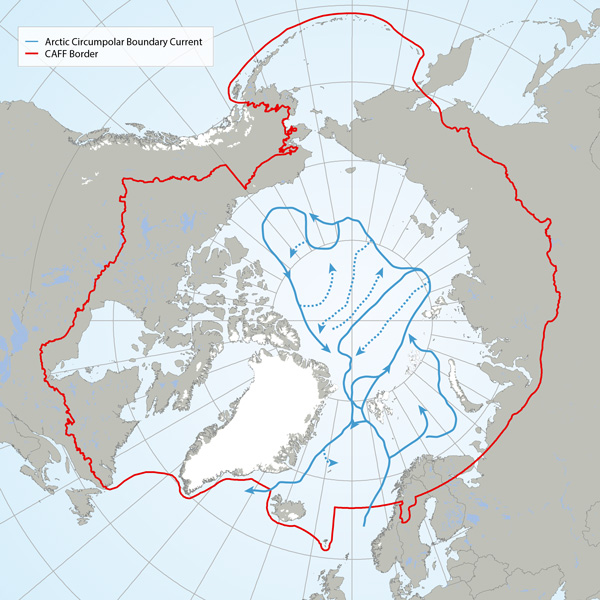
The Arctic Basin where suggested future long-term monitoring of trawl-megafauna should capture possible changes along the flow of the Arctic Circumpolar Boundary Current (Figure A, blue line) and the Arctic deep-water exchange (Figure b, green line). Adapted from Bluhm et al. (2015). STATE OF THE ARCTIC MARINE BIODIVERSITY REPORT - <a href="https://arcticbiodiversity.is/findings/benthos" target="_blank">Chapter 3</a> - Page 88 - Figure 3.3.1
-
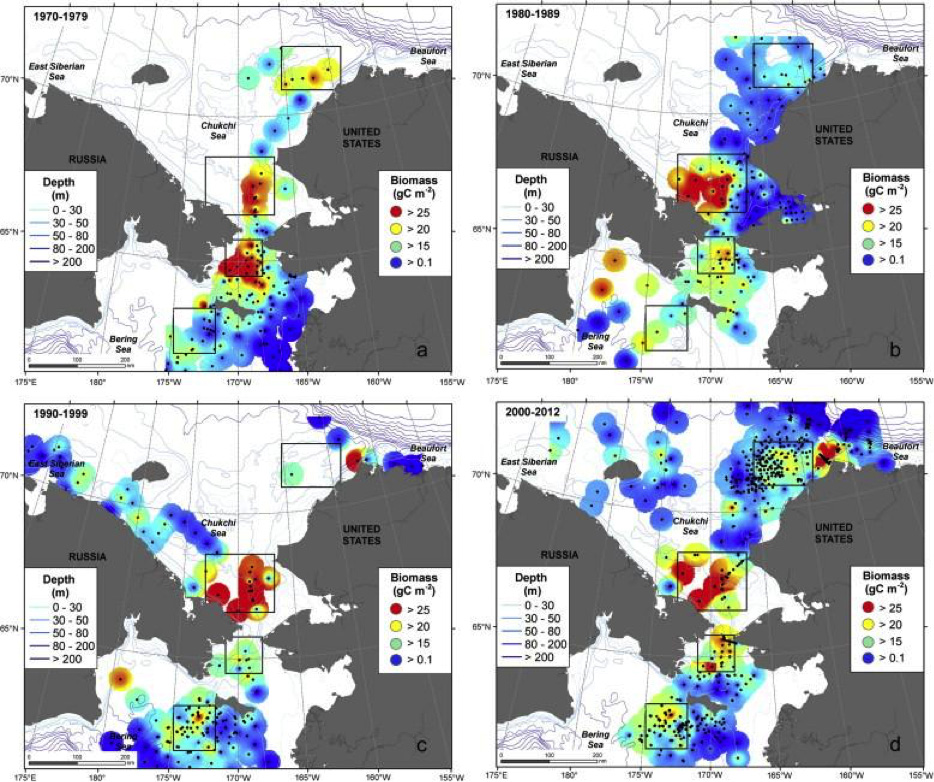
Benthic macro-infauna biomass in the northern Bering and Chukchi Seas from 1970 to 2012, displayed as decadal pattern Adapted from Grebmeier et al. (2015a) with permission from Elsevier. STATE OF THE ARCTIC MARINE BIODIVERSITY REPORT - <a href="https://arcticbiodiversity.is/findings/benthos" target="_blank">Chapter 3</a> - Page 98 - Figure 3.3.6 Cumulative scores of benthos drivers for each of the 8 CAFF-AMAs. The cumulative scores are taken from the last column of Table 3.3.1. The flower chart/plot helps to visualize the data.
-
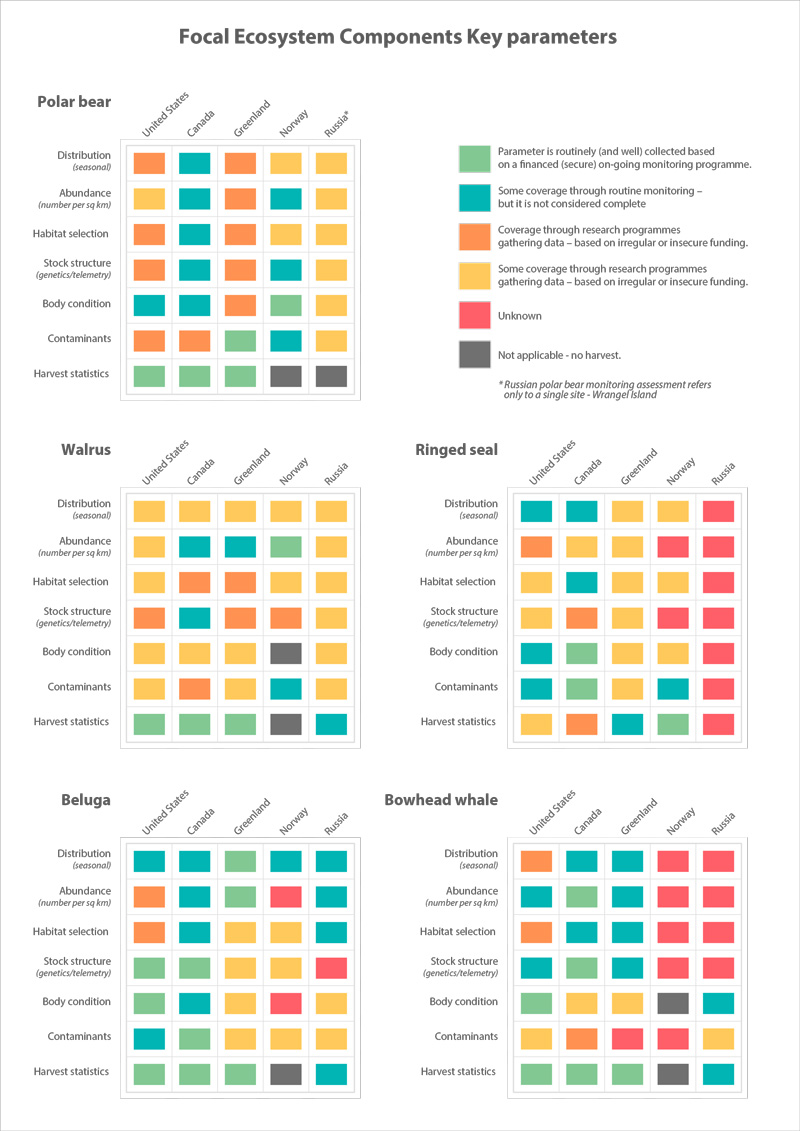
Assessment of monitoring implementation STATE OF THE ARCTIC MARINE BIODIVERSITY REPORT - <a href="https://arcticbiodiversity.is/findings/marine-mammals" target="_blank">Chapter 3</a> - Page 168 - Table 3.6.2
-
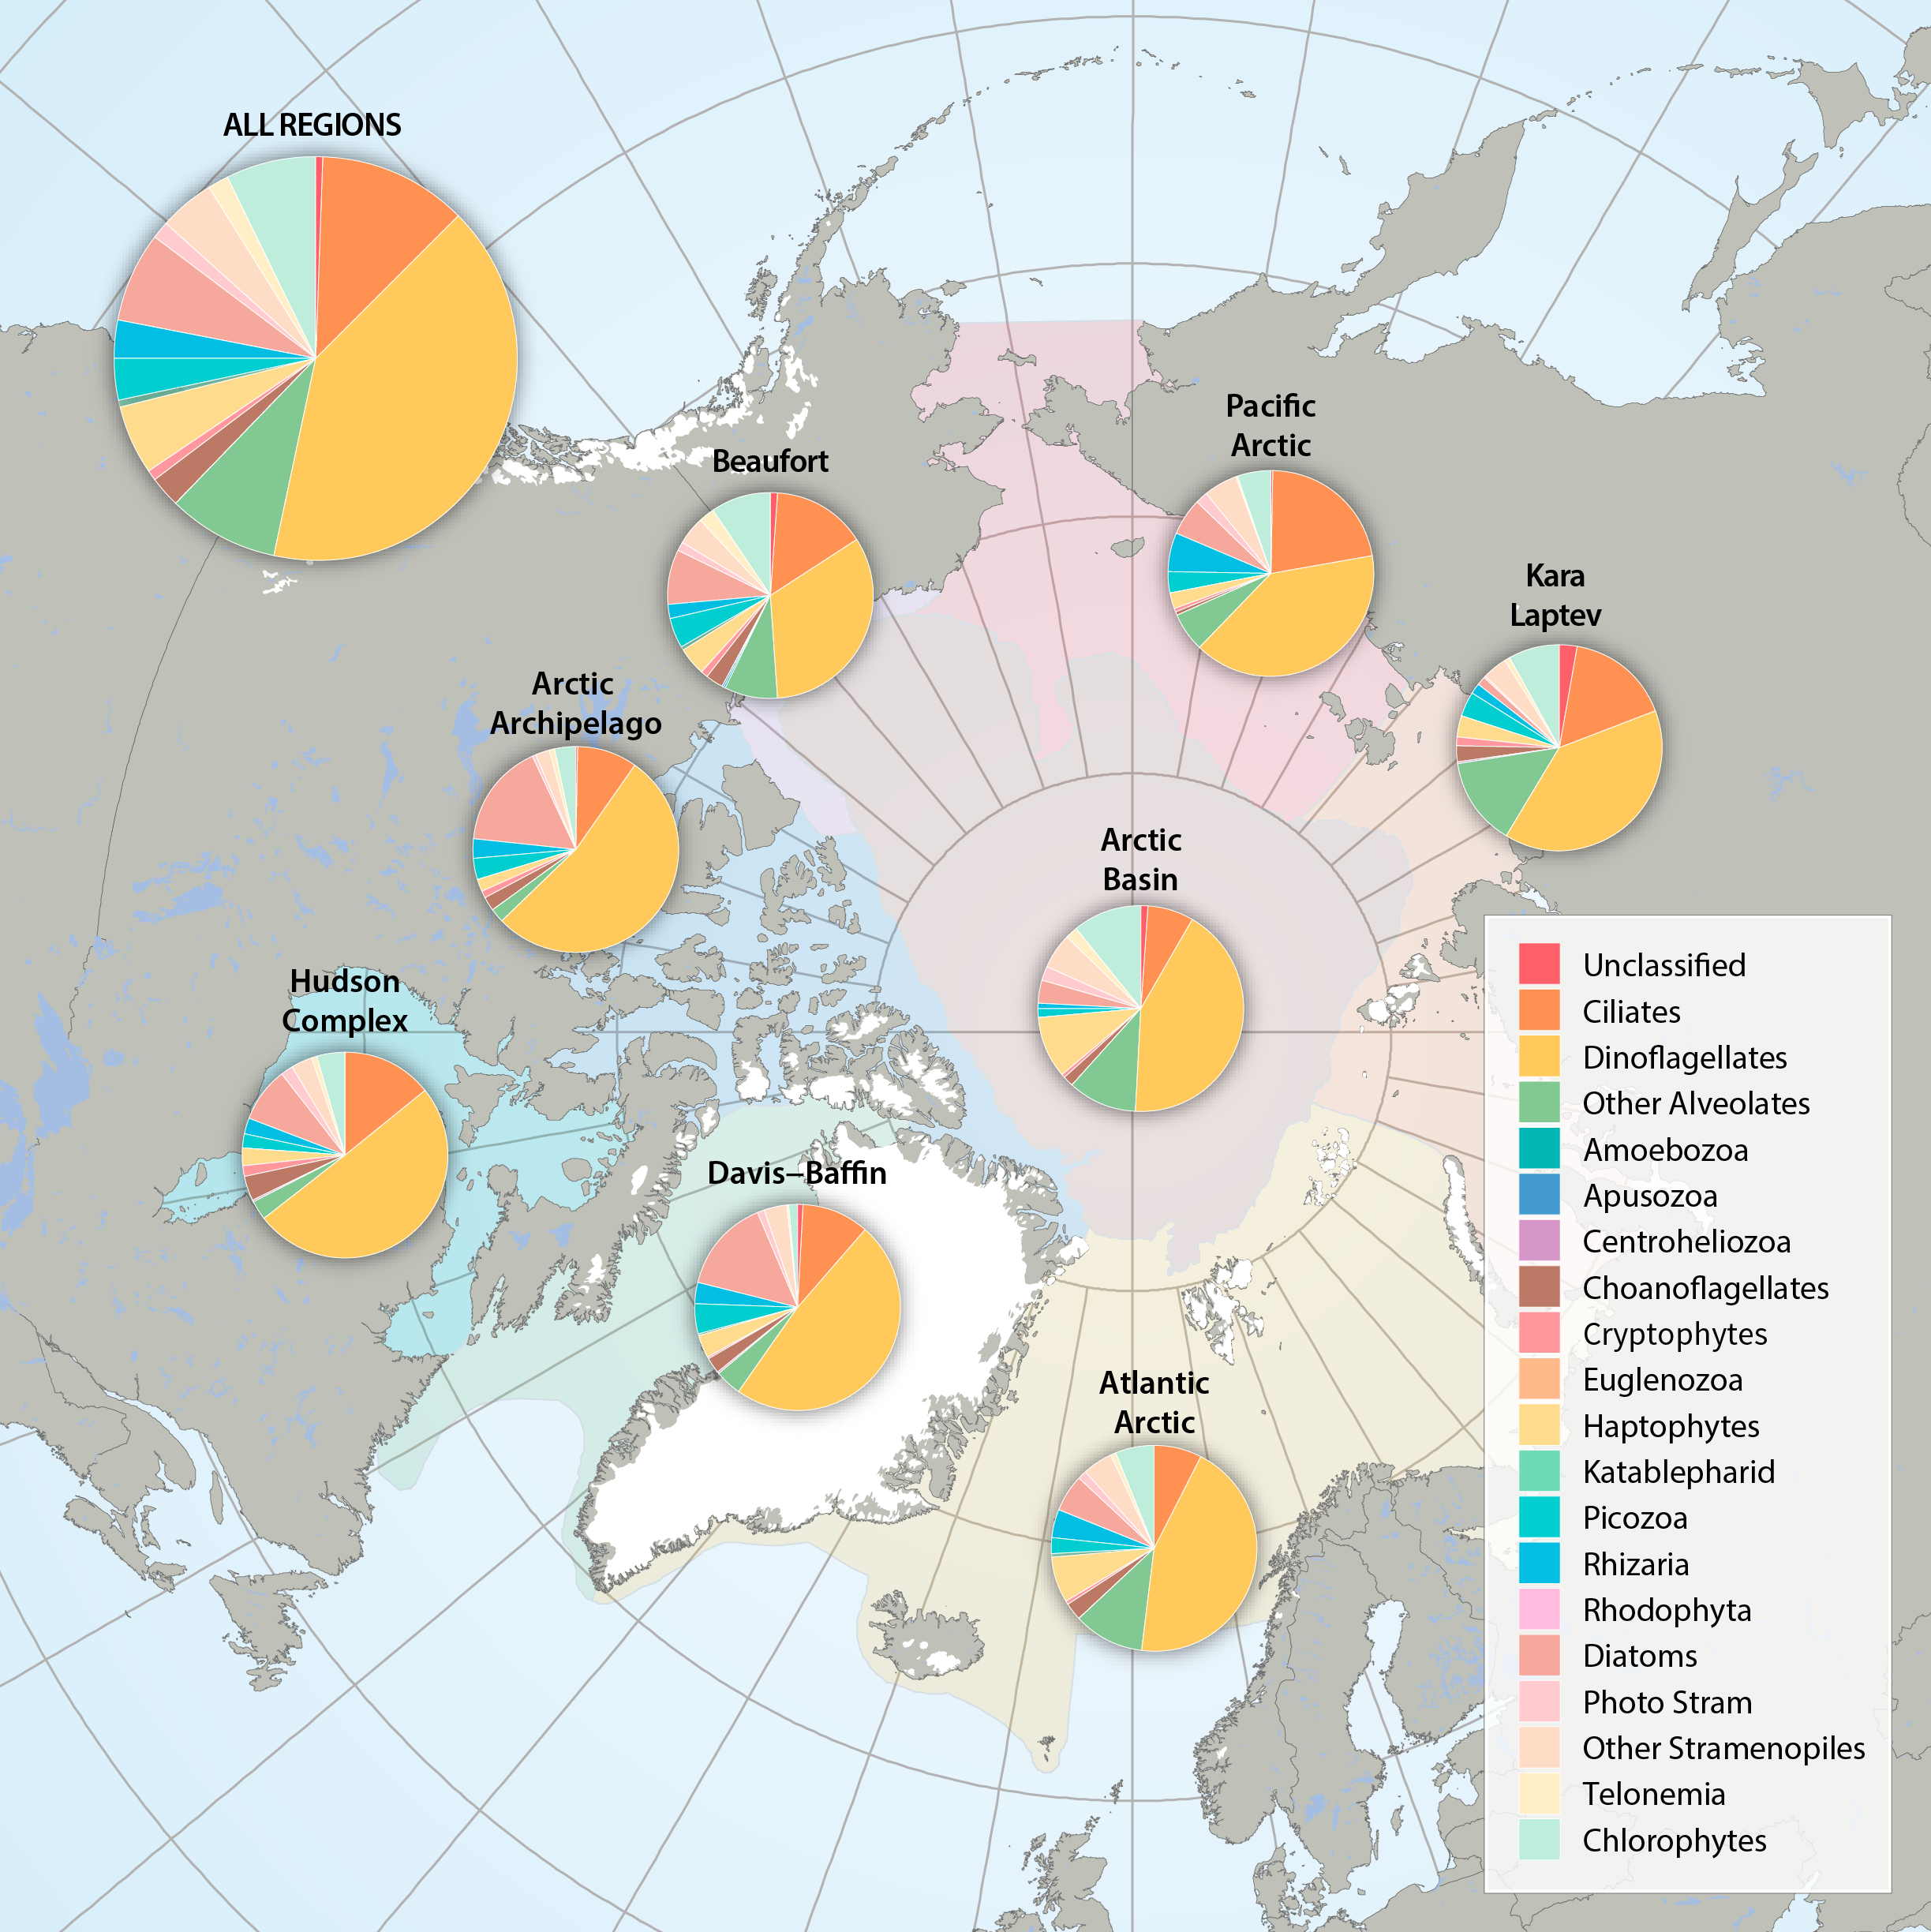
Figure 3.2.2a: Relative abundance of major eukaryote taxonomic groups found by high throughput sequencing of the small-subunit (18S) rRNA gene across Arctic Marine Areas. Figure 3.2.2b: Relative abundance of major eukaryote functional groups found by microscopy in the Arctic Marine Areas. STATE OF THE ARCTIC MARINE BIODIVERSITY REPORT - <a href="https://arcticbiodiversity.is/findings/plankton" target="_blank">Chapter 3</a> - Page 70 - Figures 3.2.2a and 3.2.2b