 CAFF - Arctic Biodiversity Data Service (ABDS)
40000
Type of resources
Available actions
Topics
Keywords
Contact for the resource
Provided by
Representation types
Update frequencies
status
Scale
-
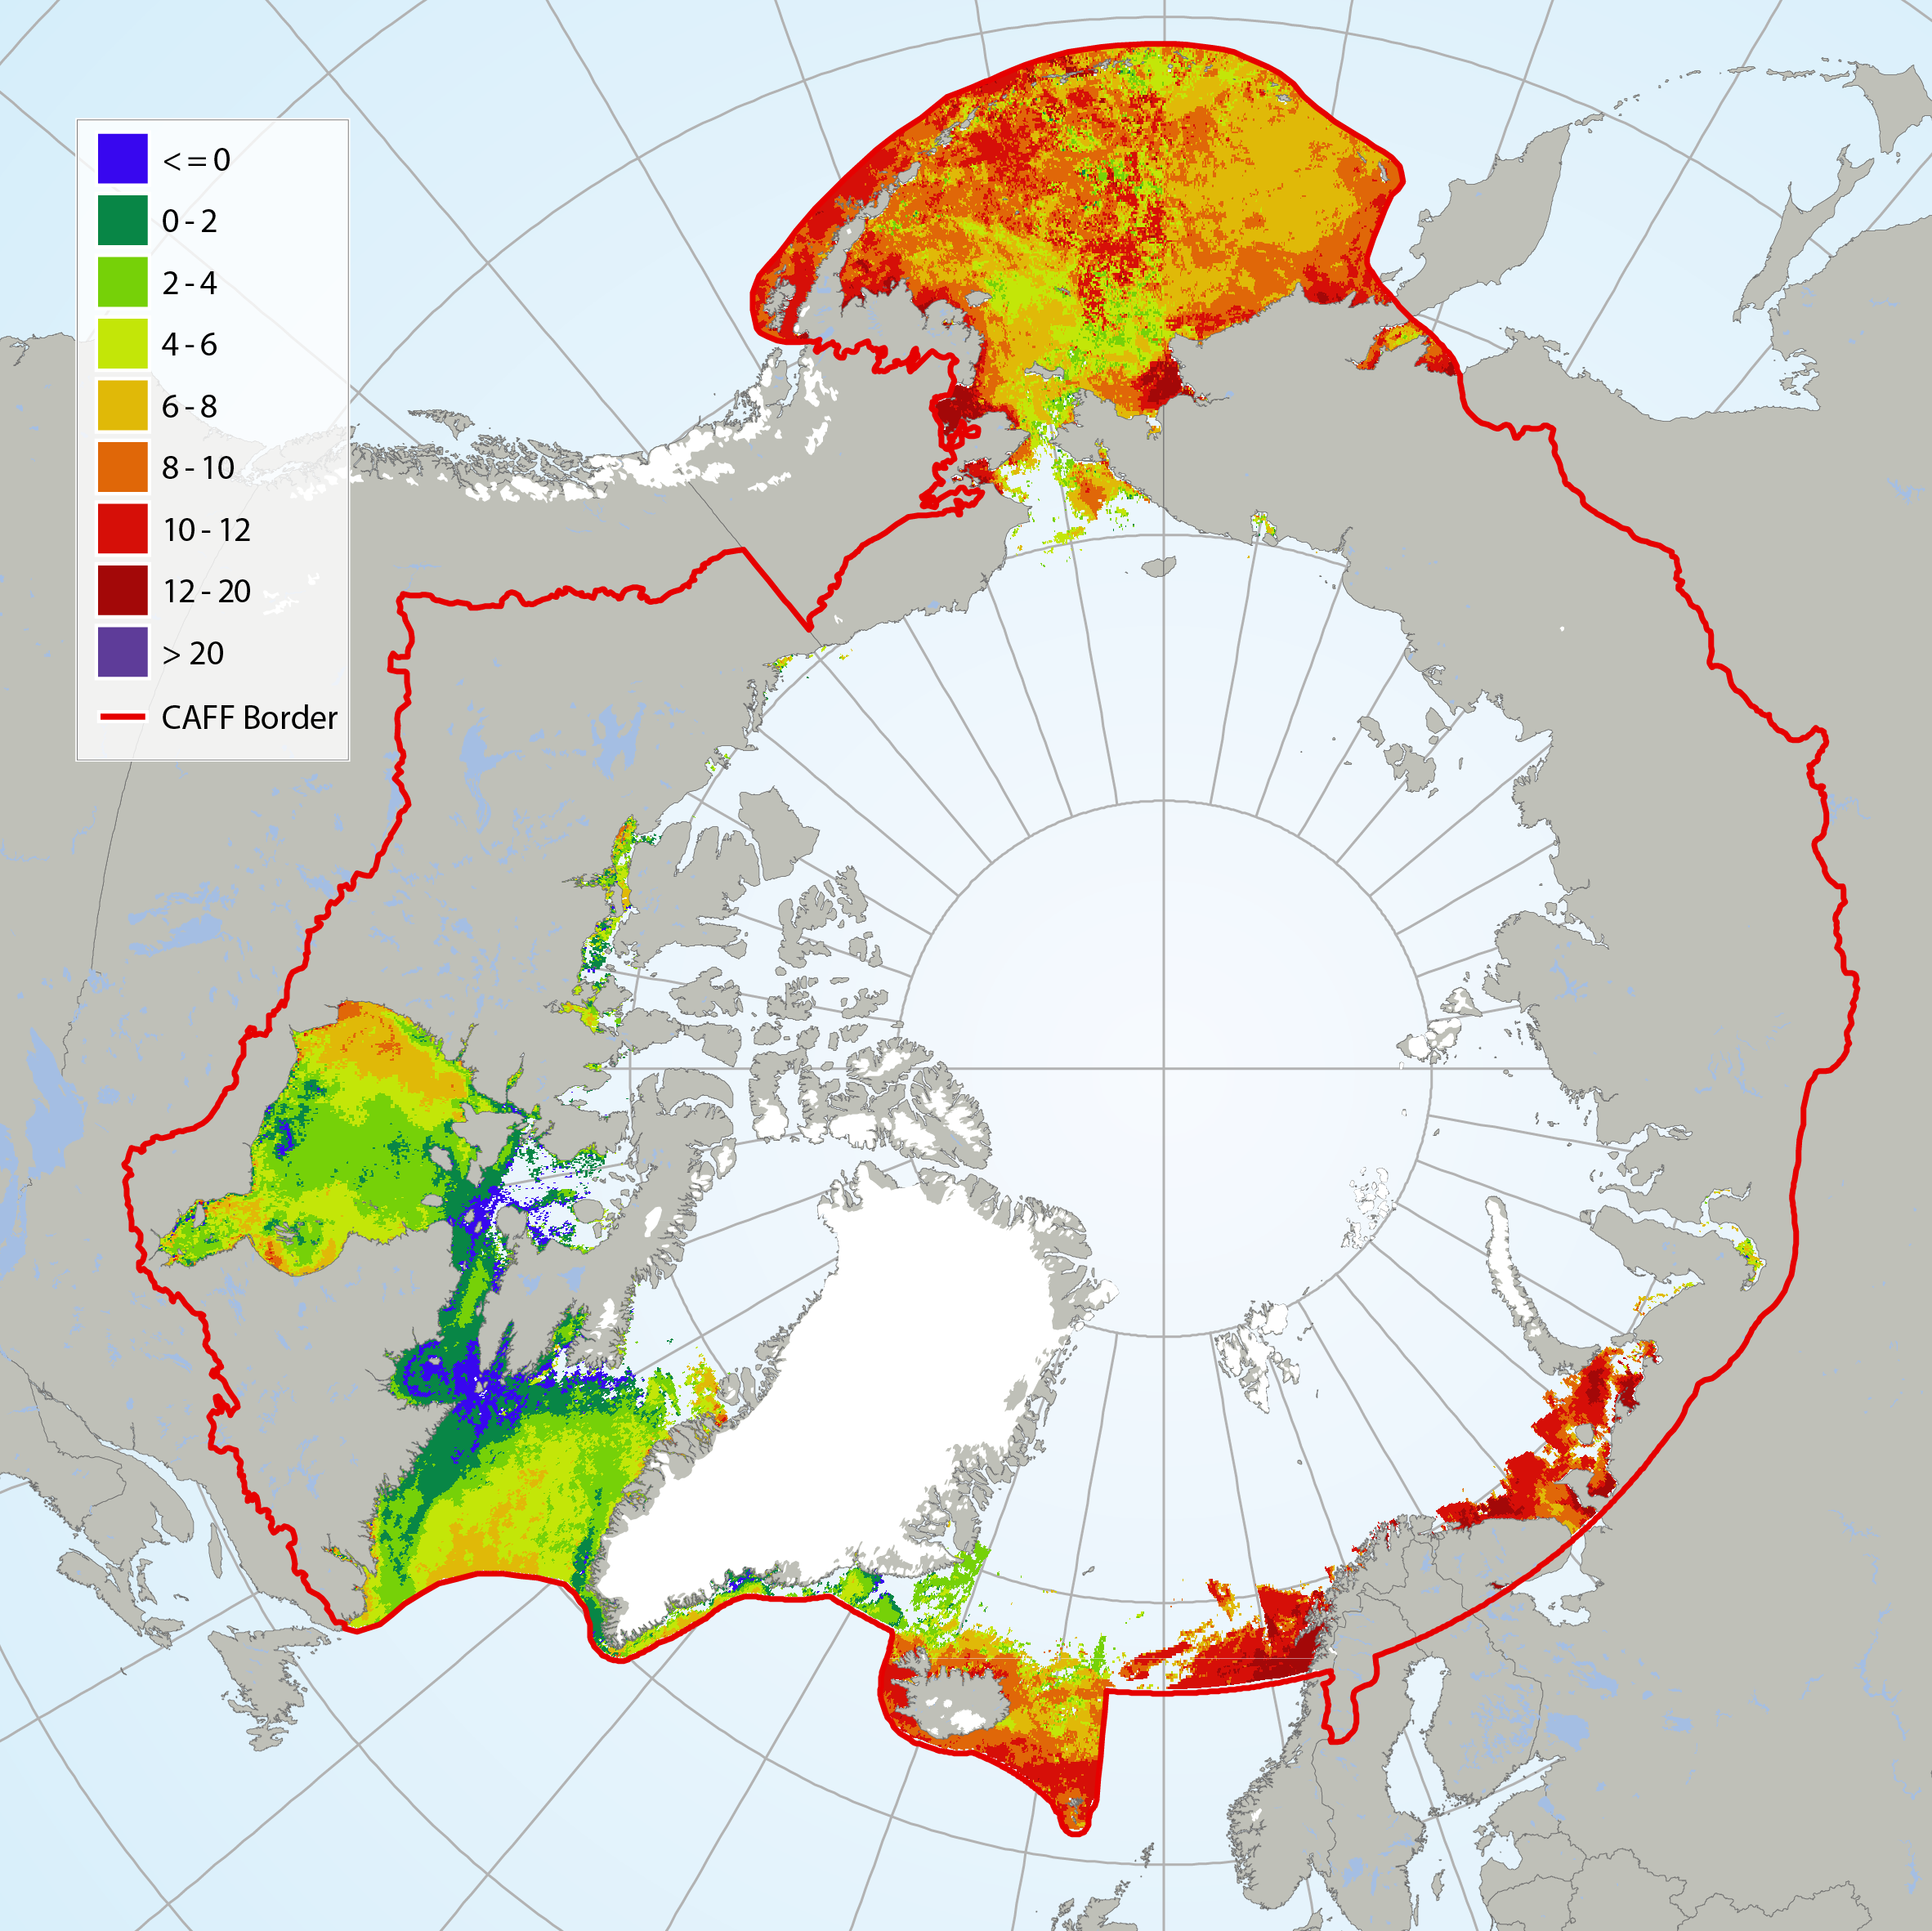
It has not been possible to identify available trend data for Arctic Ocean sea surface temperatures because there is not enough data to calculate reliable long-term trends for much of the Arctic marine environment (IPCC 2013, NOAA 2015). Here, sea surface temperature for July 2015 is shown from CAFF’s Land Cover Change Index. MODIS Sea Surface Temperature (SST) provided a four-kilometre spatial resolution monthly composite snapshot made from night-time measurements from the NASA Aqua Satellite. The night-time measurements are used to collect a consistent temperature measurement that is unaffected by the warming of the top layer of water by the sun. STATE OF THE ARCTIC MARINE BIODIVERSITY REPORT - <a href="https://arcticbiodiversity.is/marine" target="_blank">Chapter 2</a> - Page 25 - Figure 2.3
-
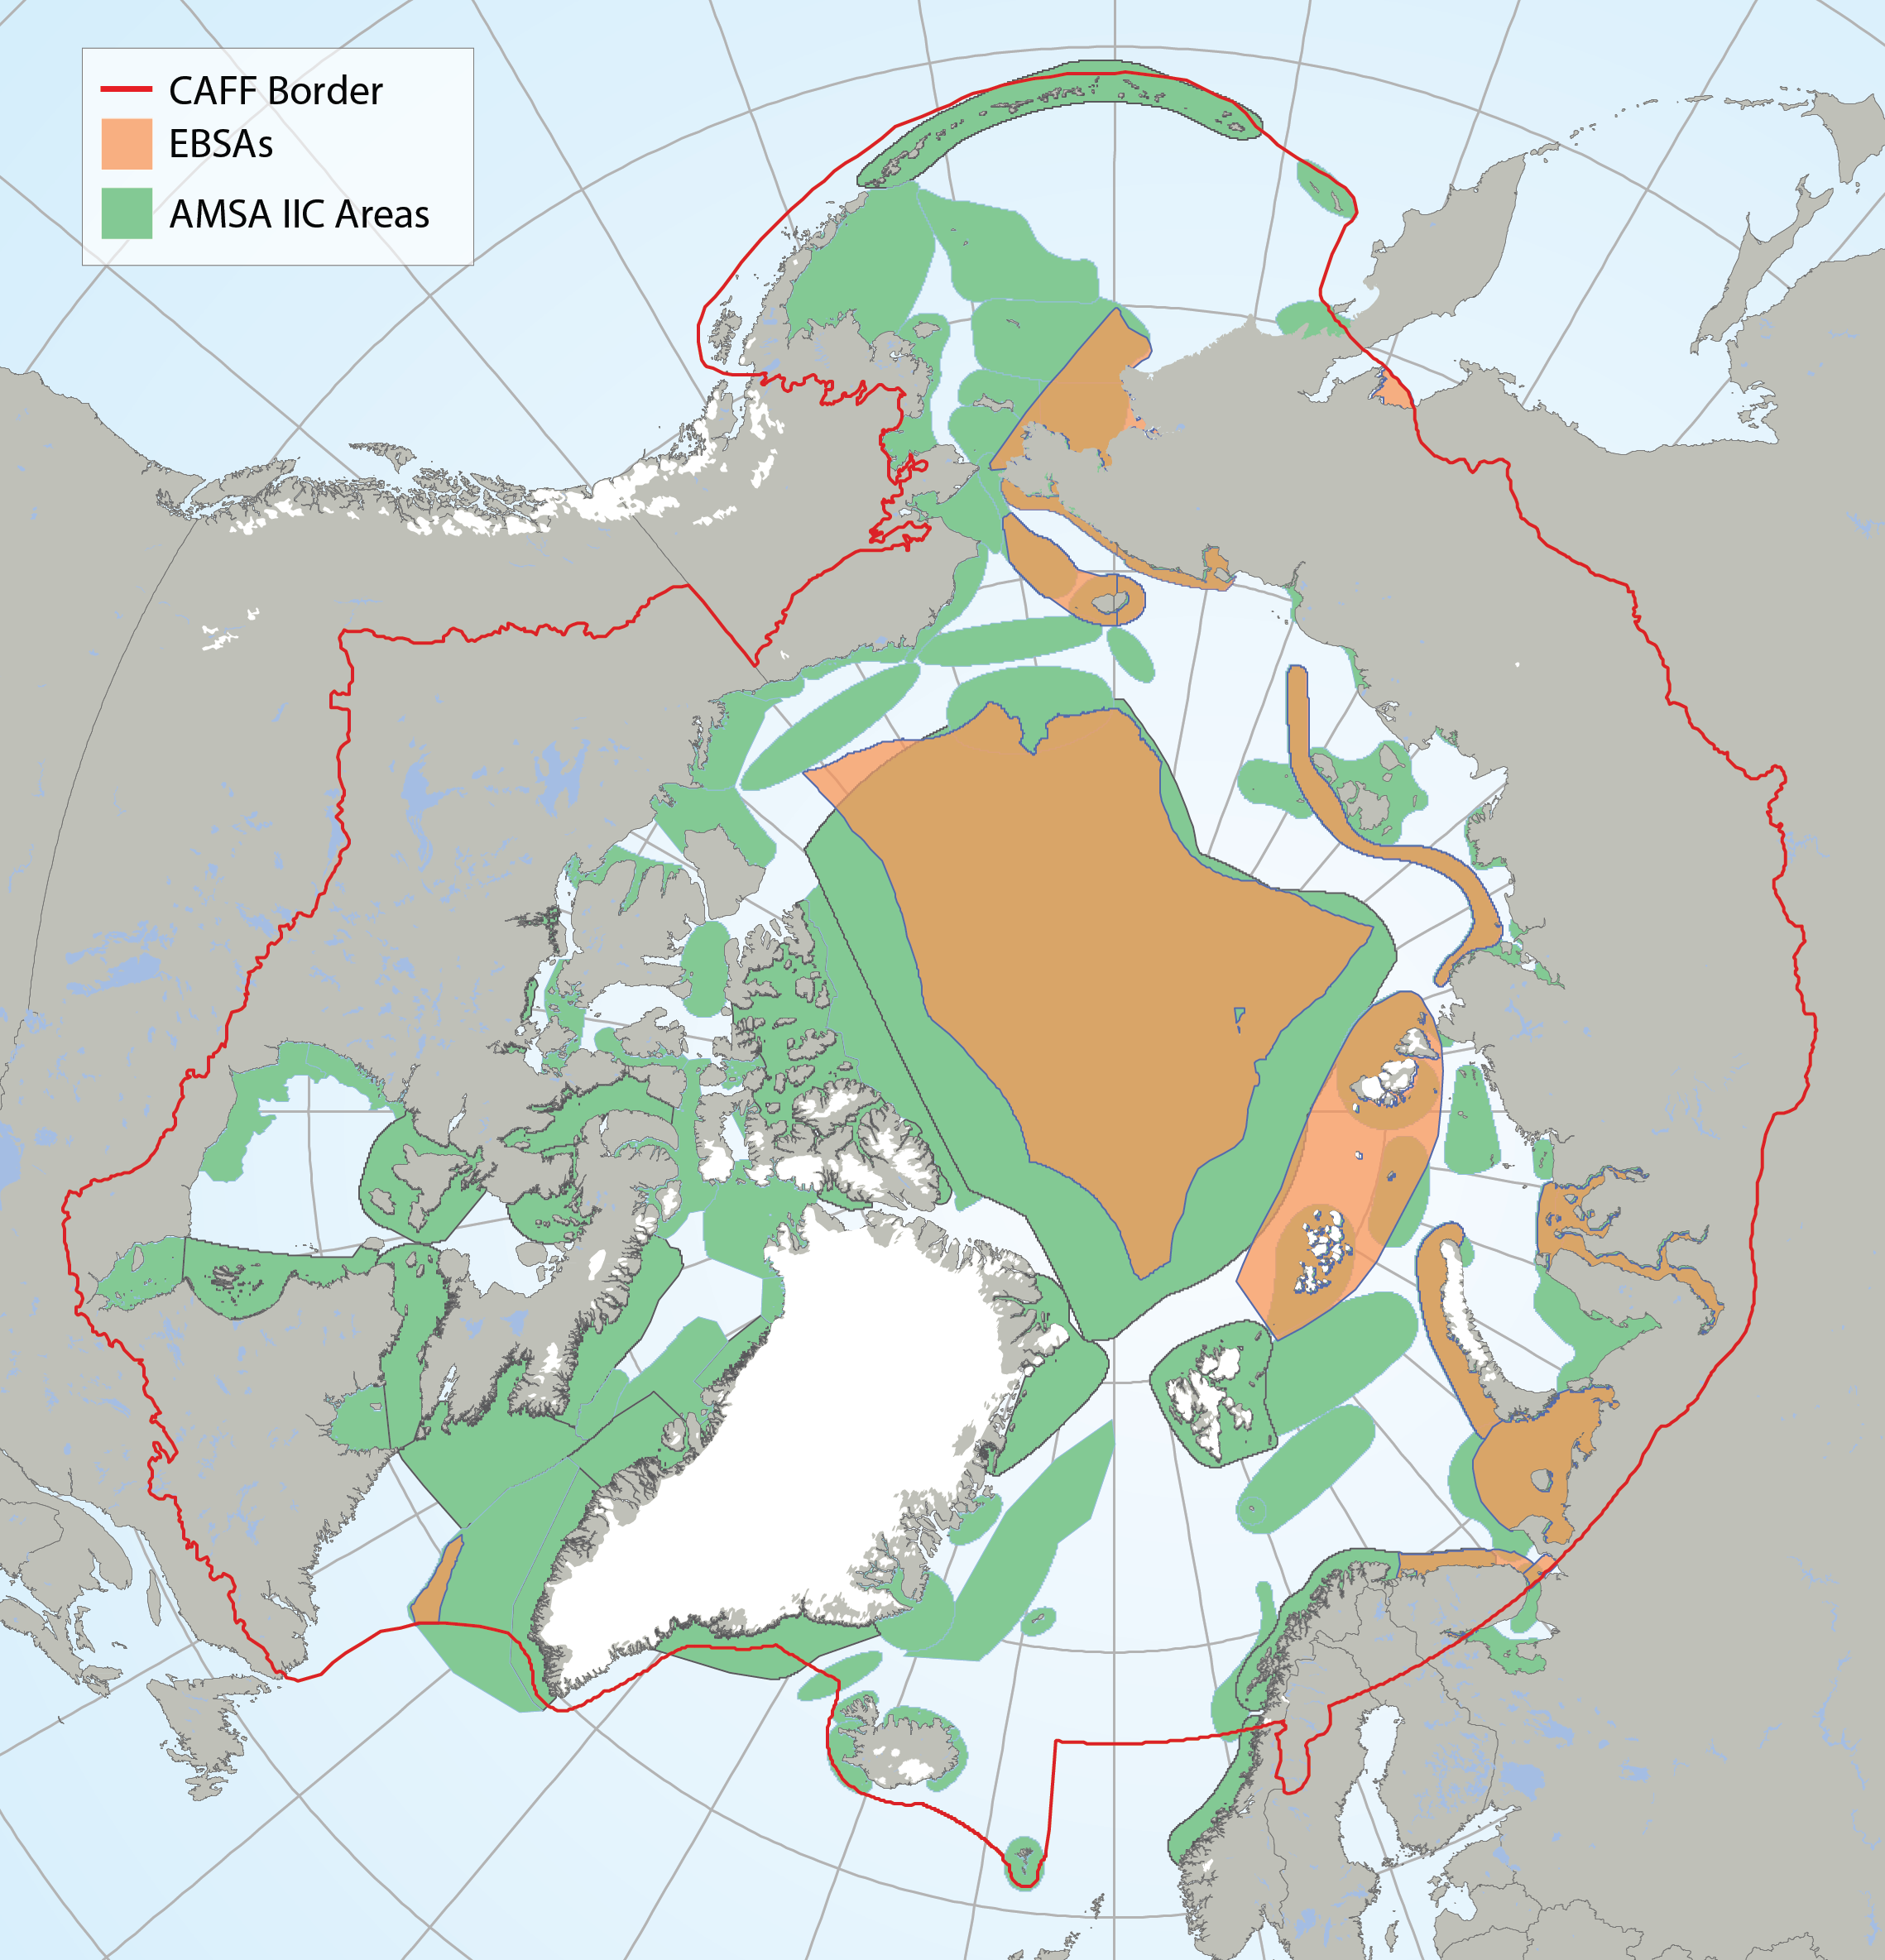
Arctic Ecologically and Biologically Significant Areas (EBSAs) and Arctic Marine Areas of Heightened Ecological and Cultural Significance as identified in the Arctic Marine Shipping Assessment (AMSA) IIC report. STATE OF THE ARCTIC MARINE BIODIVERSITY REPORT - <a href="https://arcticbiodiversity.is/marine" target="_blank">Chapter 1</a> - Page 16 - Box Figure 1.1
-
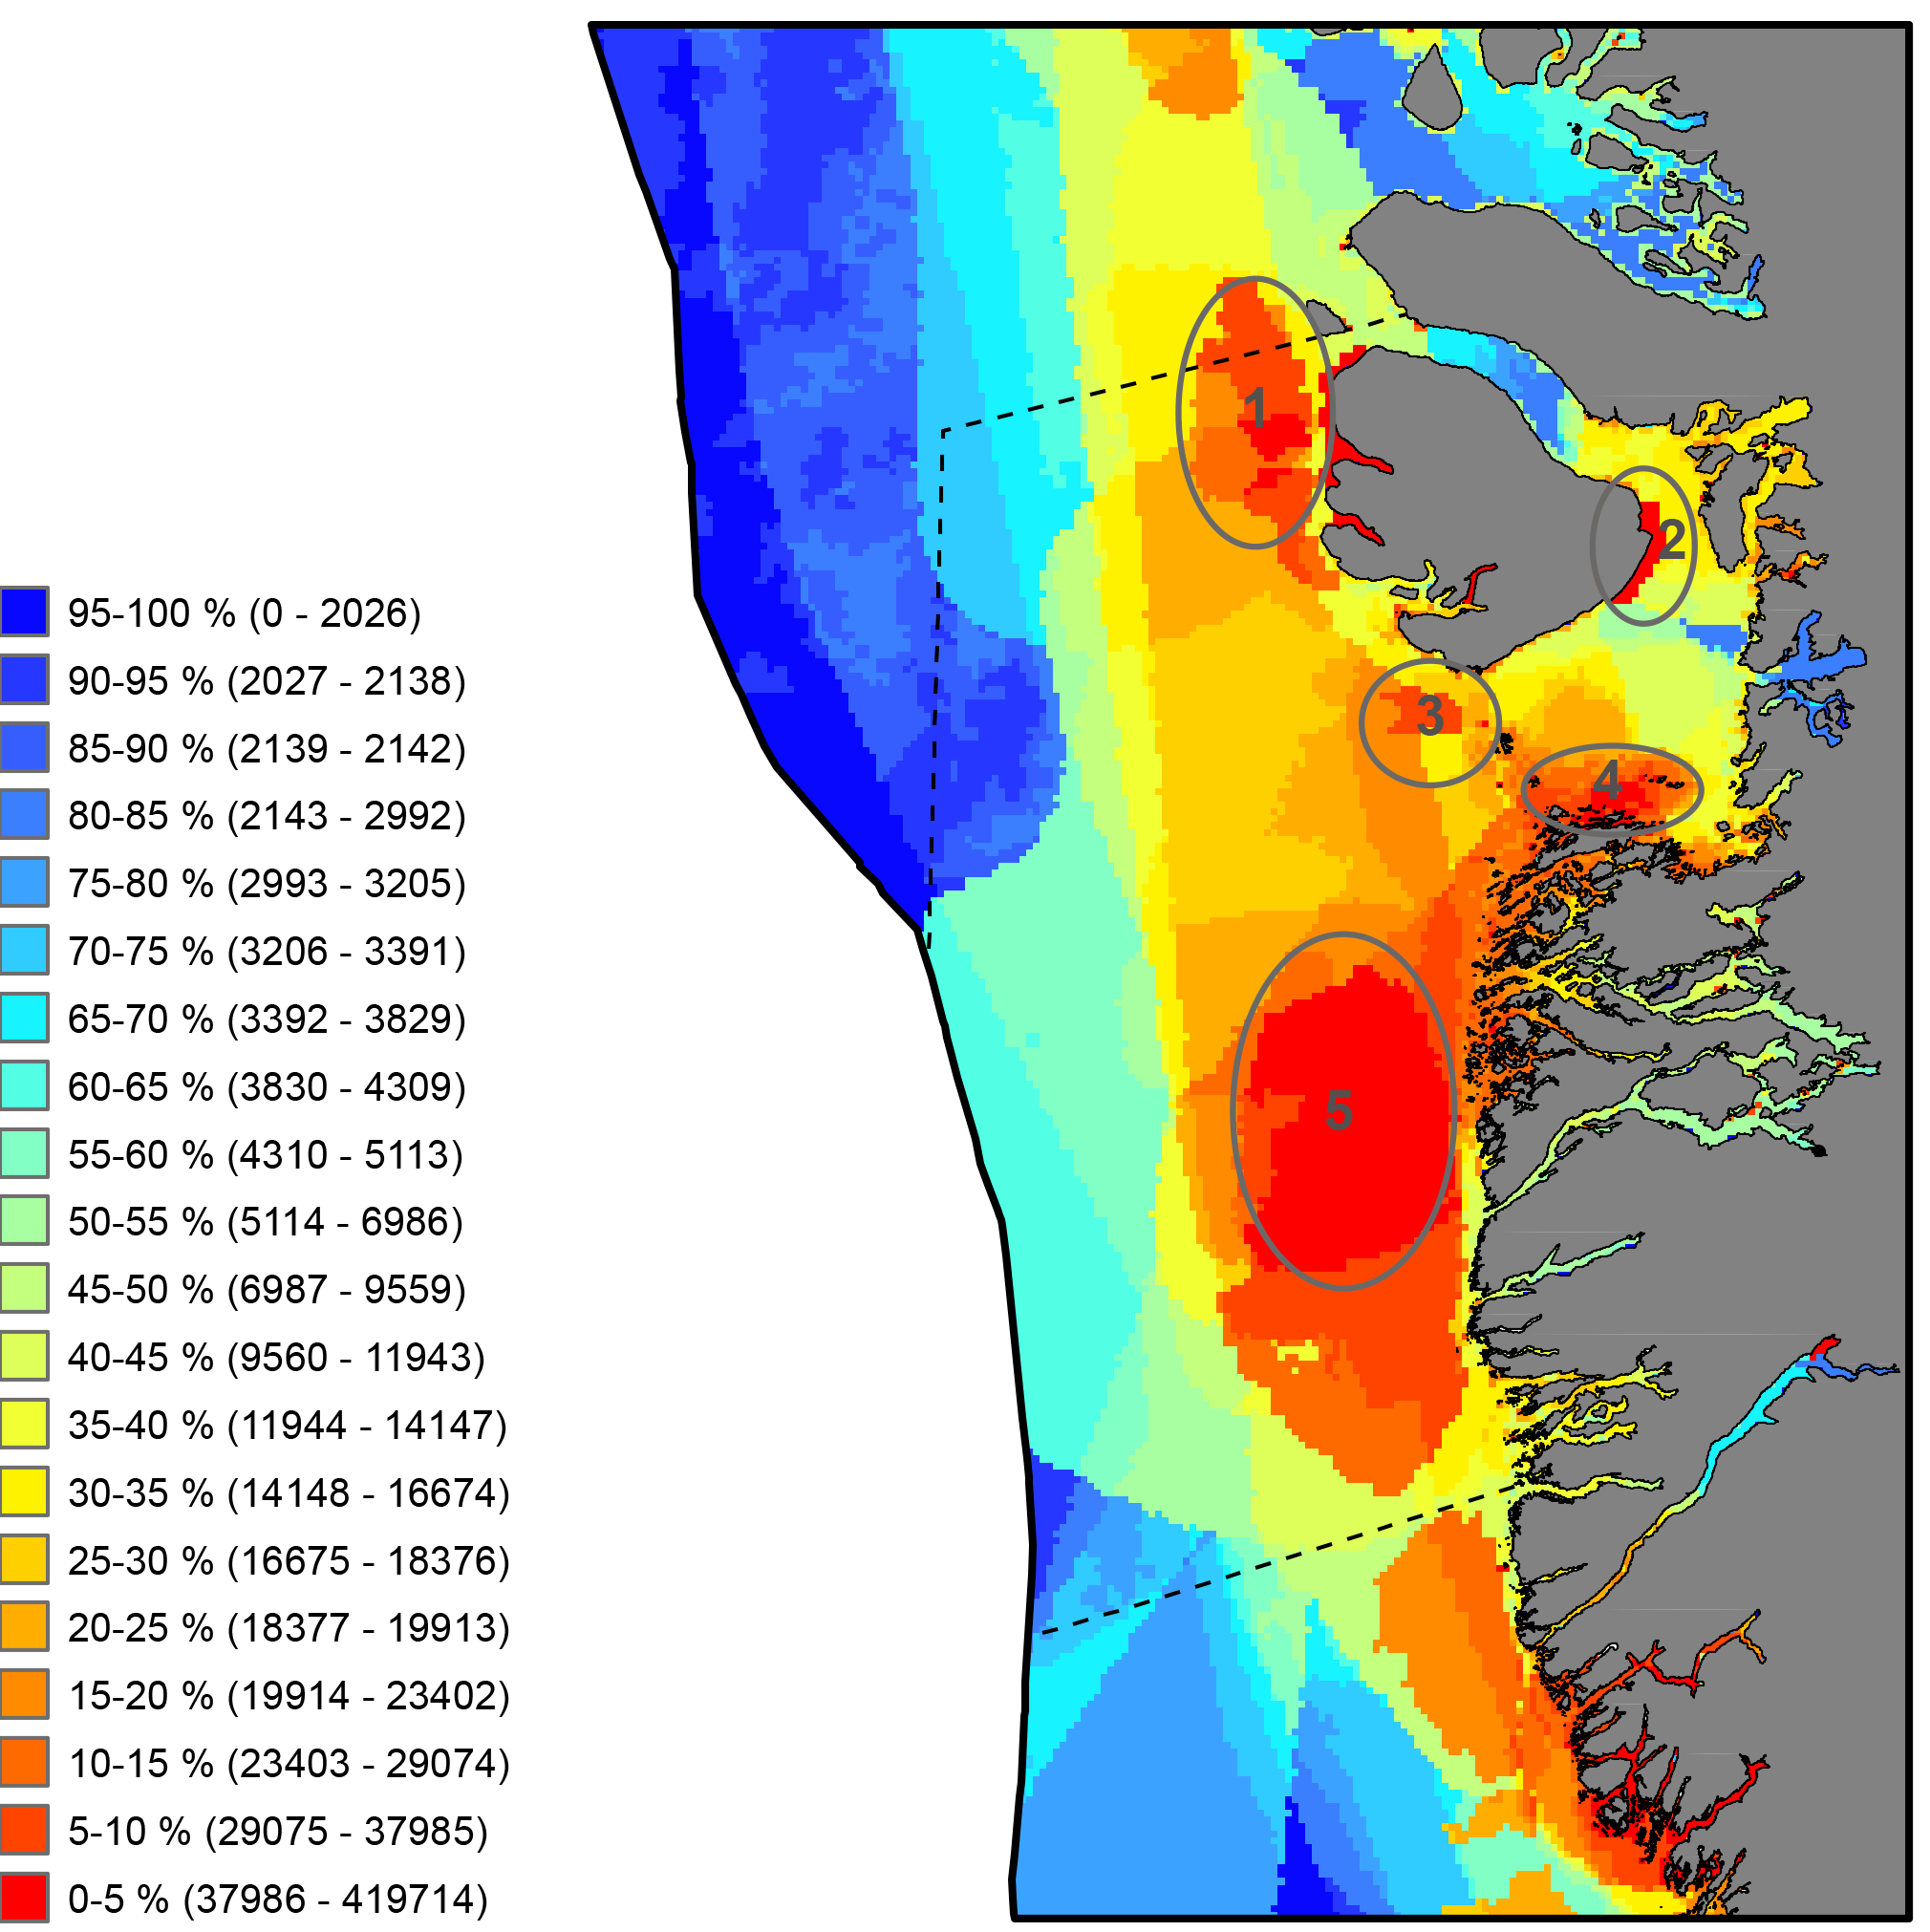
Critical to the successful implementation of EBM in the Arctic is the existence of a cohesive circumpolar approach to the collection and management of data and the application of compatible frameworks, standards and protocols that this entails. STATE OF THE ARCTIC MARINE BIODIVERSITY REPORT - <a href="https://arcticbiodiversity.is/marine" target="_blank">Chapter 2</a> - Page 29 - Box Figure 2.2
-
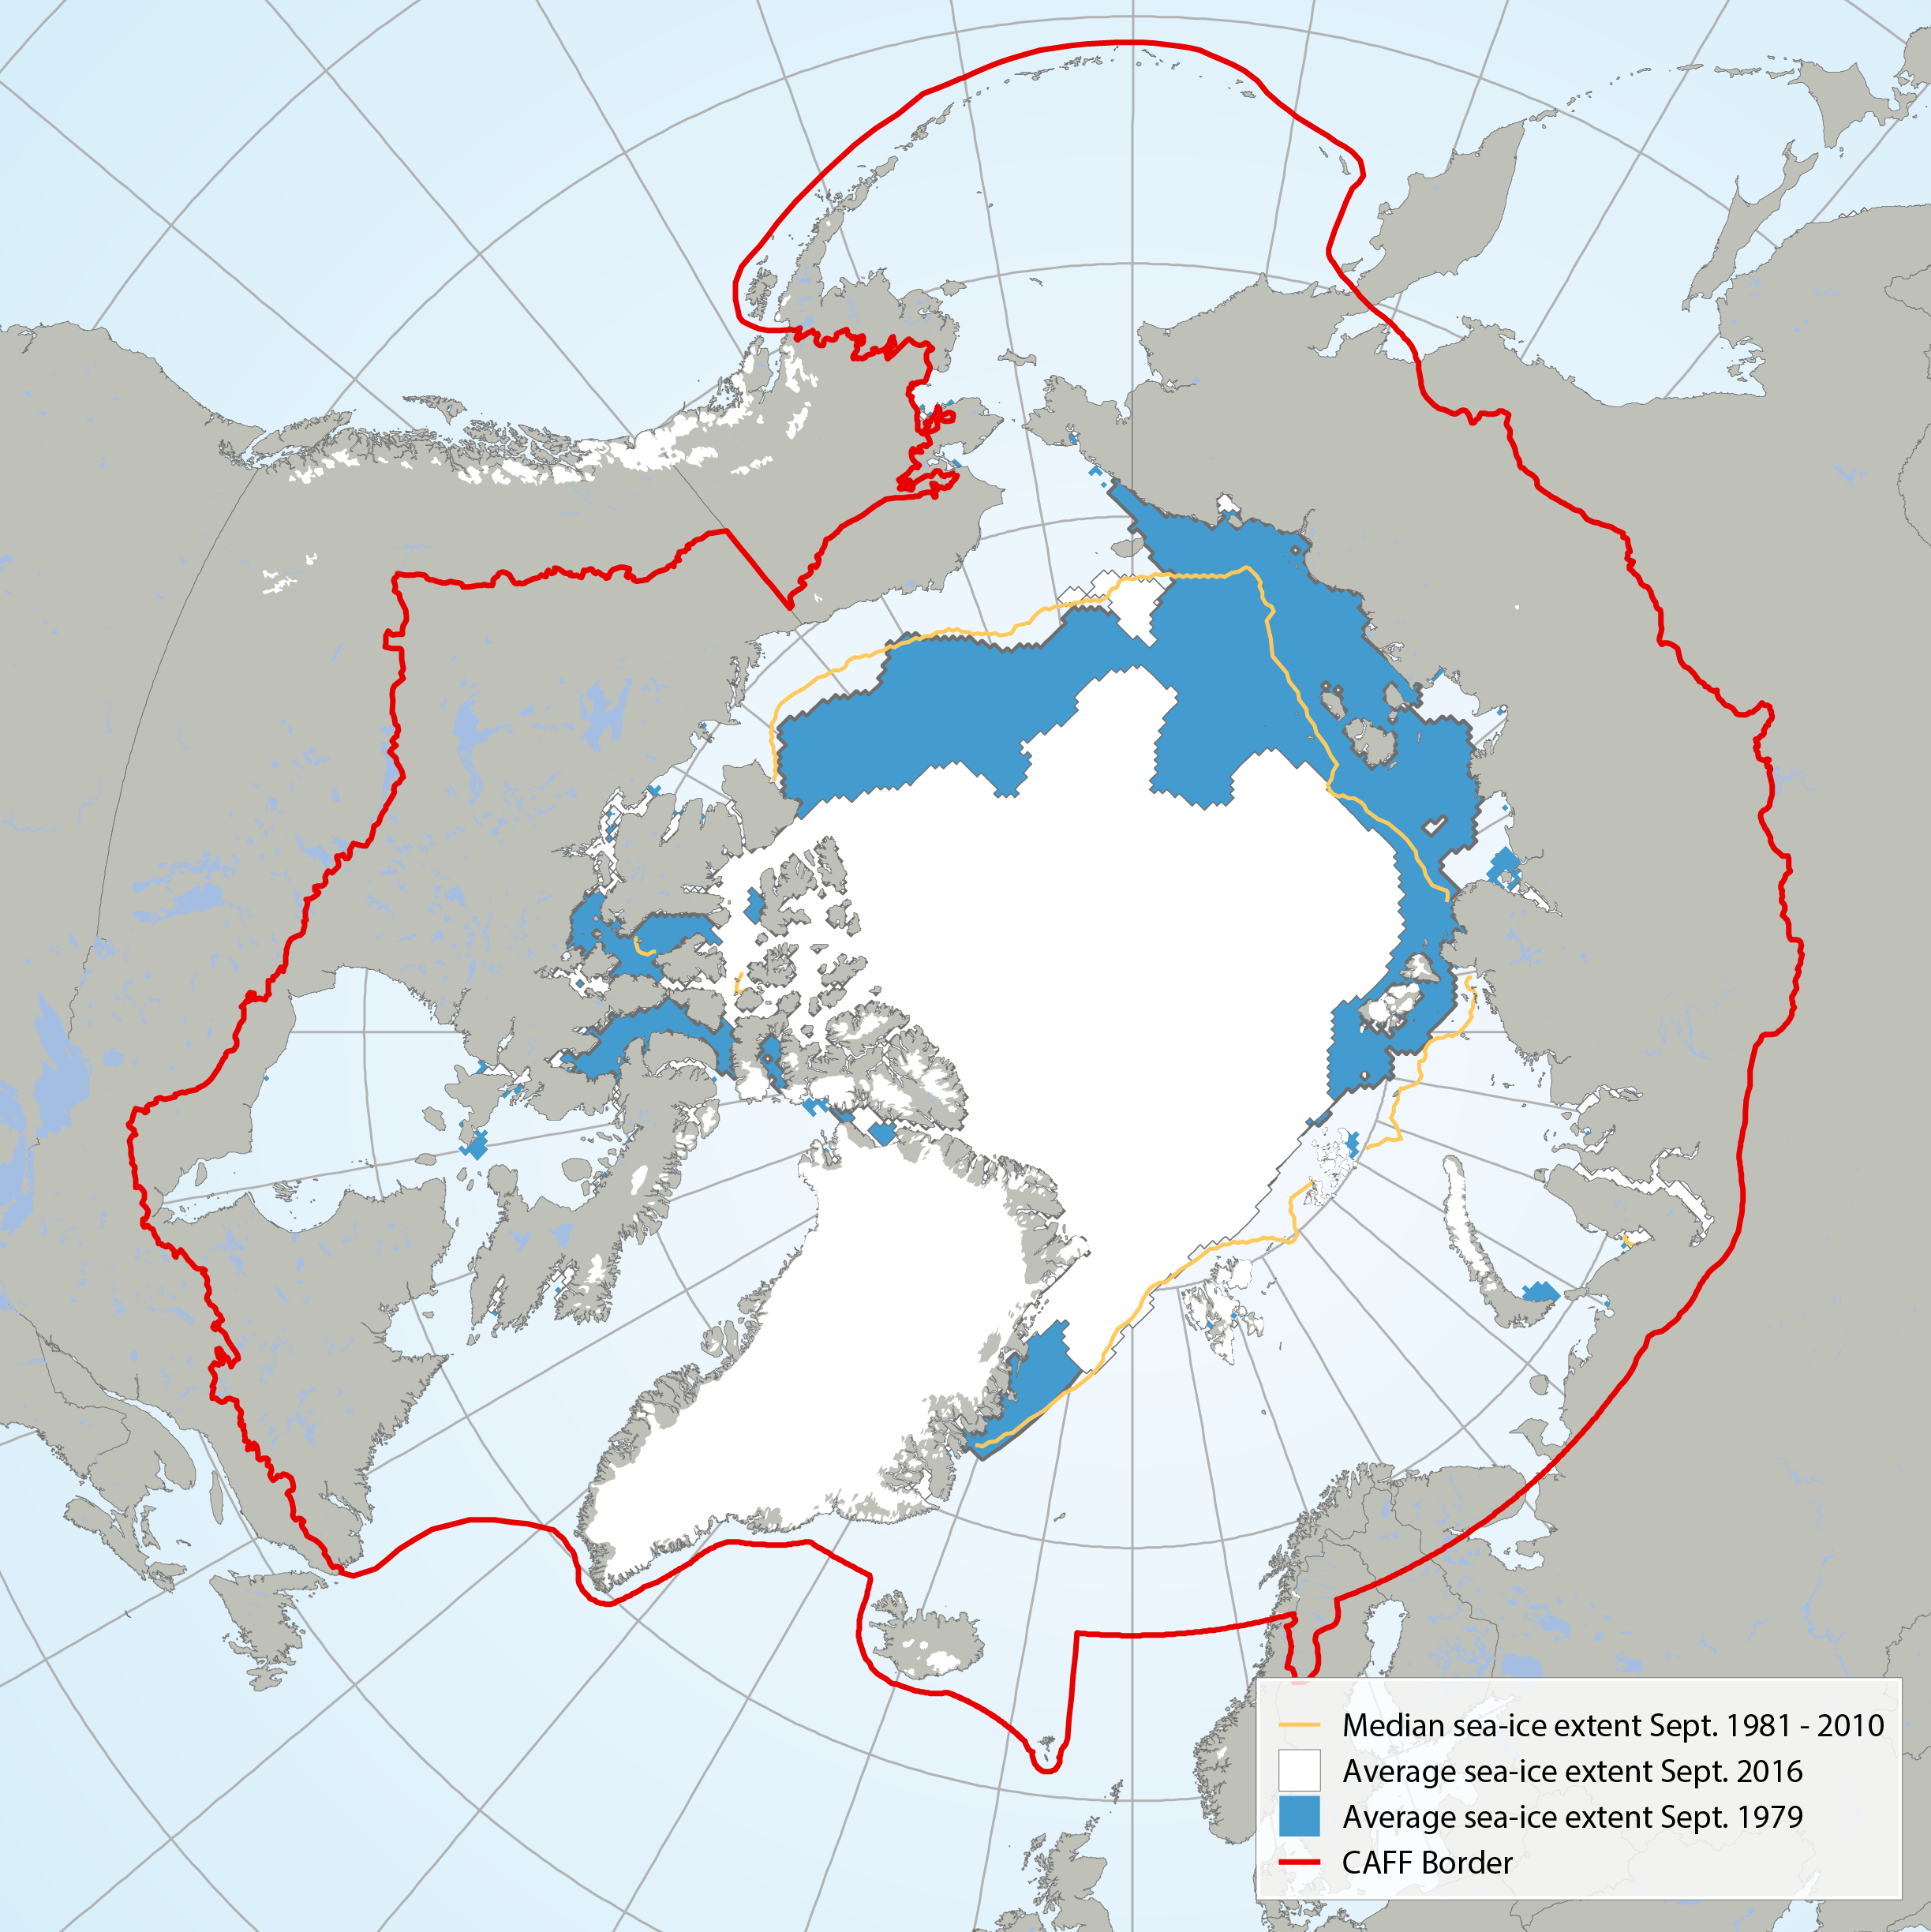
Average September sea ice extent in 1979 (blue) compared with 2016 (white) and the median sea ice extent (yellow line) from 1981 to 2010 (Data: NSDIC 2016). STATE OF THE ARCTIC MARINE BIODIVERSITY REPORT - <a href="https://arcticbiodiversity.is/marine" target="_blank">Chapter 2</a> - Page 27 - Figure 2.4
-
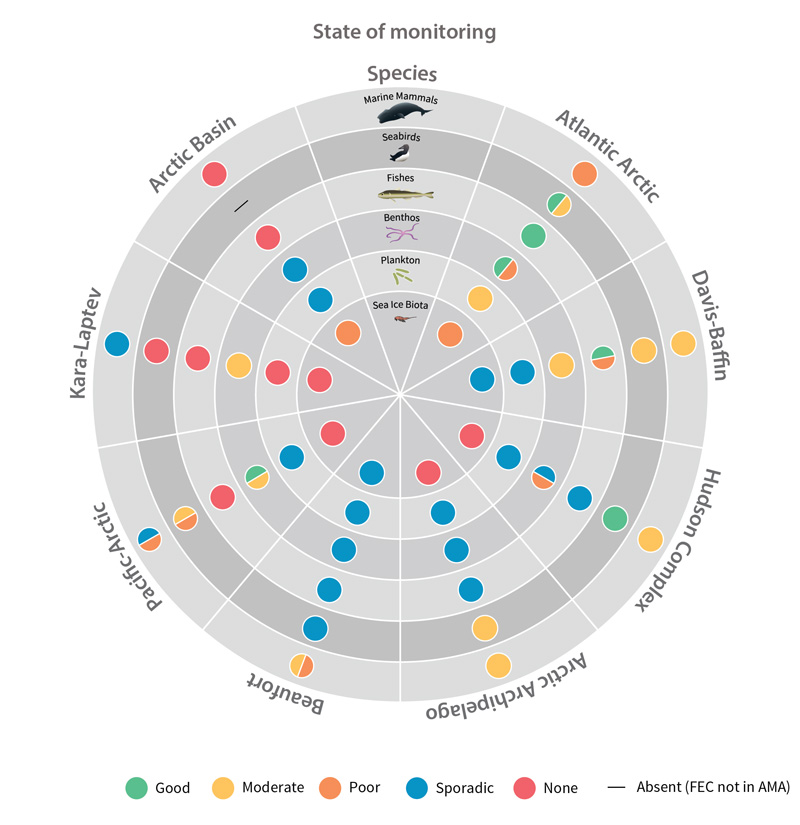
Status of monitoring activities for each Focal Ecosystem Component (i.e., selected species groups) across each Arctic Marine Area as included in this report. STATE OF THE ARCTIC MARINE BIODIVERSITY REPORT - <a href="https://arcticbiodiversity.is/monitoring-status-and-advice" target="_blank">Key Findings</a> - Page 5 - Figure 1
-
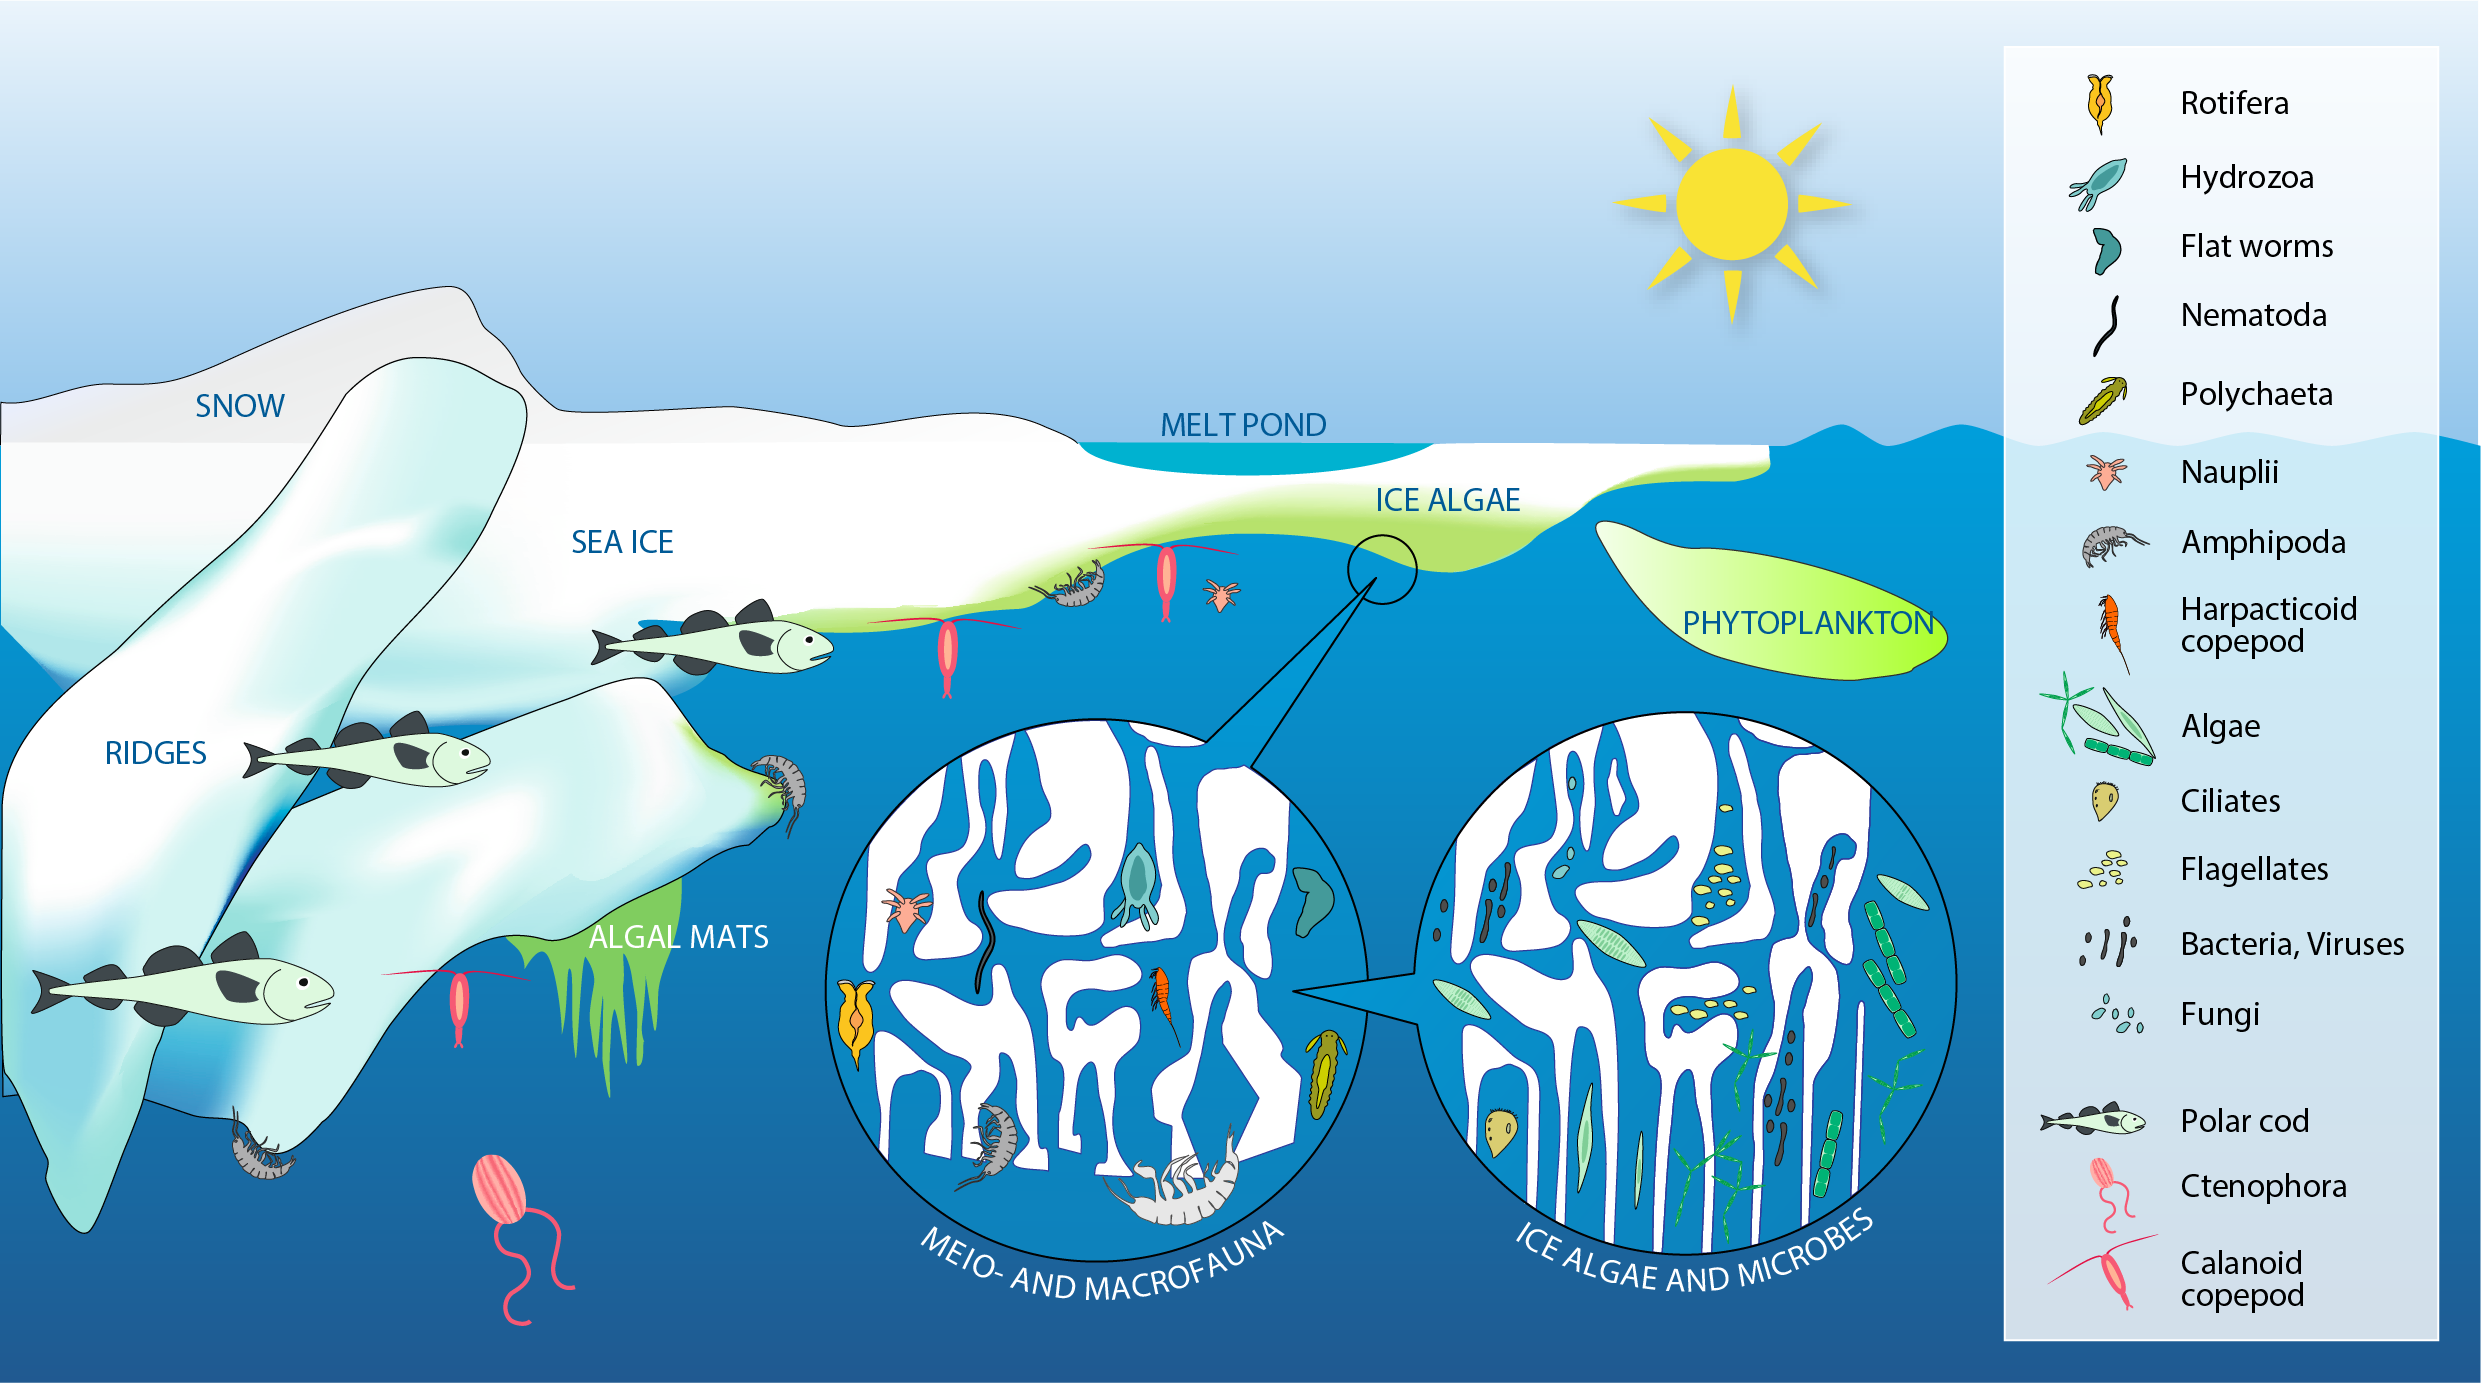
Sea ice provides a wide range of microhabitats for diverse biota including microbes, single-celled eukaryotes (labelled algae), multicellular meiofauna, larger under-ice fauna (represented by amphipods), as well as polar cod (Boreogadus saida). Modified from Bluhm et al. (2017). STATE OF THE ARCTIC MARINE BIODIVERSITY REPORT - <a href="https://arcticbiodiversity.is/findings/sea-ice-biota" target="_blank">Chapter 3</a> - Page 35 - Figure 3.1.1
-
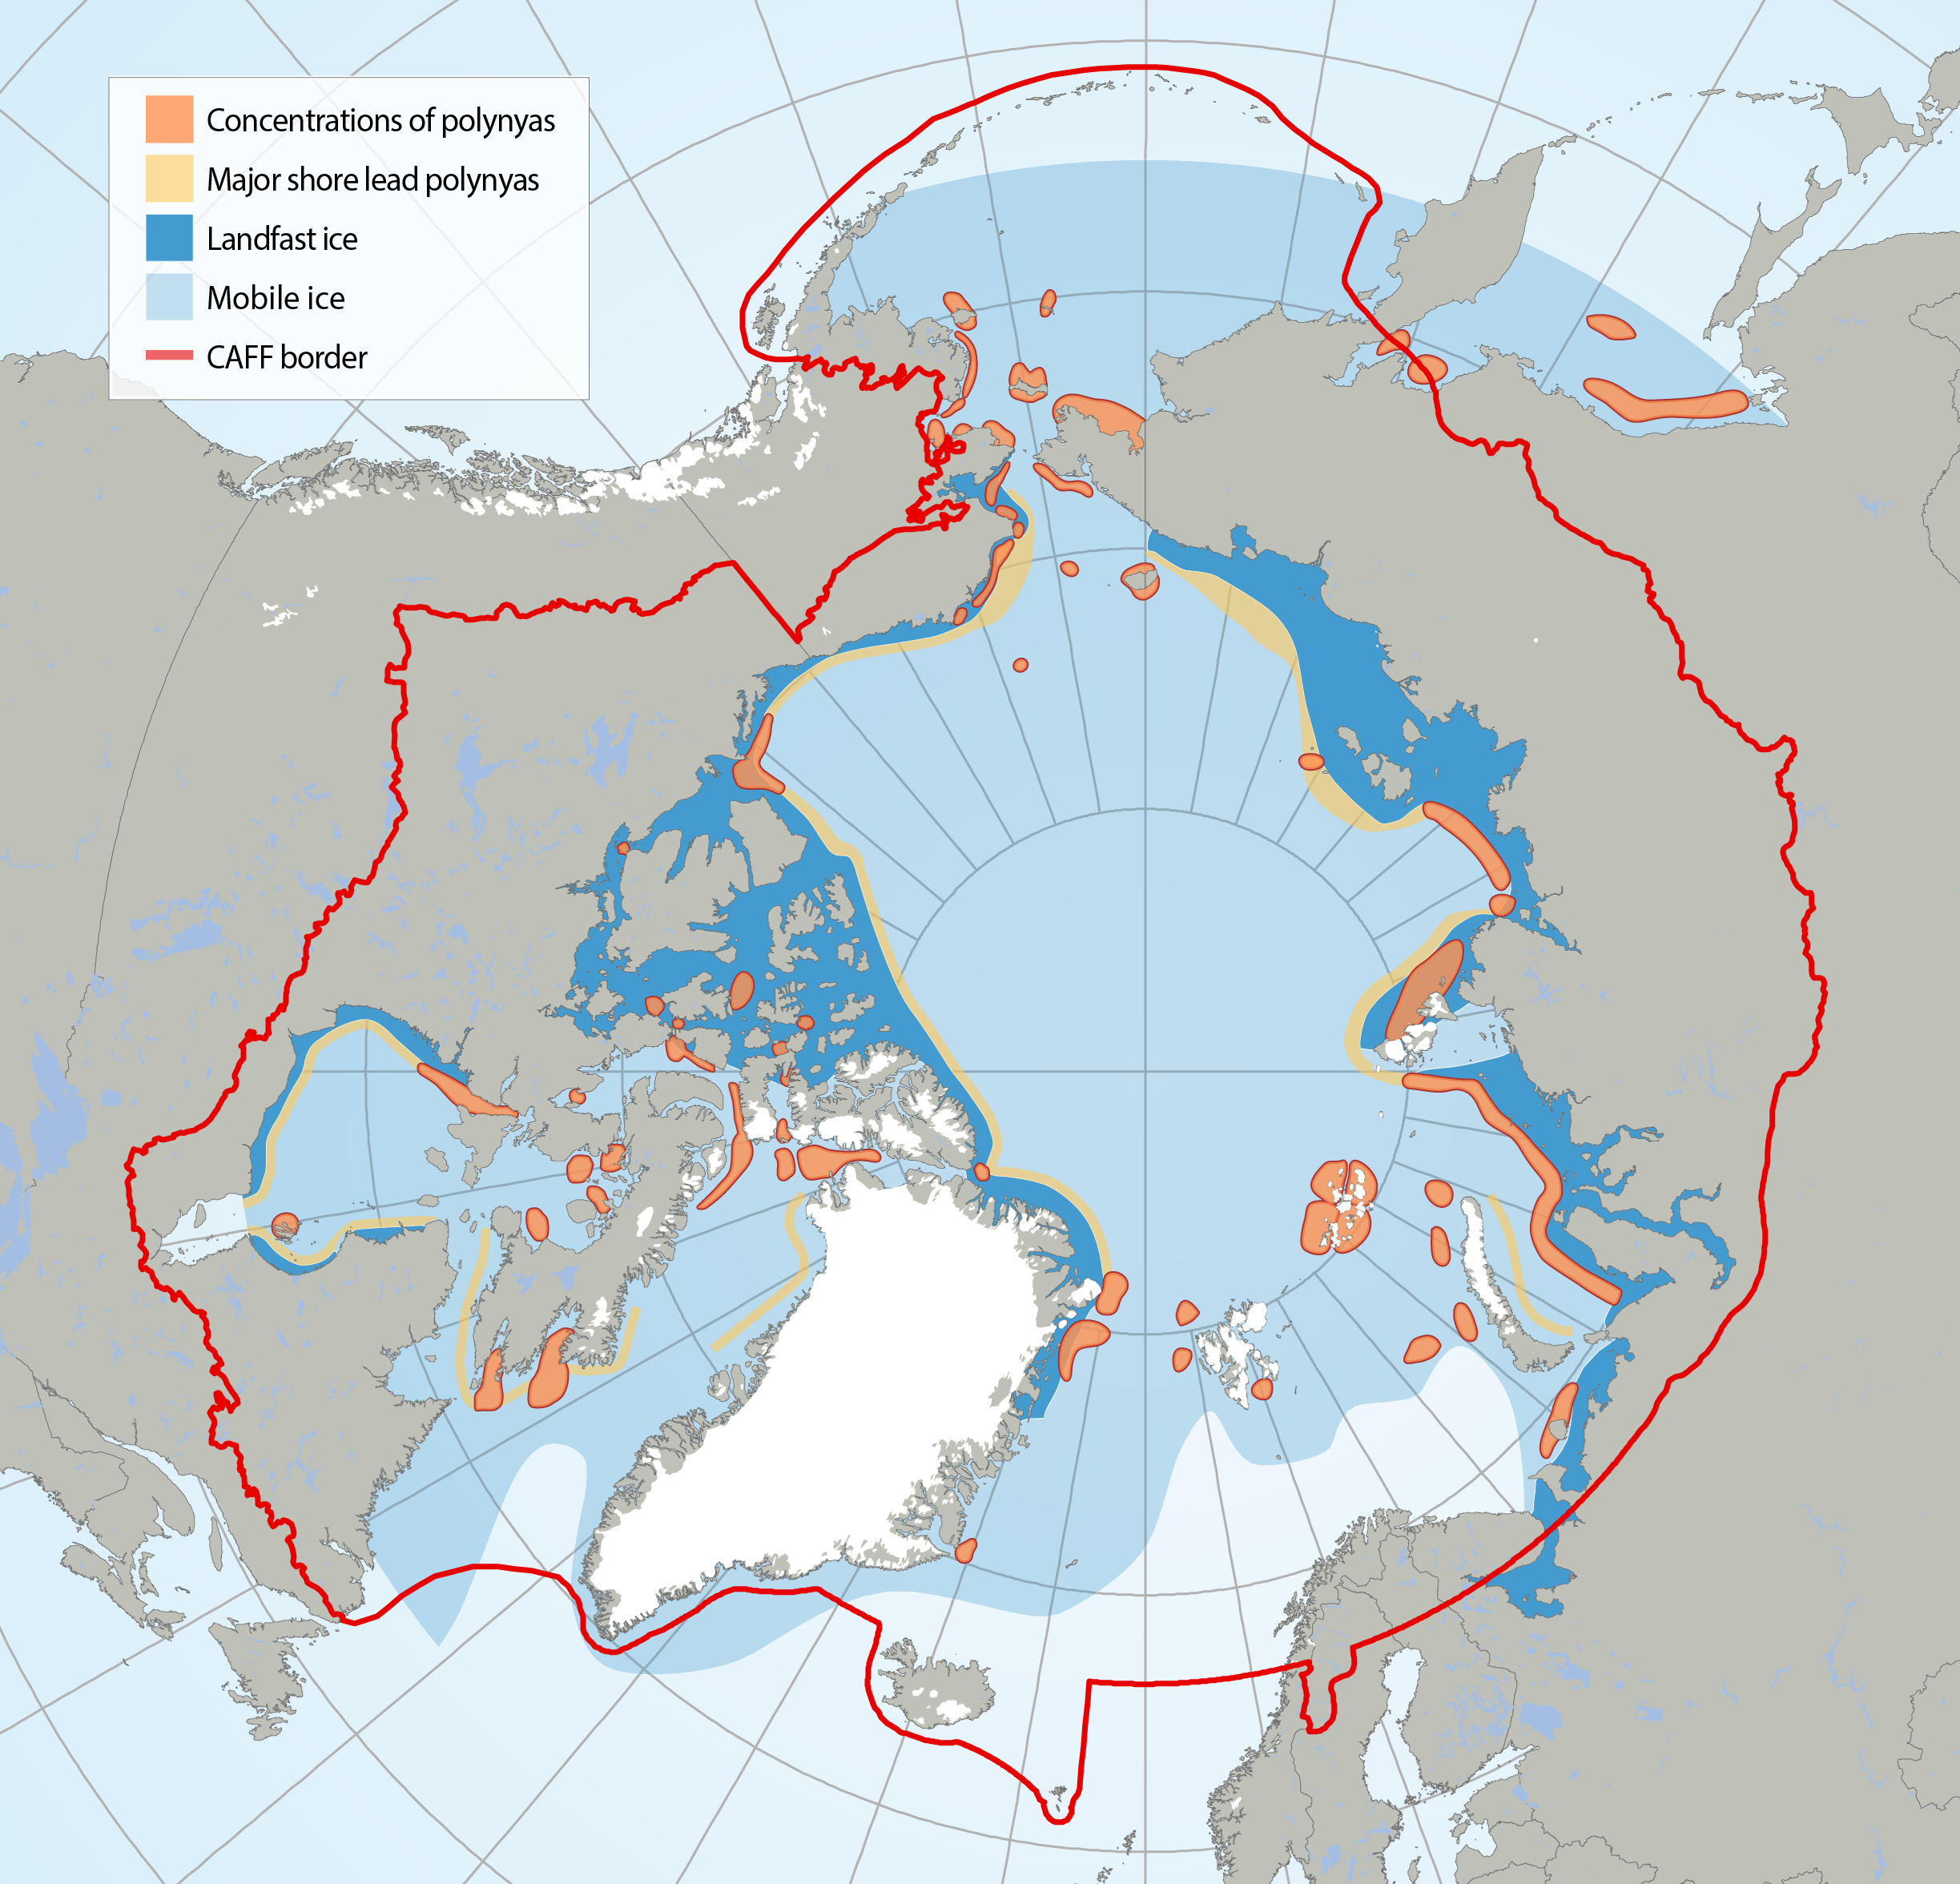
Circumpolar map of known polynyas. Note that polynyas are dynamic systems and some may no longer exist in the form known from their recent history. Adapted from Meltofte (2013) and based on Barber and Massom (2007). STATE OF THE ARCTIC MARINE BIODIVERSITY REPORT - <a href="https://arcticbiodiversity.is/marine" target="_blank">Chapter 2</a> - Page 28 - Figure 2.5
-
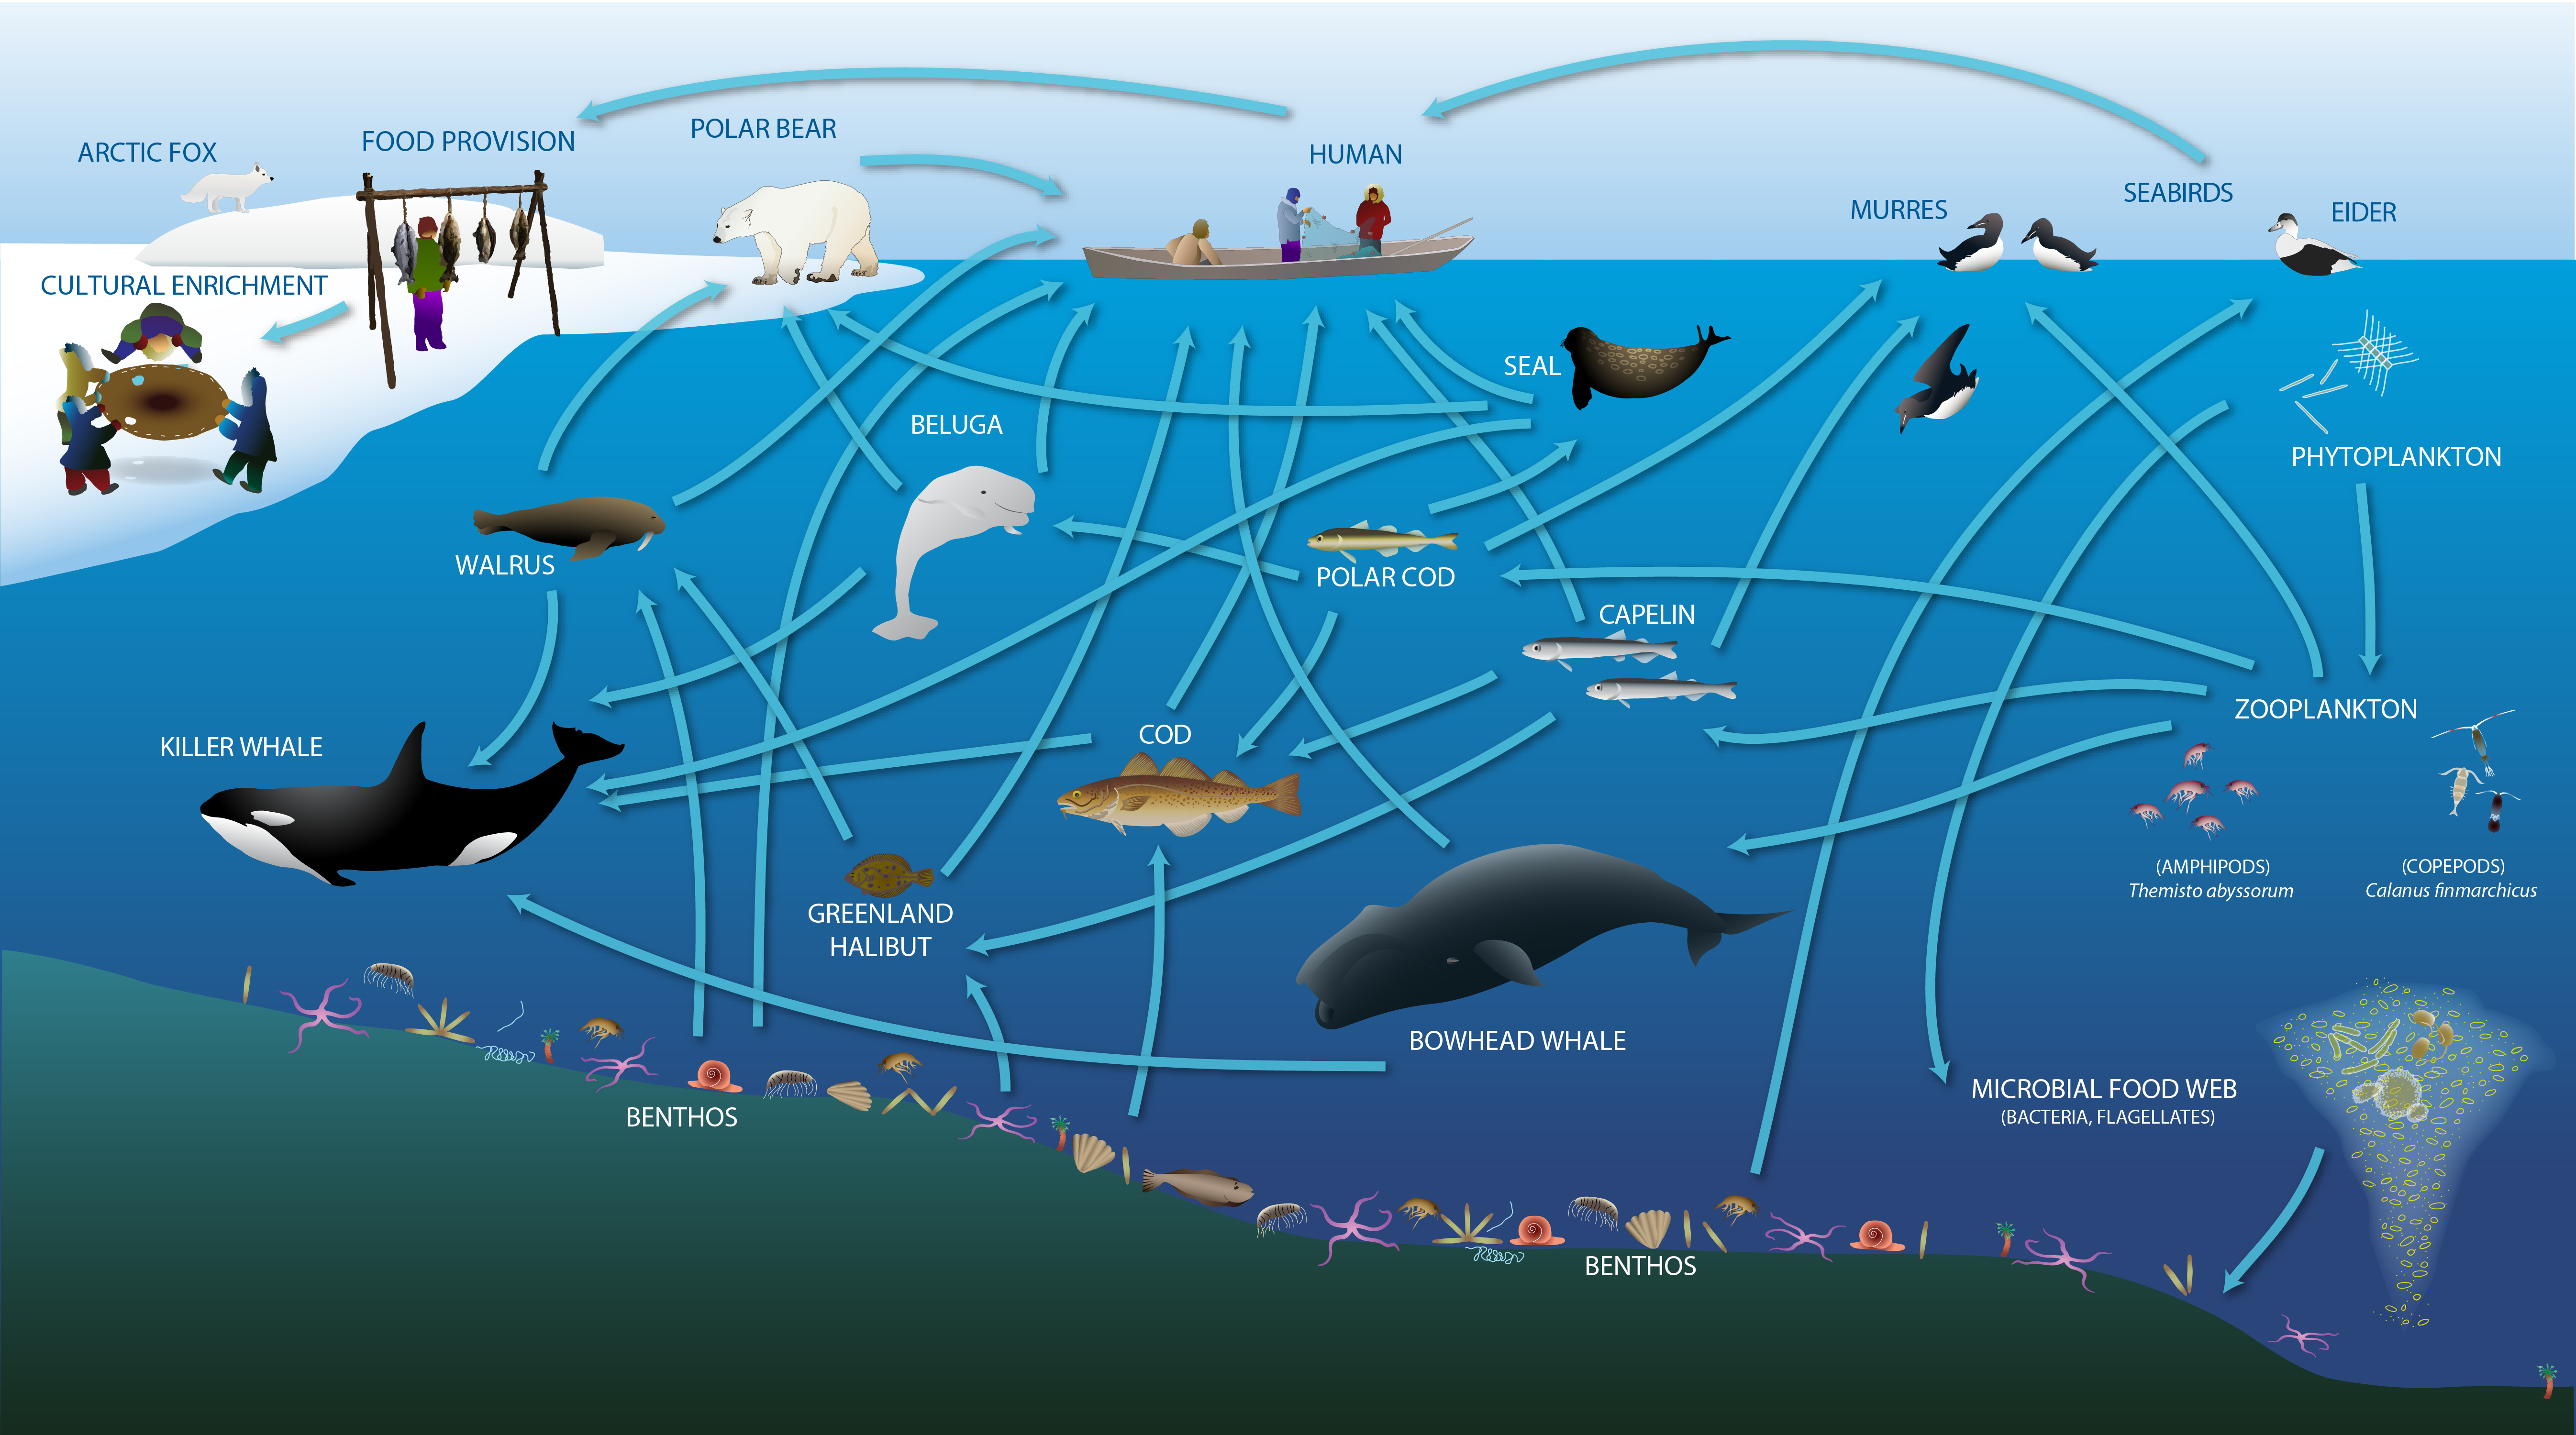
Changes expected or underway in the of energy flow in the High Arctic marine environment STATE OF THE ARCTIC MARINE BIODIVERSITY REPORT - <a href="https://arcticbiodiversity.is/marine" target="_blank">Chapter 2</a> - Page 23 - Figure 2.2b
-
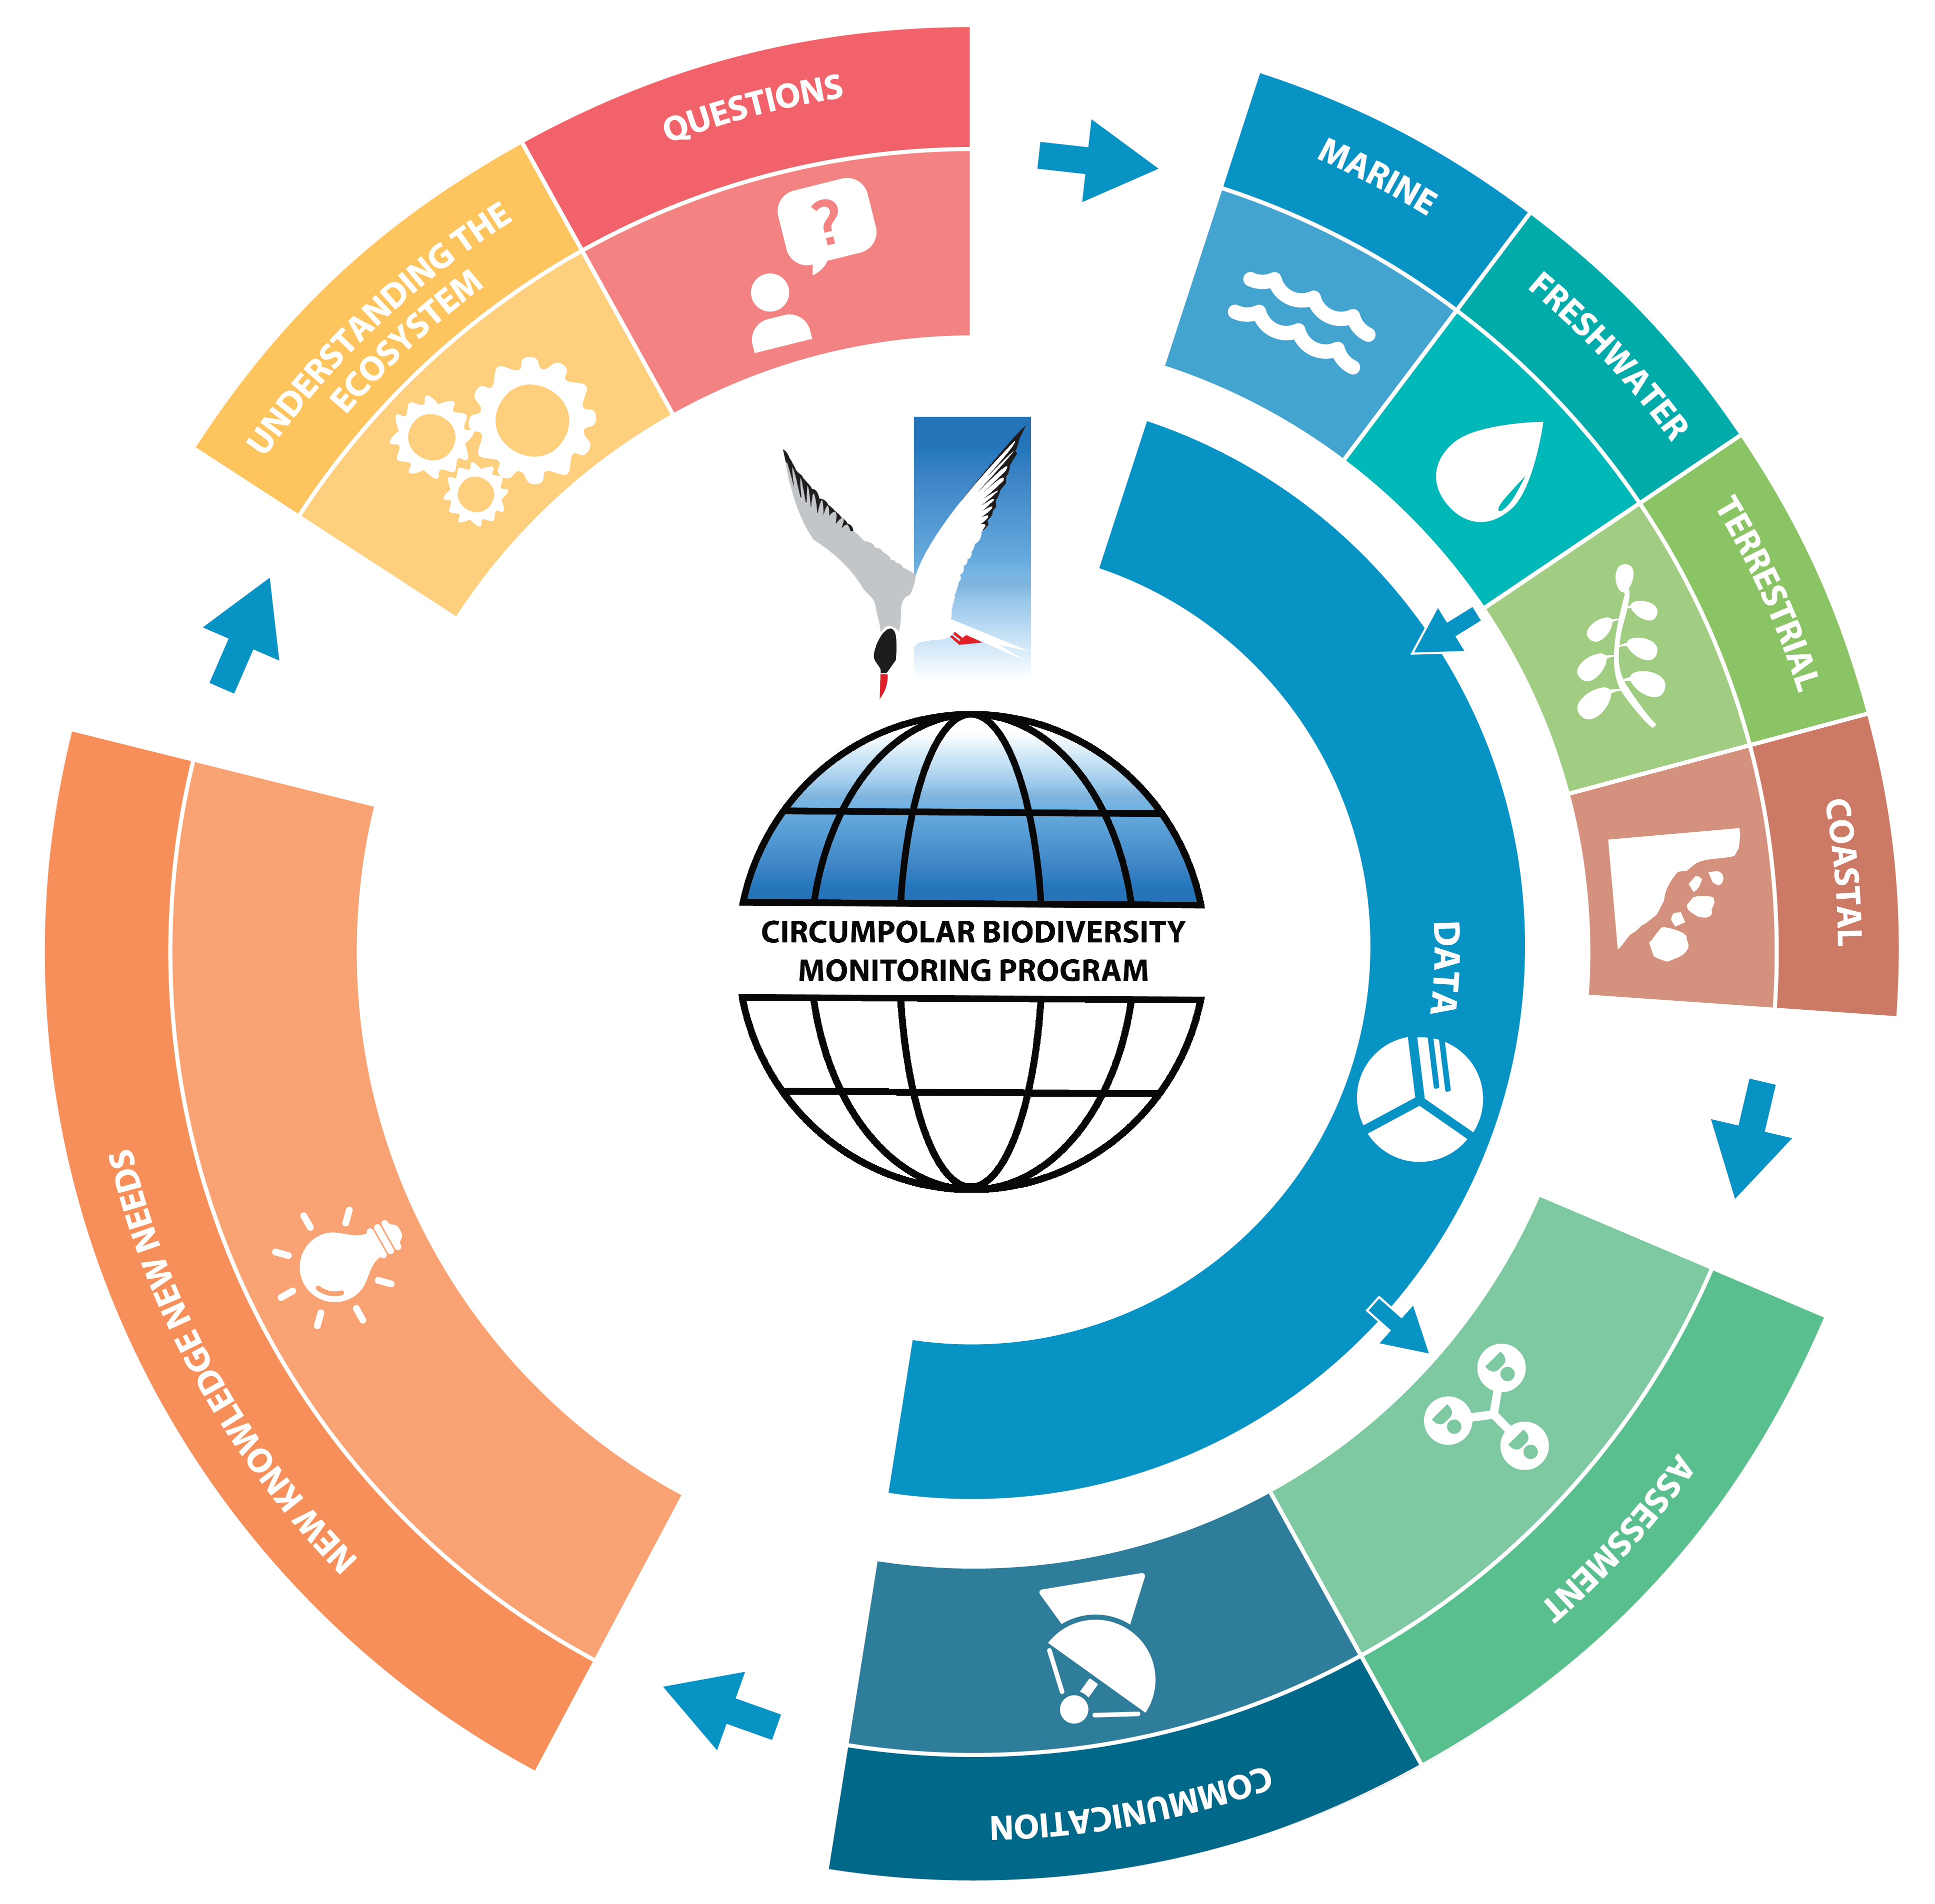
Workflow of the Circumpolar Biodiversity Monitoring Program (CBMP). STATE OF THE ARCTIC MARINE BIODIVERSITY REPORT - <a href="https://arcticbiodiversity.is/marine" target="_blank">Chapter 1</a> - Page 13 - Figure 1.1
-
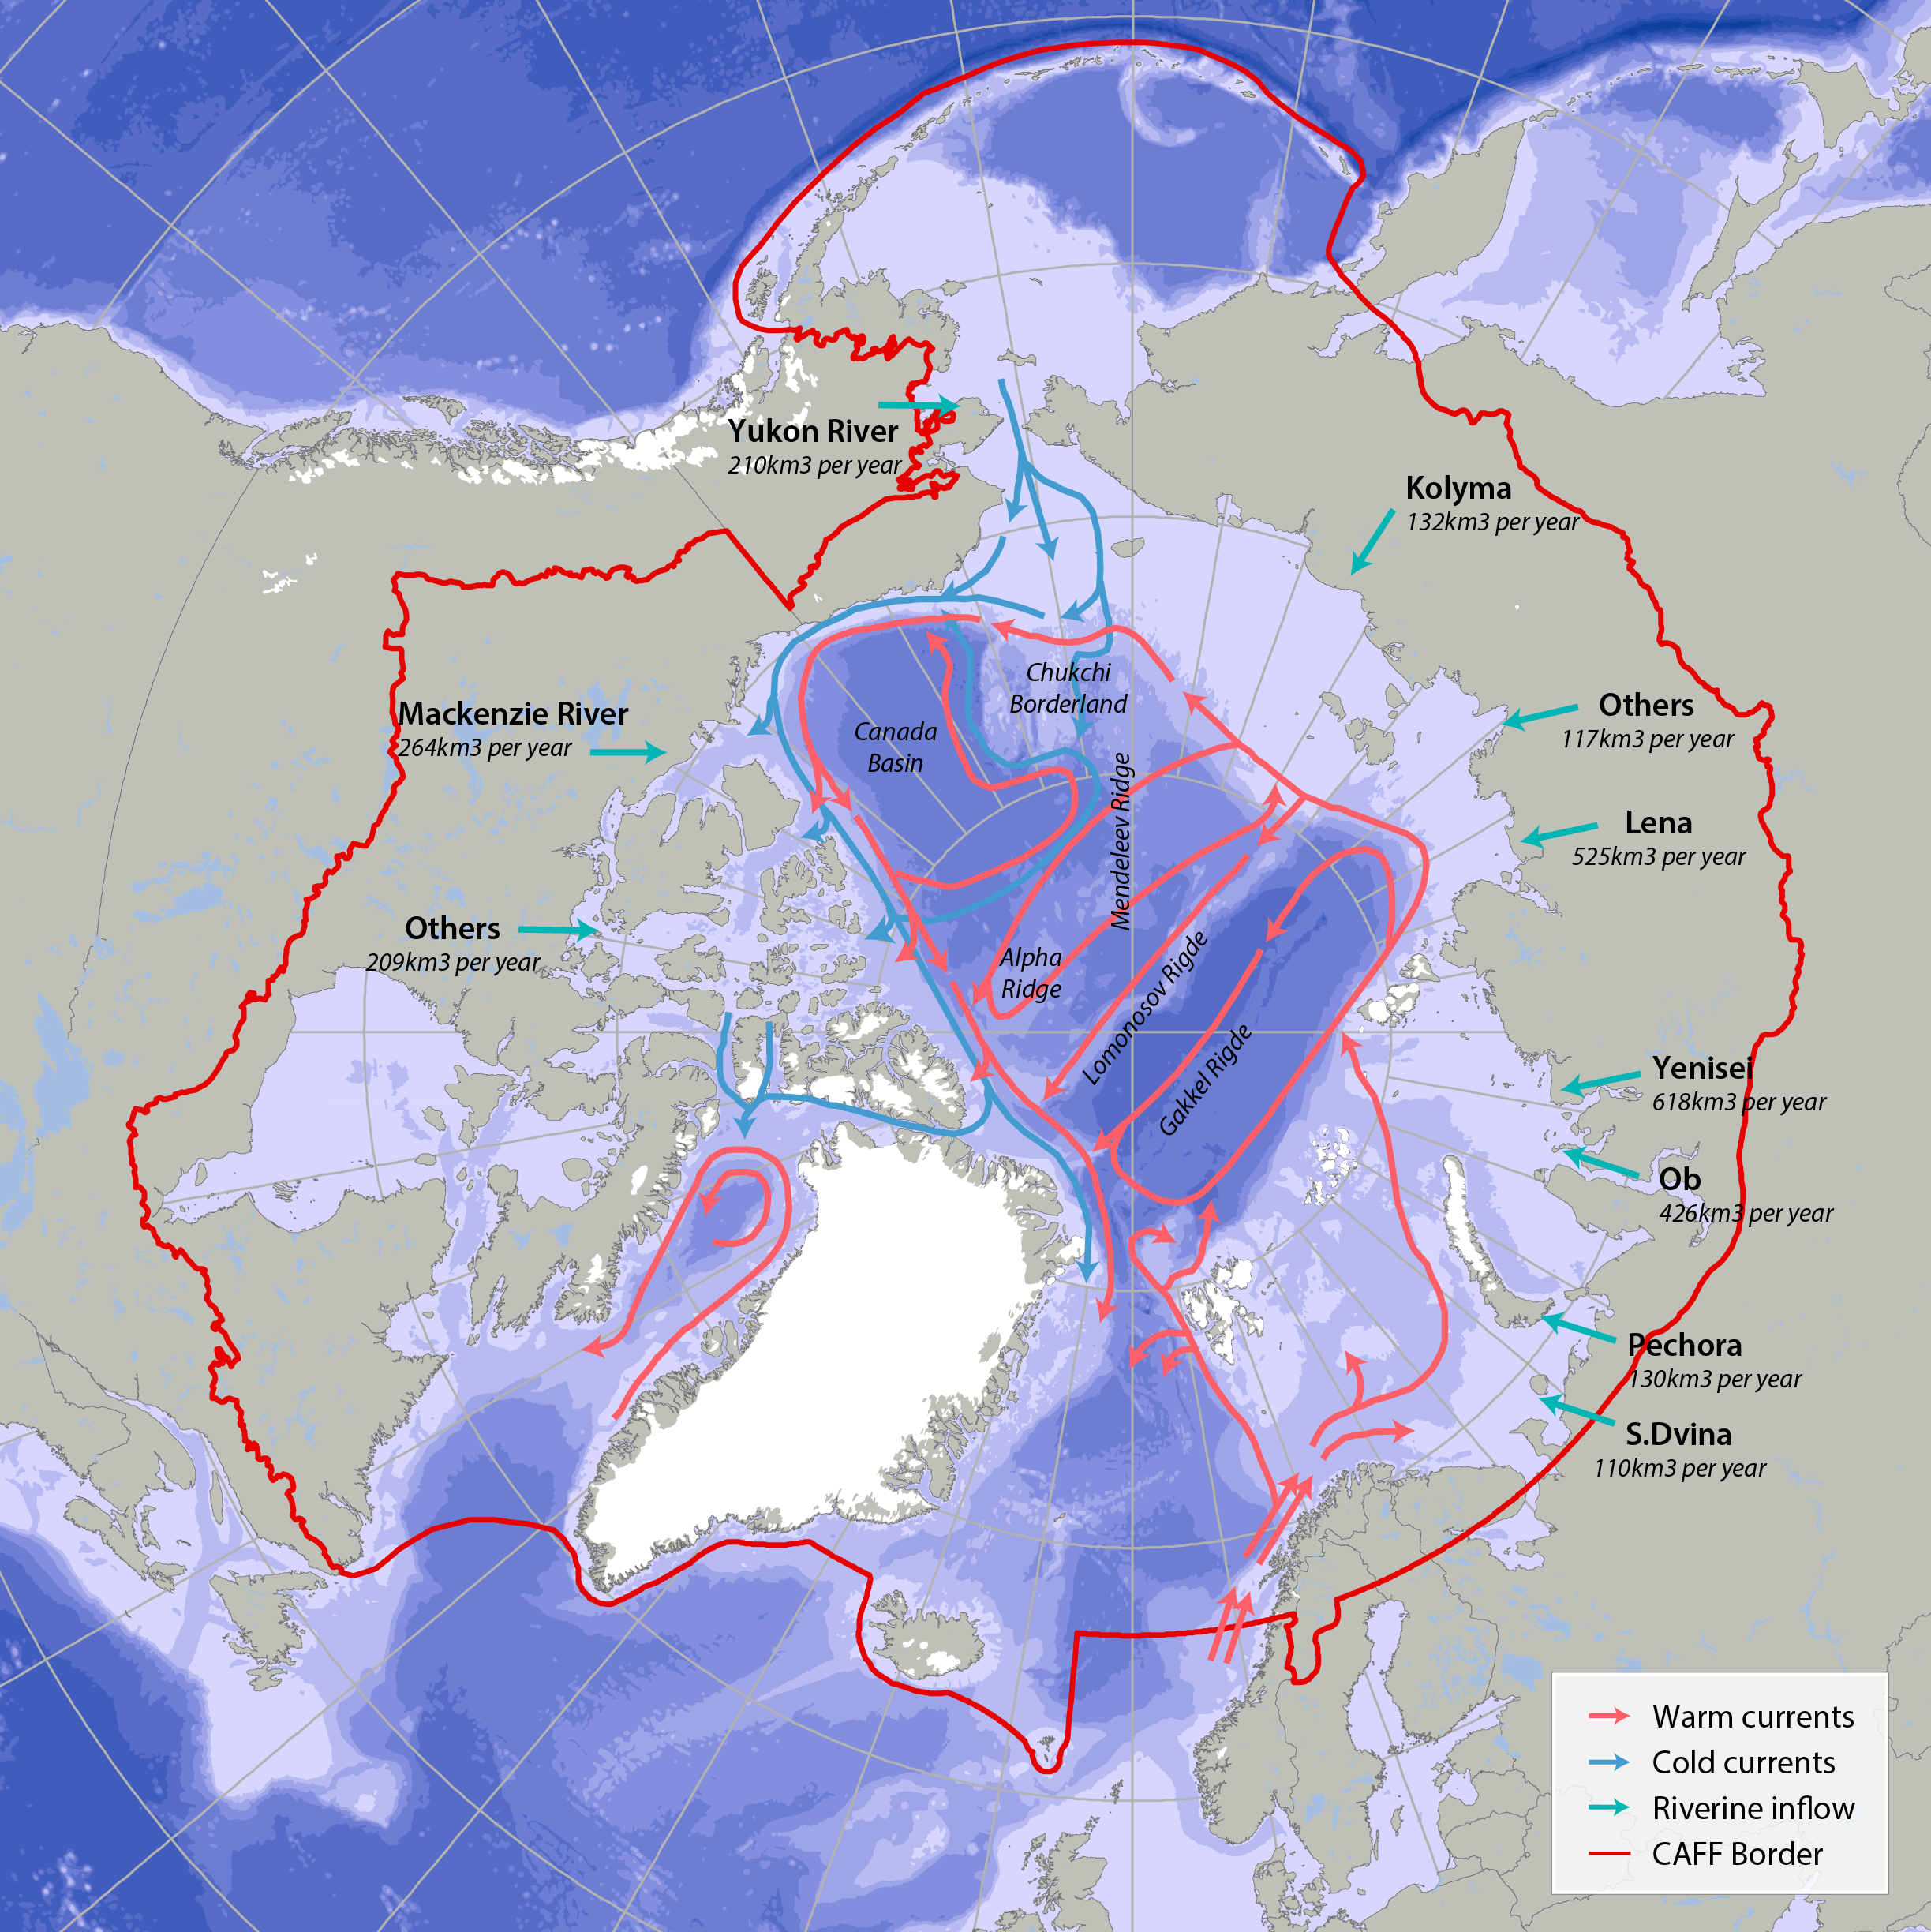
Bathymetric features, warm currents (red arrows), cold currents (blue arrows) and riverine inflow in the Arctic. Adapted from Jakobsen et al. (2012). Simplified Arctic Ocean currents (Fig. 2.1) show that the main circulation patterns follow the continental shelf breaks and margins of the basins in the Arctic Ocean. Different global models predict different types of changes, which can cause changes to Arctic ecosystems (AMAP 2013, Meltofte 2013). STATE OF THE ARCTIC MARINE BIODIVERSITY REPORT - <a href="https://arcticbiodiversity.is/marine" target="_blank">Chapter 2</a> - Page 22 - Figure 2.1