 CAFF - Arctic Biodiversity Data Service (ABDS)
inlandWaters
Type of resources
Available actions
Topics
Keywords
Contact for the resource
Provided by
Representation types
Update frequencies
status
-
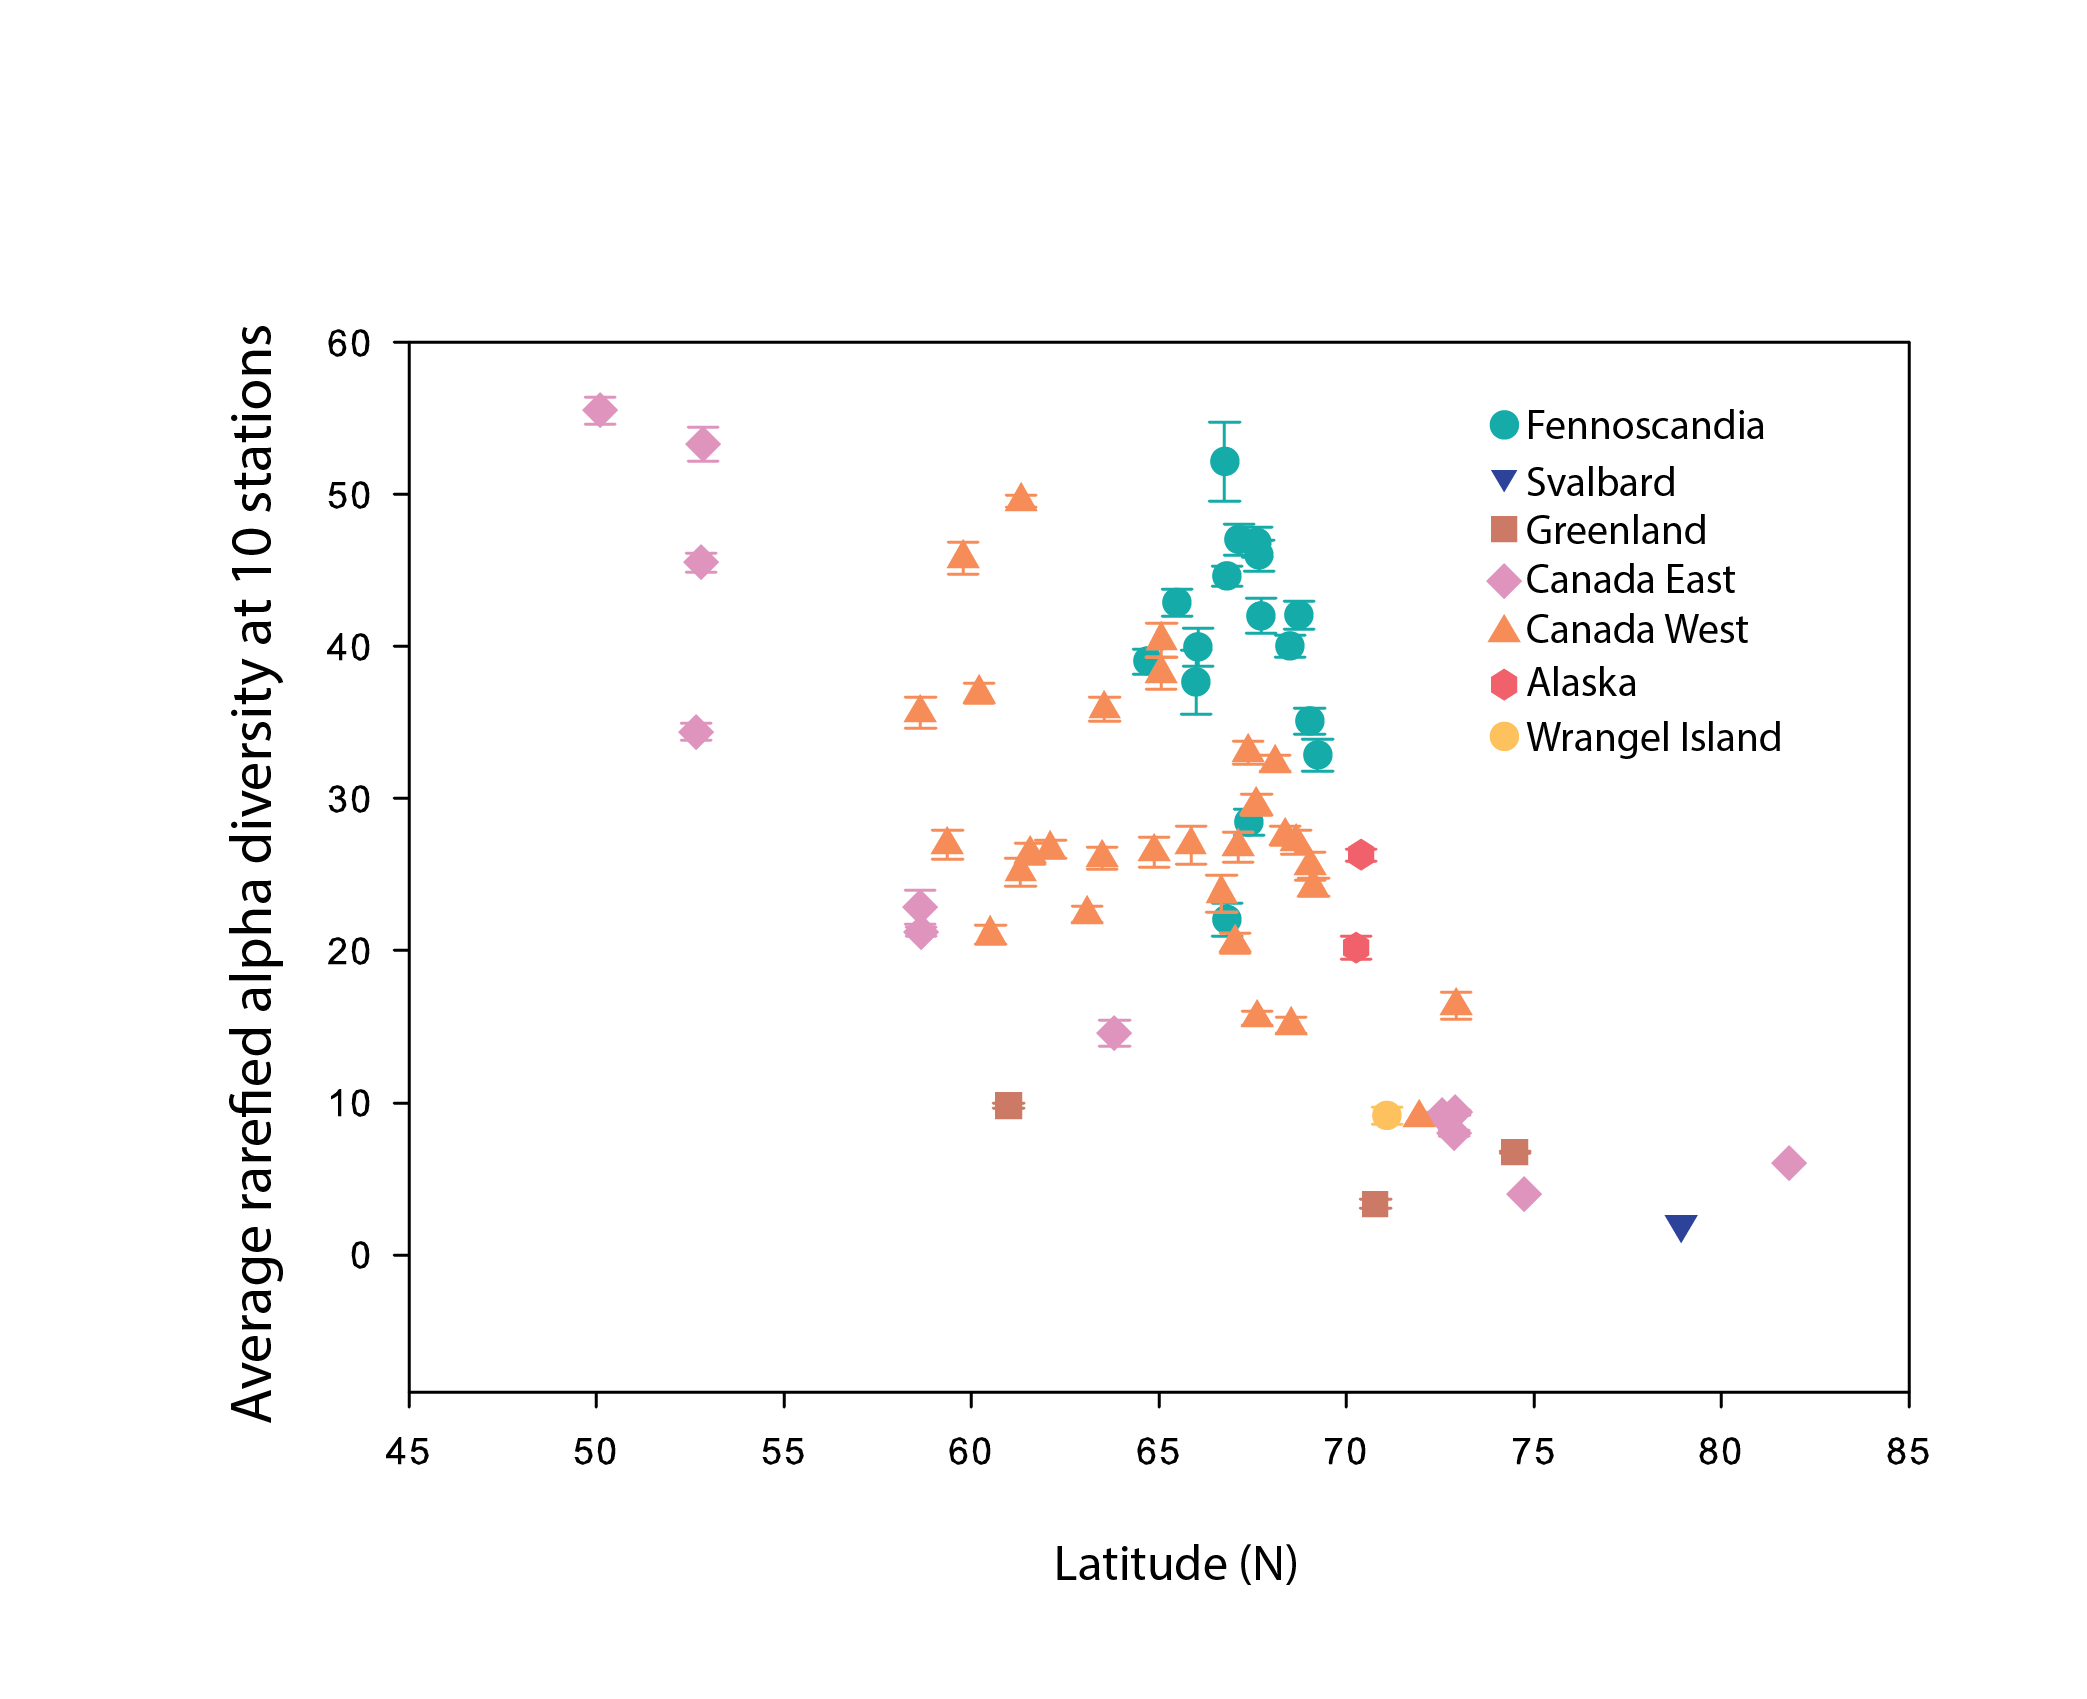
Alpha diversity (rarefied to 10 stations, with error bars indicating standard error) of river benthic macroinvertebrates plotted as a function of the average latitude of stations in each hydrobasin. Hydrobasins are coloured based on country/region State of the Arctic Freshwater Biodiversity Report - Chapter 4 - Page 68 - Figure 4-32
-
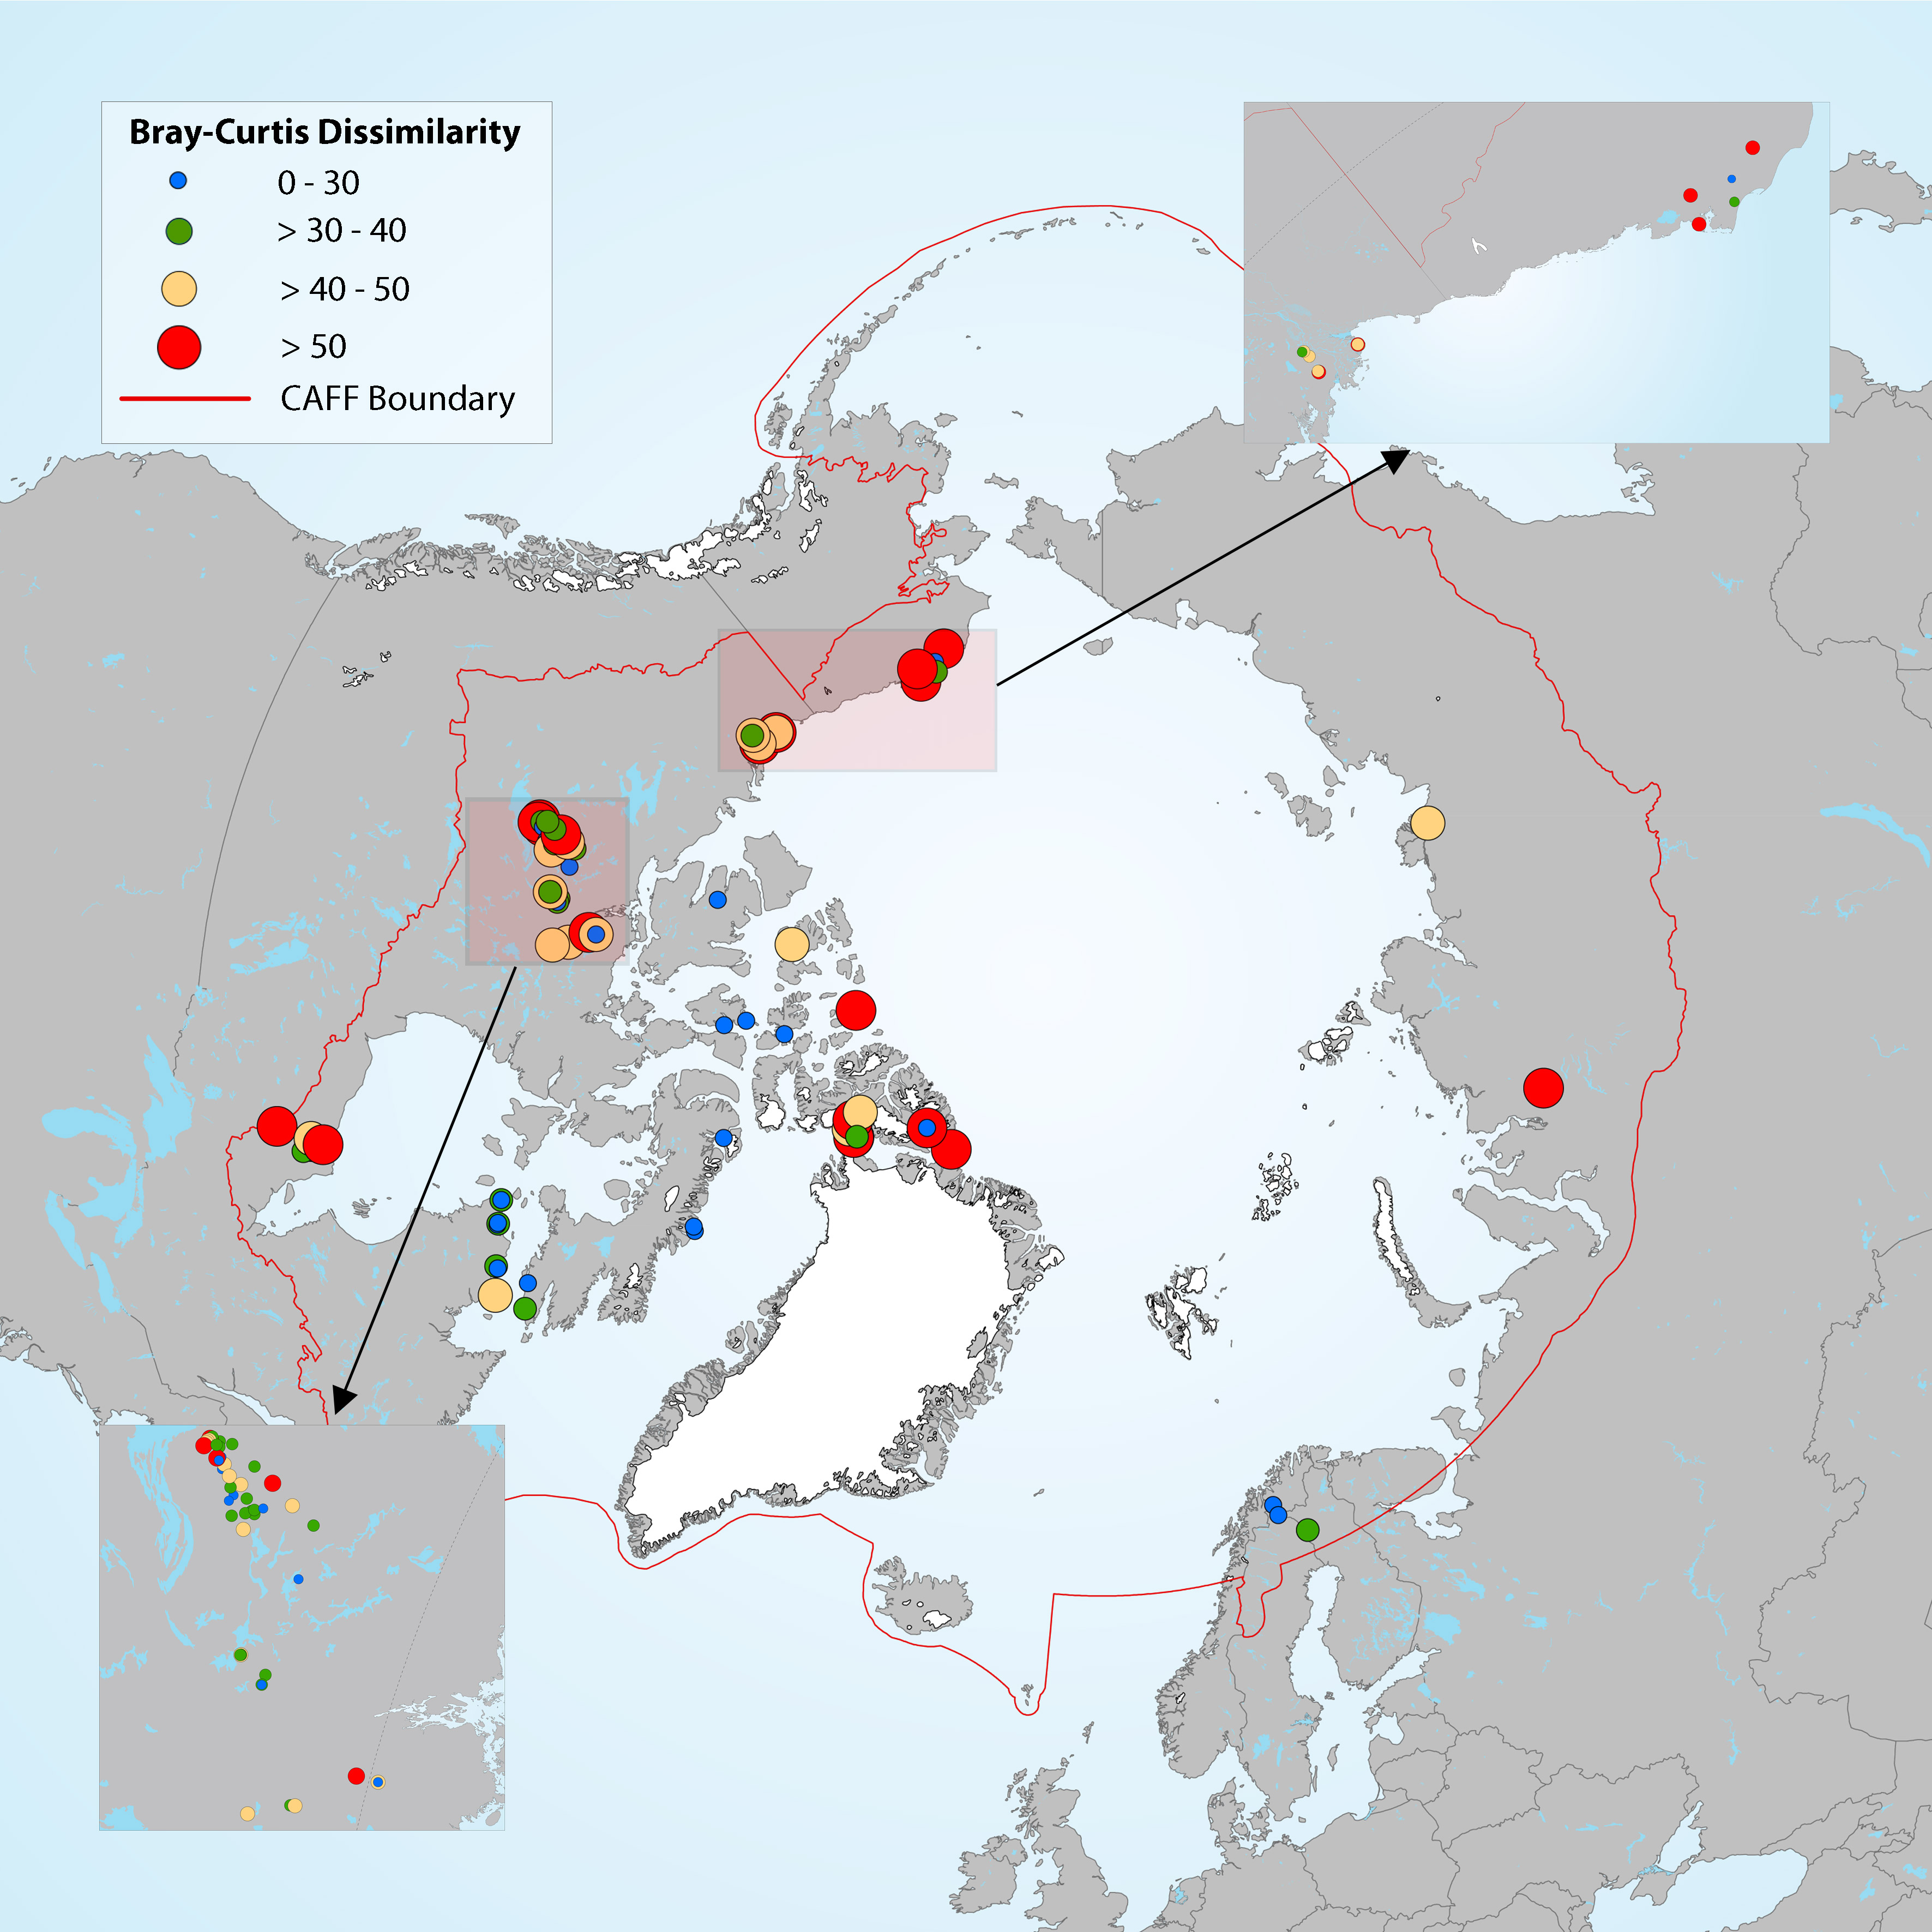
Estimation of diatom assemblage changes over a period of about 200 years (top versus bottom sediment cores). Figure 4-14 Map showing the magnitude of change in diatom assemblages between bottom (pre-industrial) and top (modern) section of the cores, estimated by Bray-Curtis (B-C) dissimilarity. Boundaries for the B-C dissimilarity categories are based on distribution quartiles (0-30%, 30-40%, 40- 50% and >50%), where the lowest values (blue dots) represent the lowest degree of change in diatom assemblage composition between top and bottom sediment core samples in each lake. State of the Arctic Freshwater Biodiversity Report - Chapter 4 - Page 41 - Figure 4-14
-
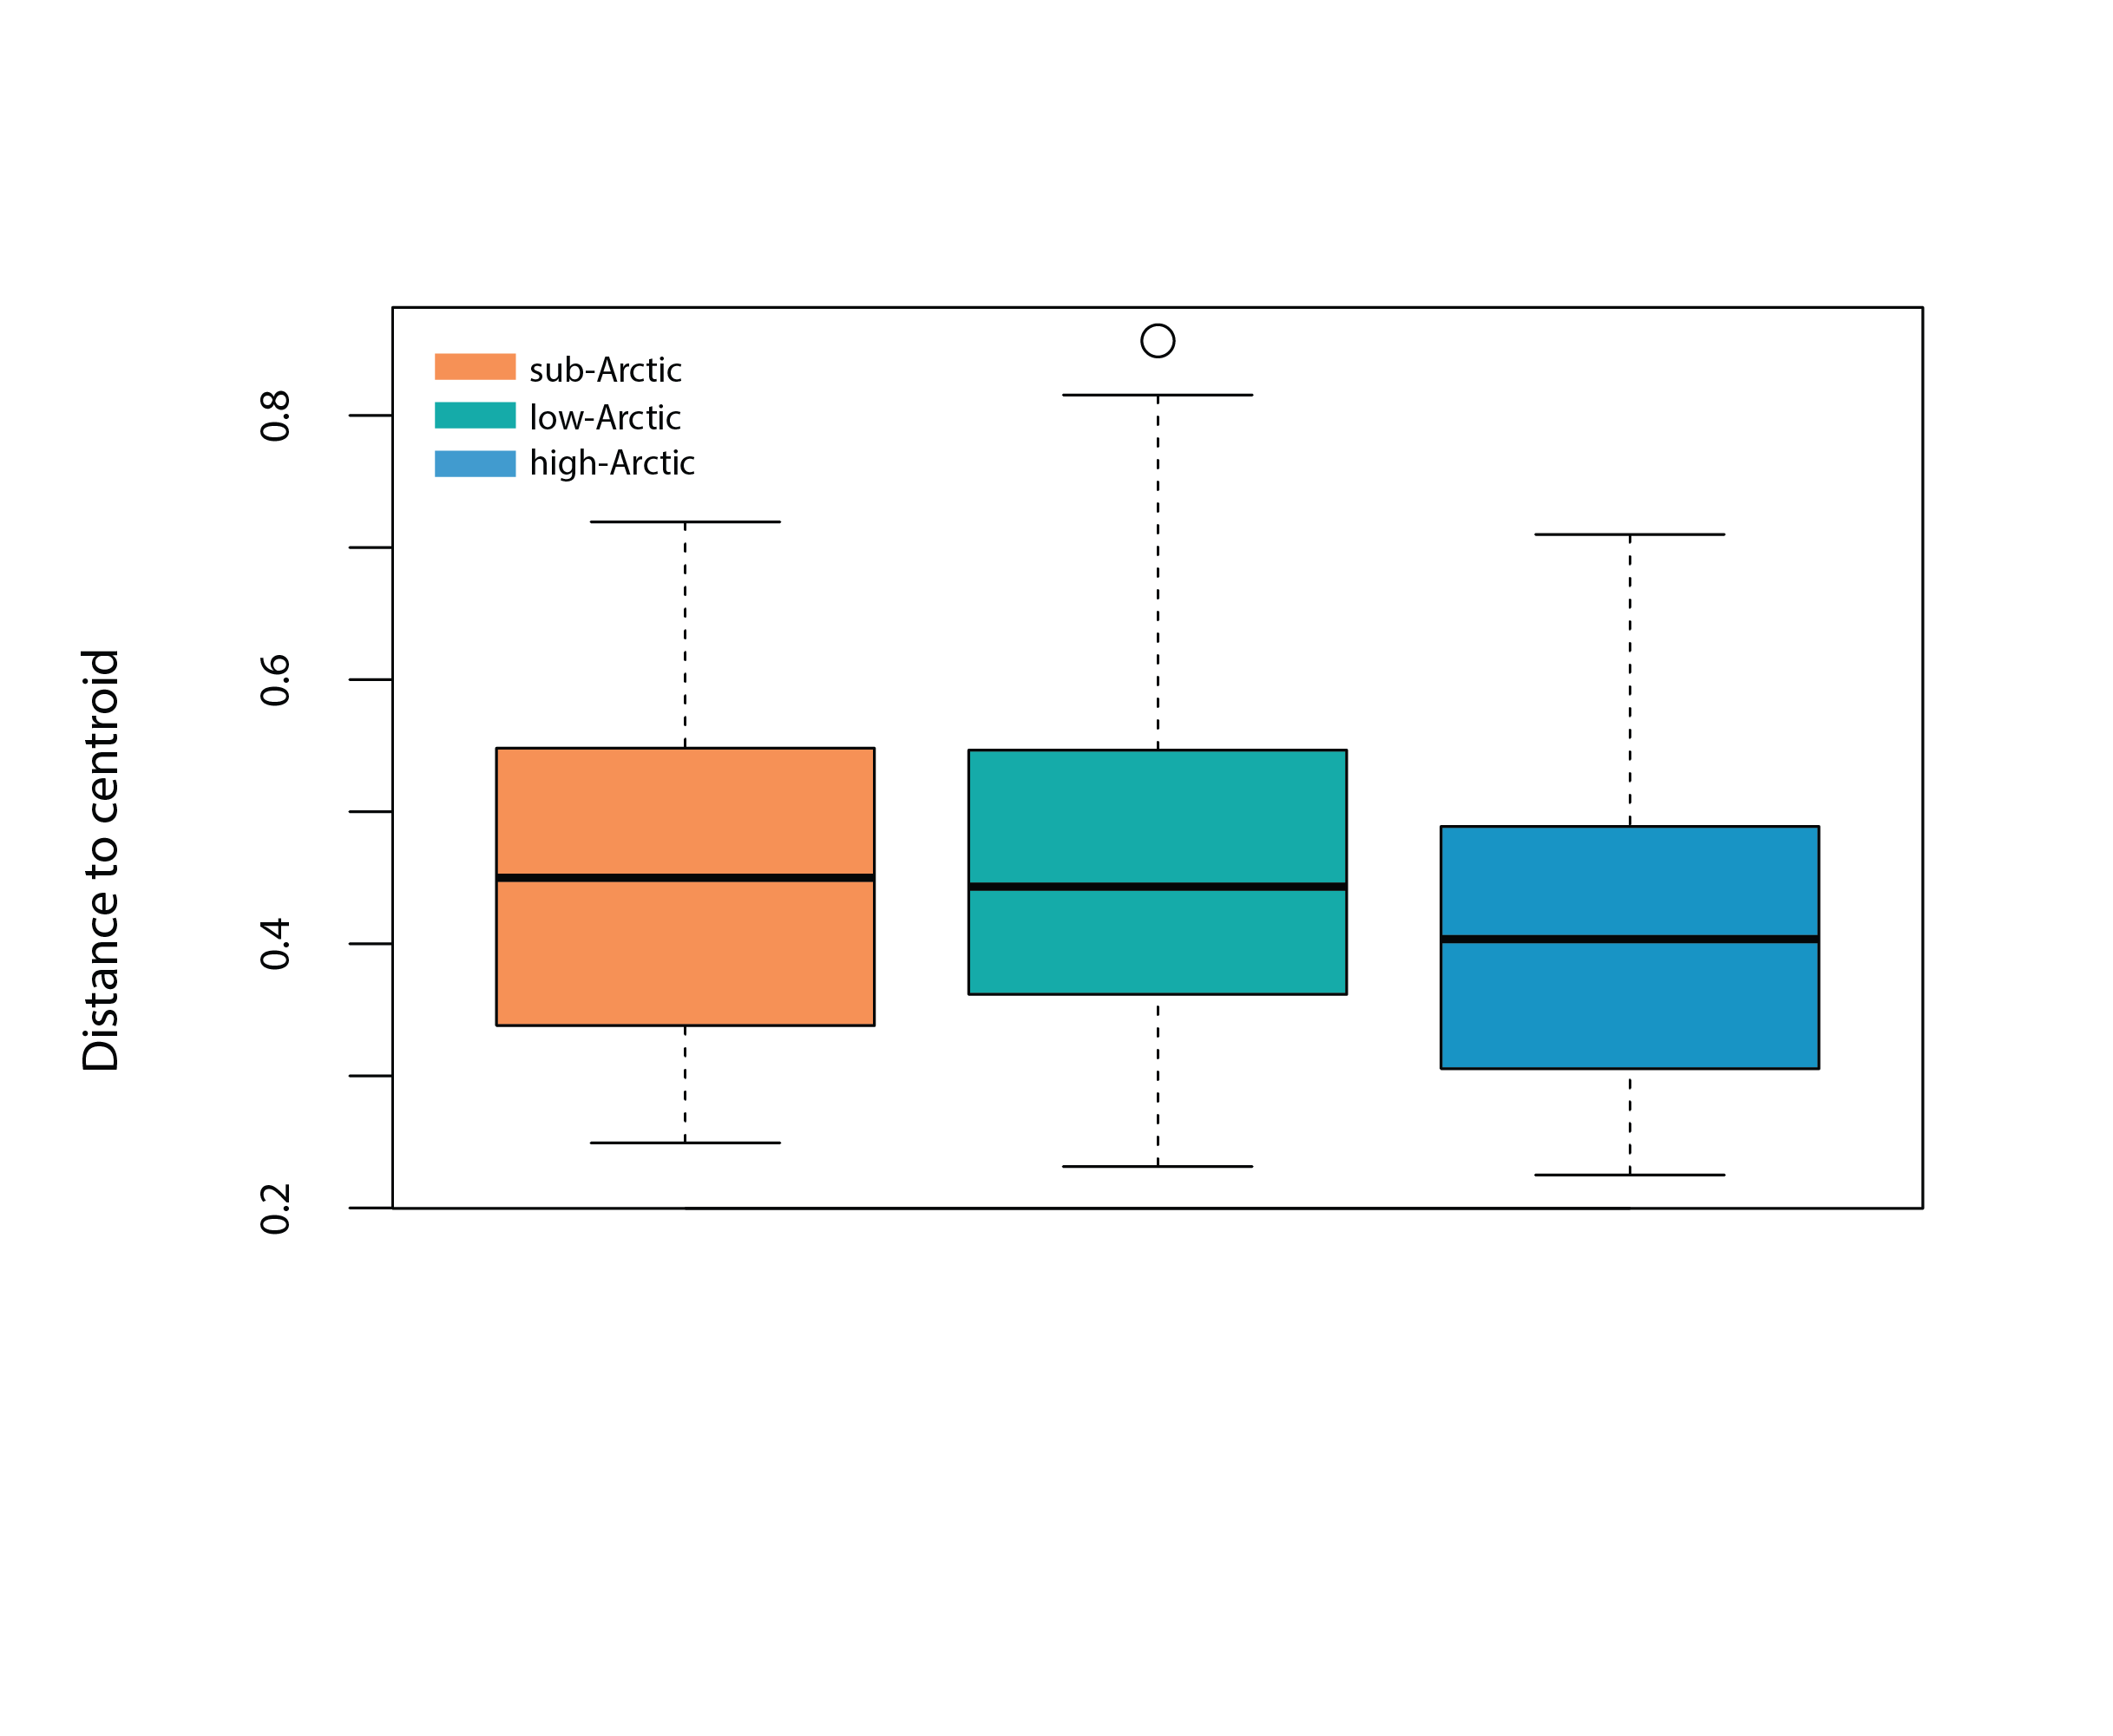
Box plot represents the homogeneity of assemblages in high Arctic (n=190), low Arctic (n=370) and sub-Arctic lakes (n=1151), i.e., the distance of individual lake phytoplankton assemblages to the group centroid in multivariate space. The mean distance to the centroid for each of the regions can be seen as an estimated of beta diversity, with increasing distance equating to greater differences among assemblages. State of the Arctic Freshwater Biodiversity Report - Chapter 4 - Page 48 - Figure 4-18
-
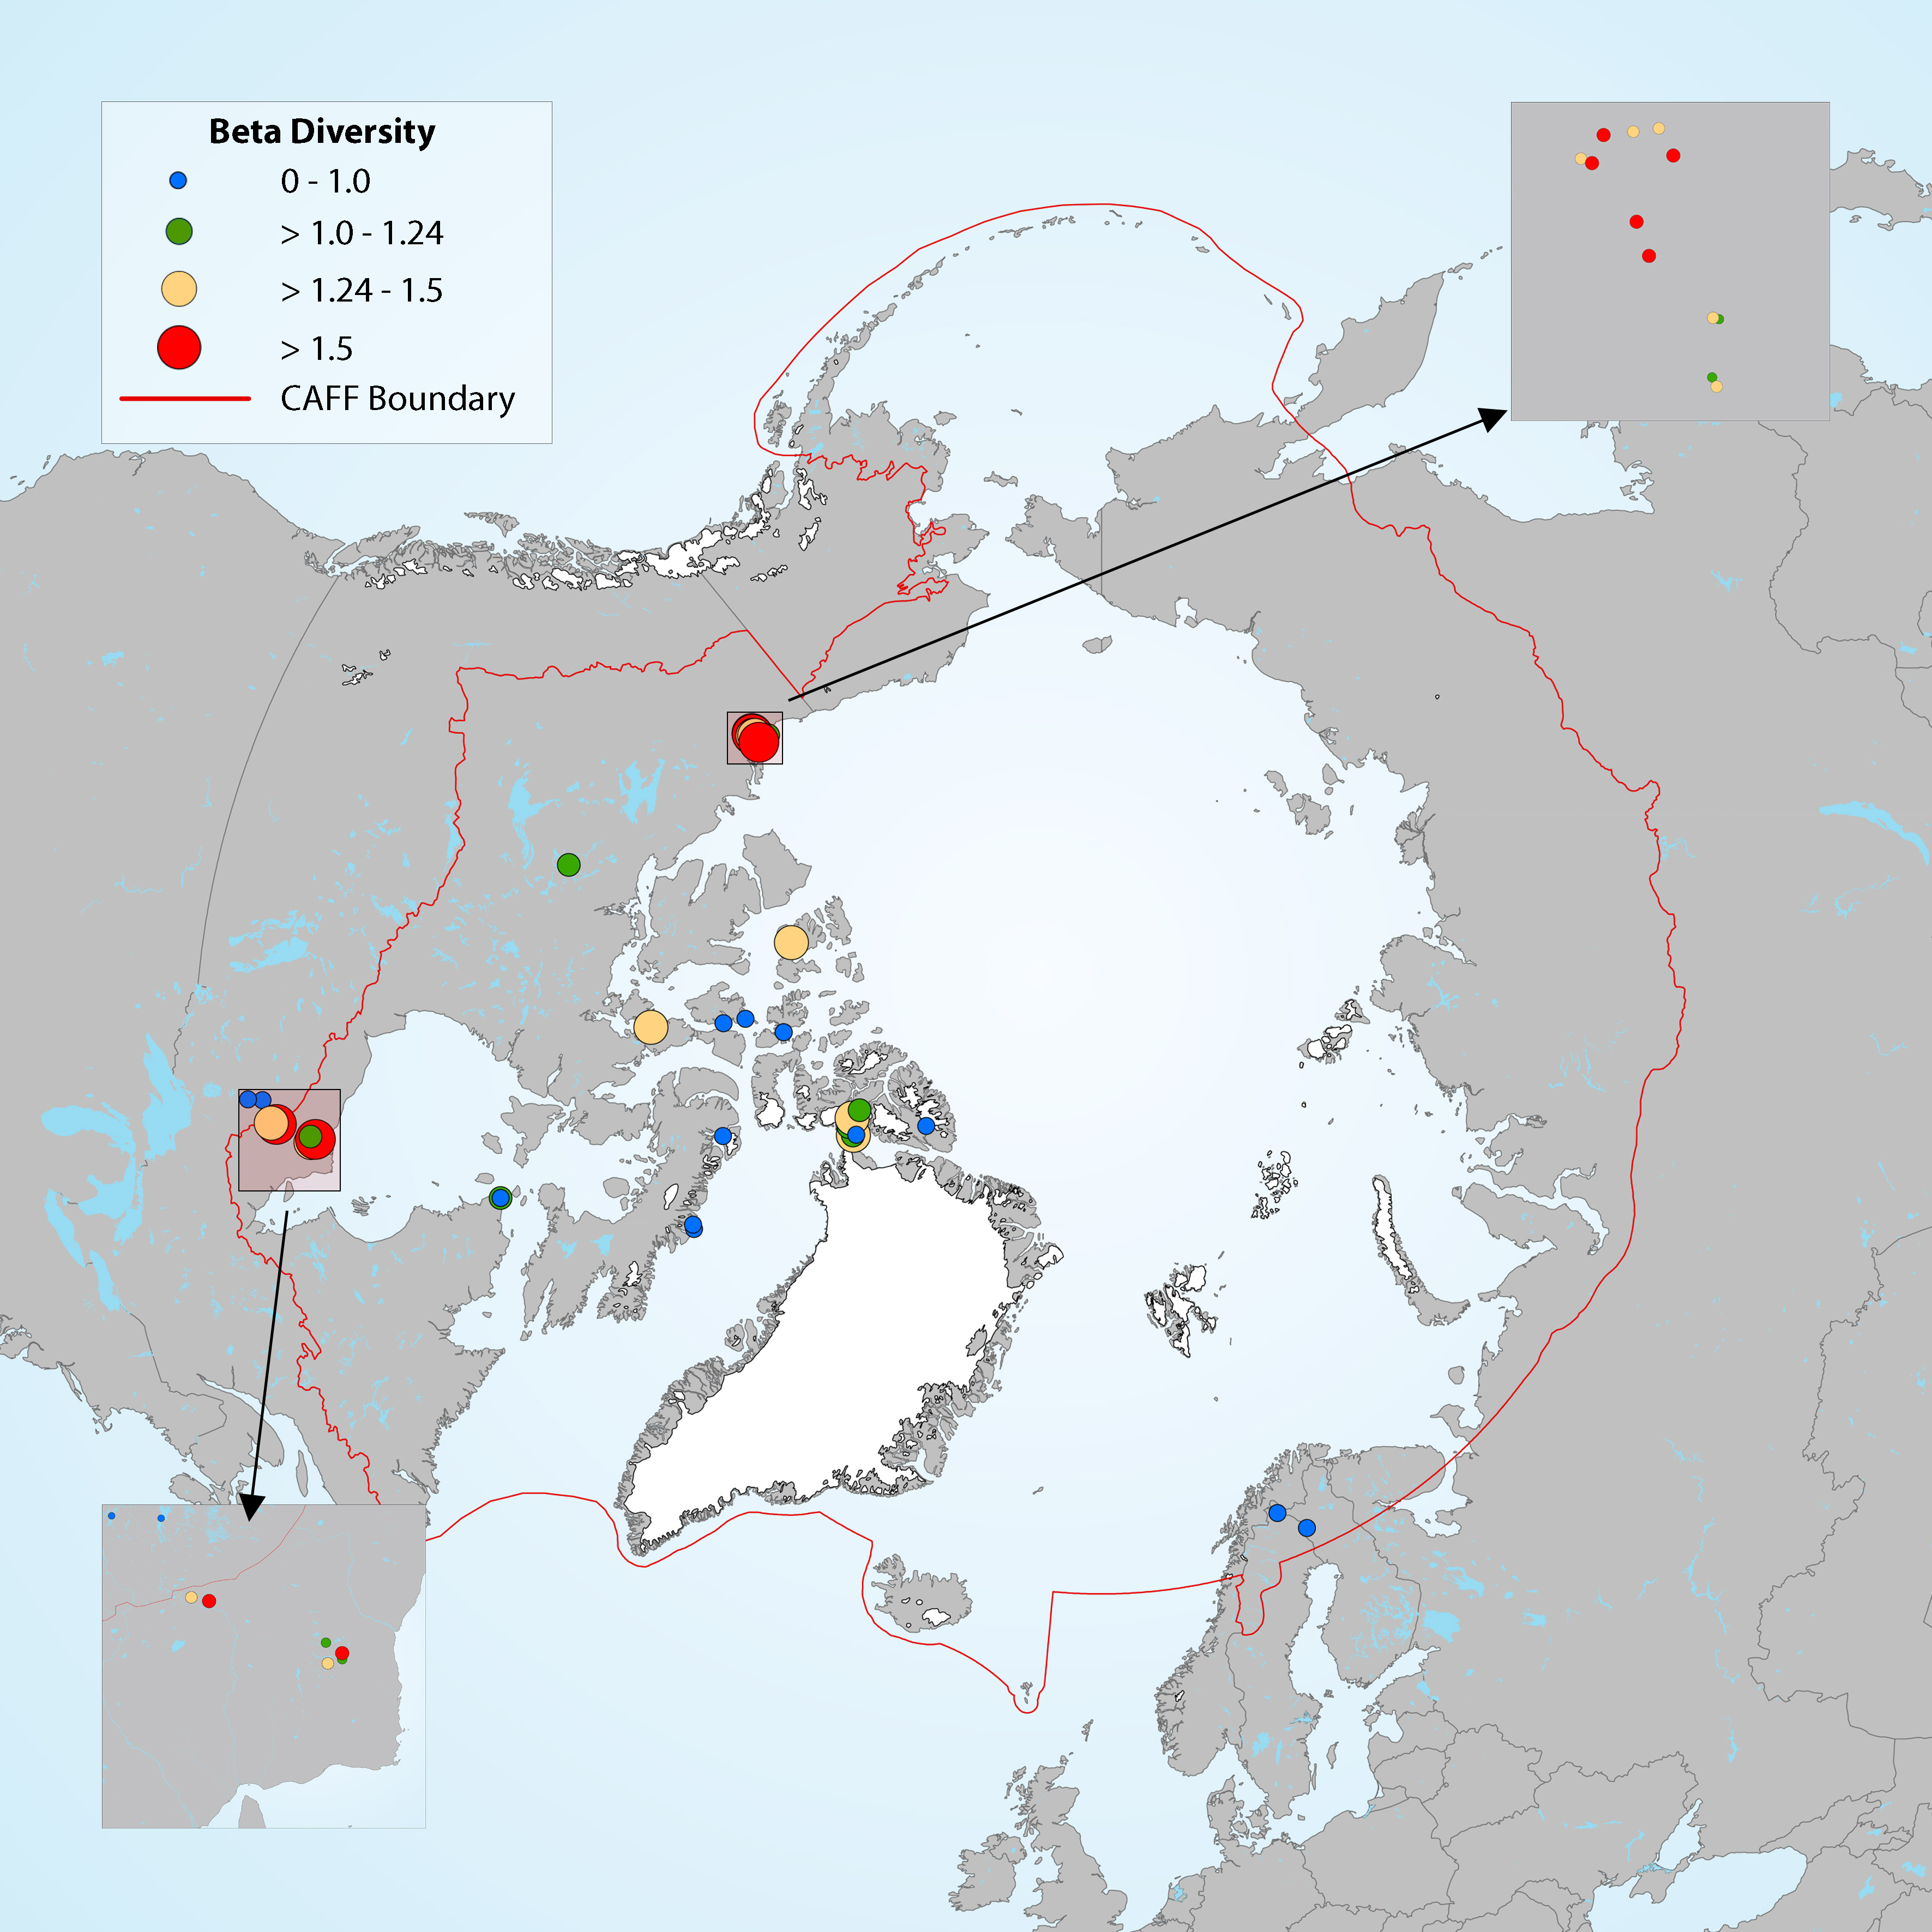
Figure 4-16 Map showing the magnitude of change in diatom assemblages for downcore samples, with beta diversity used as a measure of the compositional differences between samples at different depths along the core. Boundaries for the beta diversity categories are based on distribution quartiles (0-0.1, 0.1-1.24, 1.24-1.5, >1.5), where the lowest values (blue dots) represent the lowest degree of change in diatom assemblage composition along the length of the core in each lake. State of the Arctic Freshwater Biodiversity Report - Chapter 2 - Page 15 - Figure 2-1
-
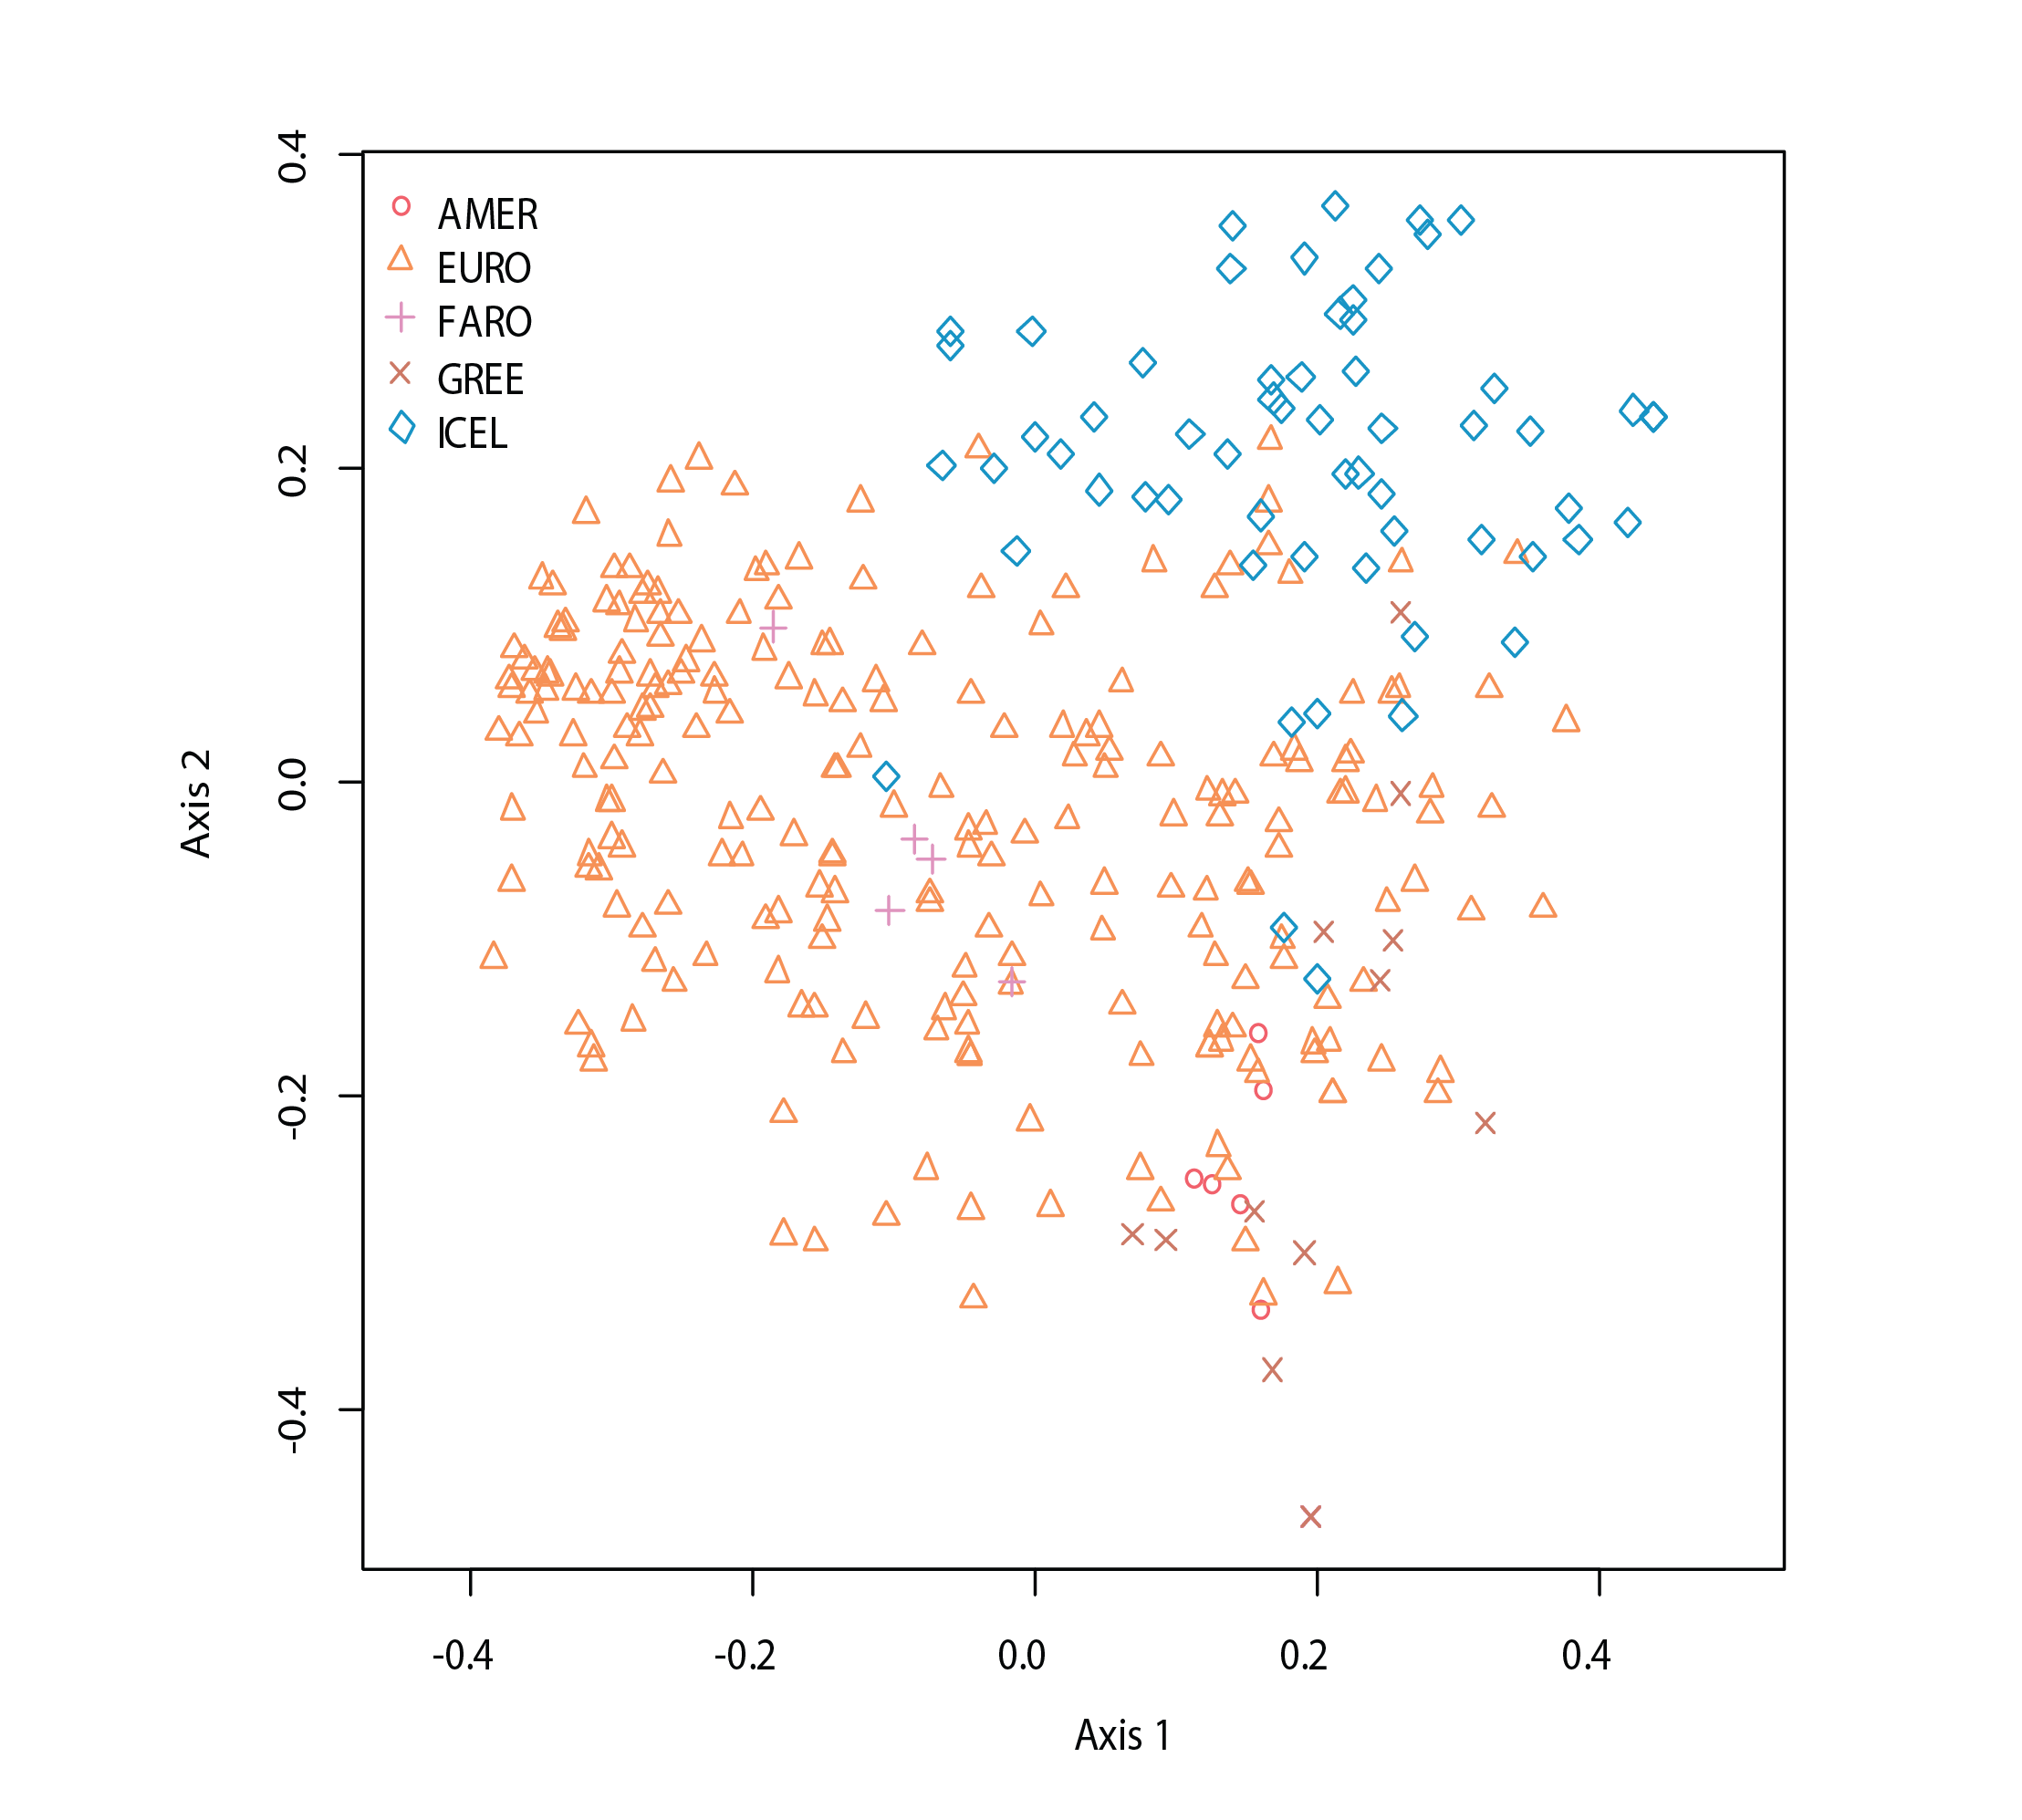
Orgination of macrophyte data (axis labels should be changed from Dim1 to Axis I and from Dim2 to Axis II), with symbols/colours differing by region. State of the Arctic Freshwater Biodiversity Report - Chapter 3 - Page 55 - Figure 4-24
-

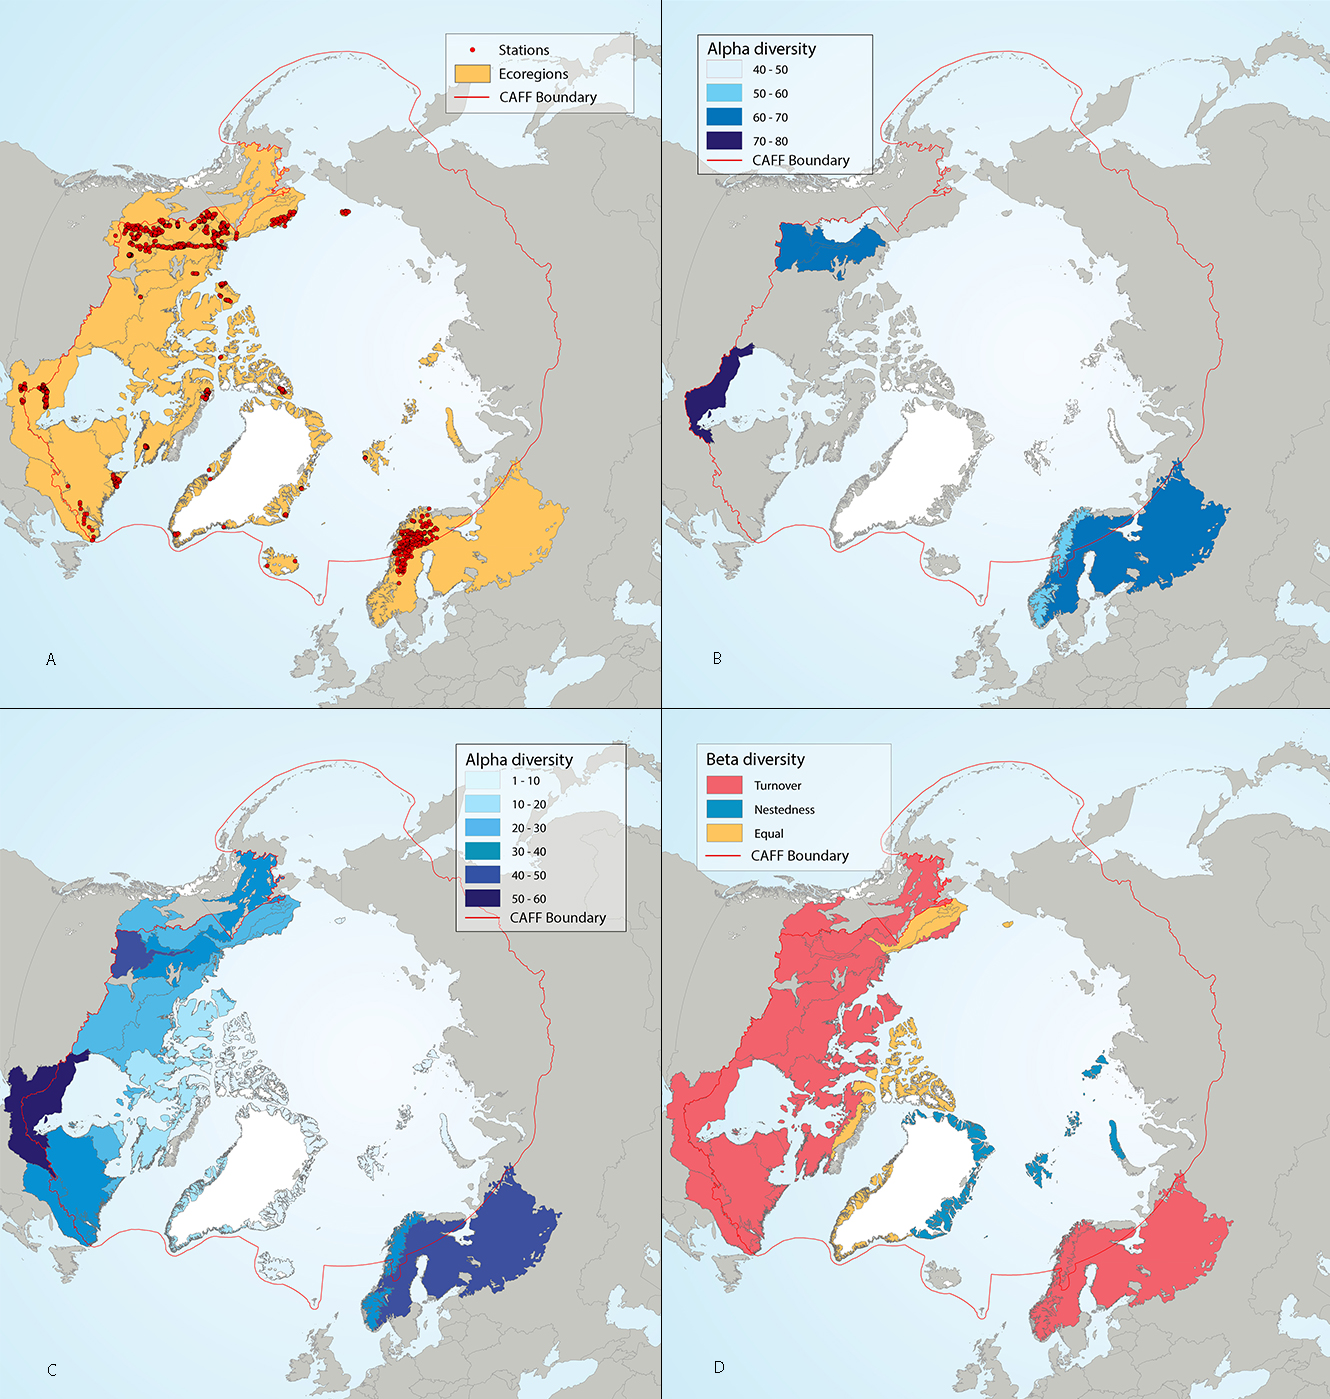
Figure 4 17 Results of circumpolar assessment of lake phytoplankton,(a) the location of phytoplankton stations, underlain by circumpolar ecoregions; (b) ecoregions with many phytoplankton stations, colored on the basis of alpha diversity rarefied to 35 stations; (c) all ecoregions with phytoplankton stations, colored on the basis of alpha diversity rarefied to 10 stations; (d) ecoregions with at least two stations in a hydrobasin, colored on the basis of the dominant component of beta diversity (species turnover, nestedness, approximately equal contribution, or no diversity) when averaged across hydrobasins in each ecoregion. State of the Arctic Freshwater Biodiversity Report - Chapter 4 - Page 56 - Figure 4-17
-
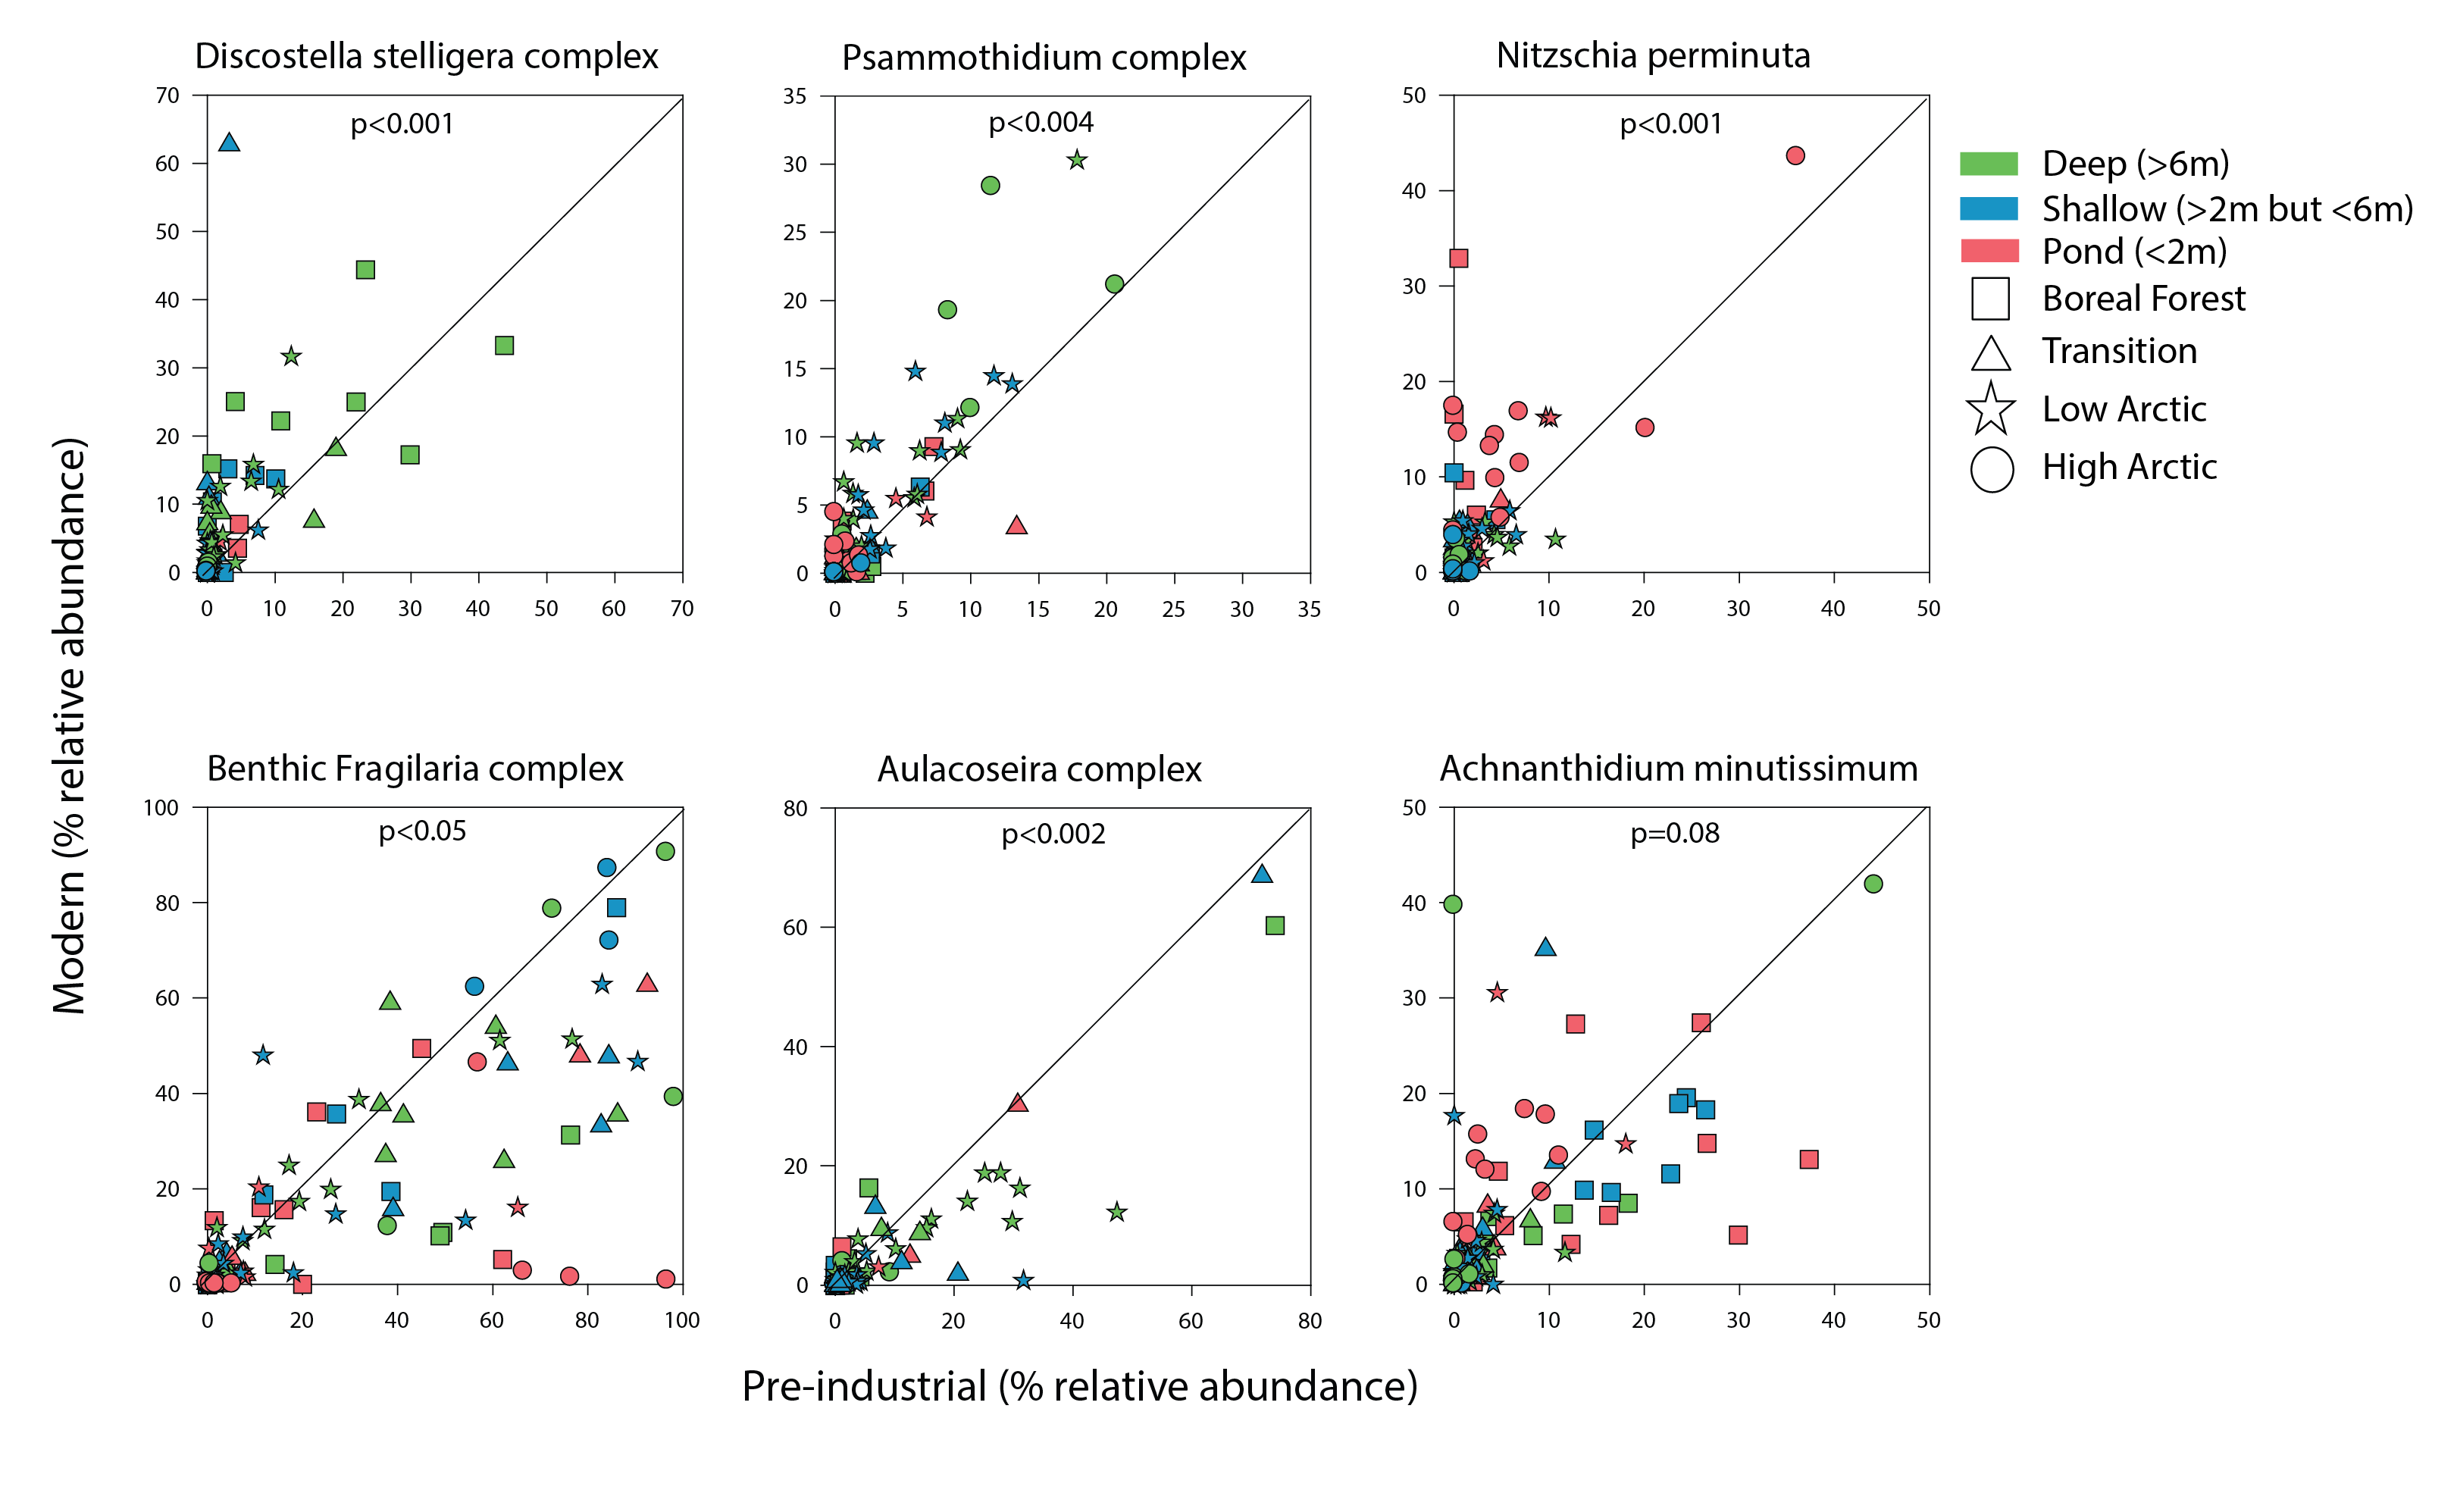
Figure 4 15 Comparison of the relative abundance of select diatom taxonomic groups between core bottoms (pre-industrial sediments; x- axis) and core tops (modern sediments; y-axis) with a 1:1 line to indicate whether there were higher abundances in fossil samples (below red line) or modern samples (above red line). State of the Arctic Freshwater Biodiversity Report - Chapter 2 - Page 15 - Figure 2-1
-
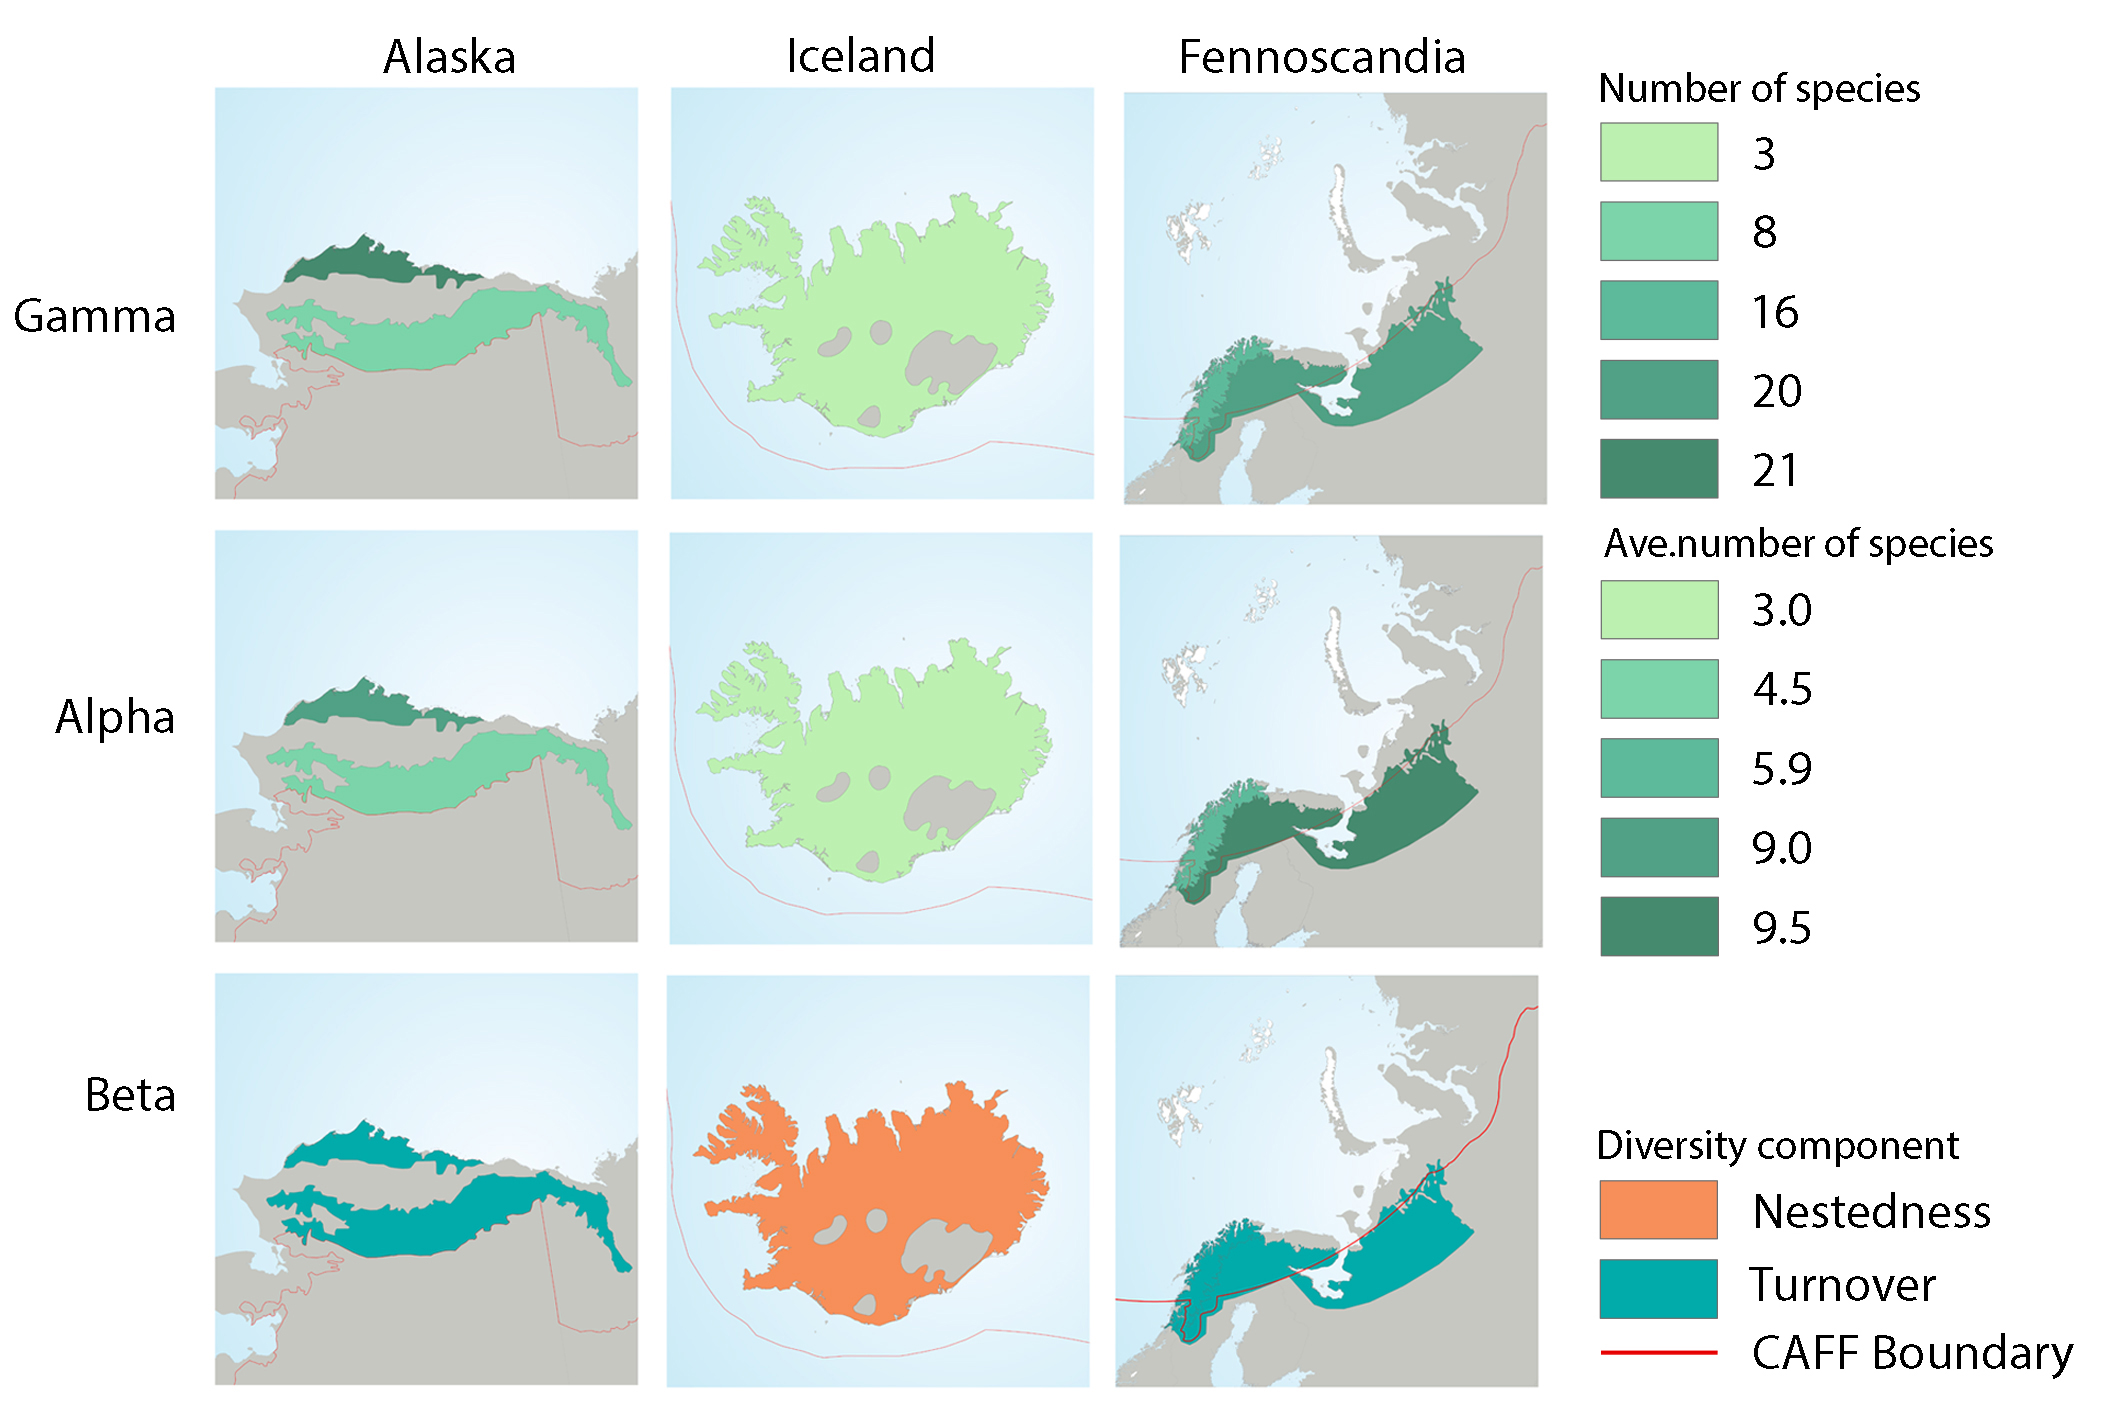
Fish diversity characteristics in three geographical regions: Alaska, Iceland, and Fennoscandia. Gamma diversity is based the total number of species sampled in hydrobasins of each ecoregion. Alpha diversity shows the mean basin species richness (95% confidence interval) and beta diversity shows the component of beta diversity, nestedness or turnover, that dominated within each of the ecoregions; gamma, alpha, and beta diversity estimates were based on a subset of basins where a minimum of 10 stations were sampled. All maps are drawn to the same scale. State of the Arctic Freshwater Biodiversity Report - Chapter 4 - Page 77 - Figure 4-39
-
Results of circumpolar assessment of river benthic macroinvertebrates, indicating (a) the location of river benthic macroinvertebrate stations, underlain by circumpolar ecoregions; (b) ecoregions with many river benthic macroinvertebrate stations, colored on the basis of alpha diversity rarefied to 100 stations; (c) all ecoregions with river benthic macroinvertebrate stations, colored on the basis of alpha diversity rarefied to 10 stations; (d) ecoregions with at least two stations in a hydrobasin, colored on the basis of the dominant component of beta diversity (species turnover, nestedness, approximately equal contribution, or no diversity) when averaged across hydrobasins in each ecoregion. State of the Arctic Freshwater Biodiversity Report - Chapter 4 - Page 67 - Figure 4-30
-
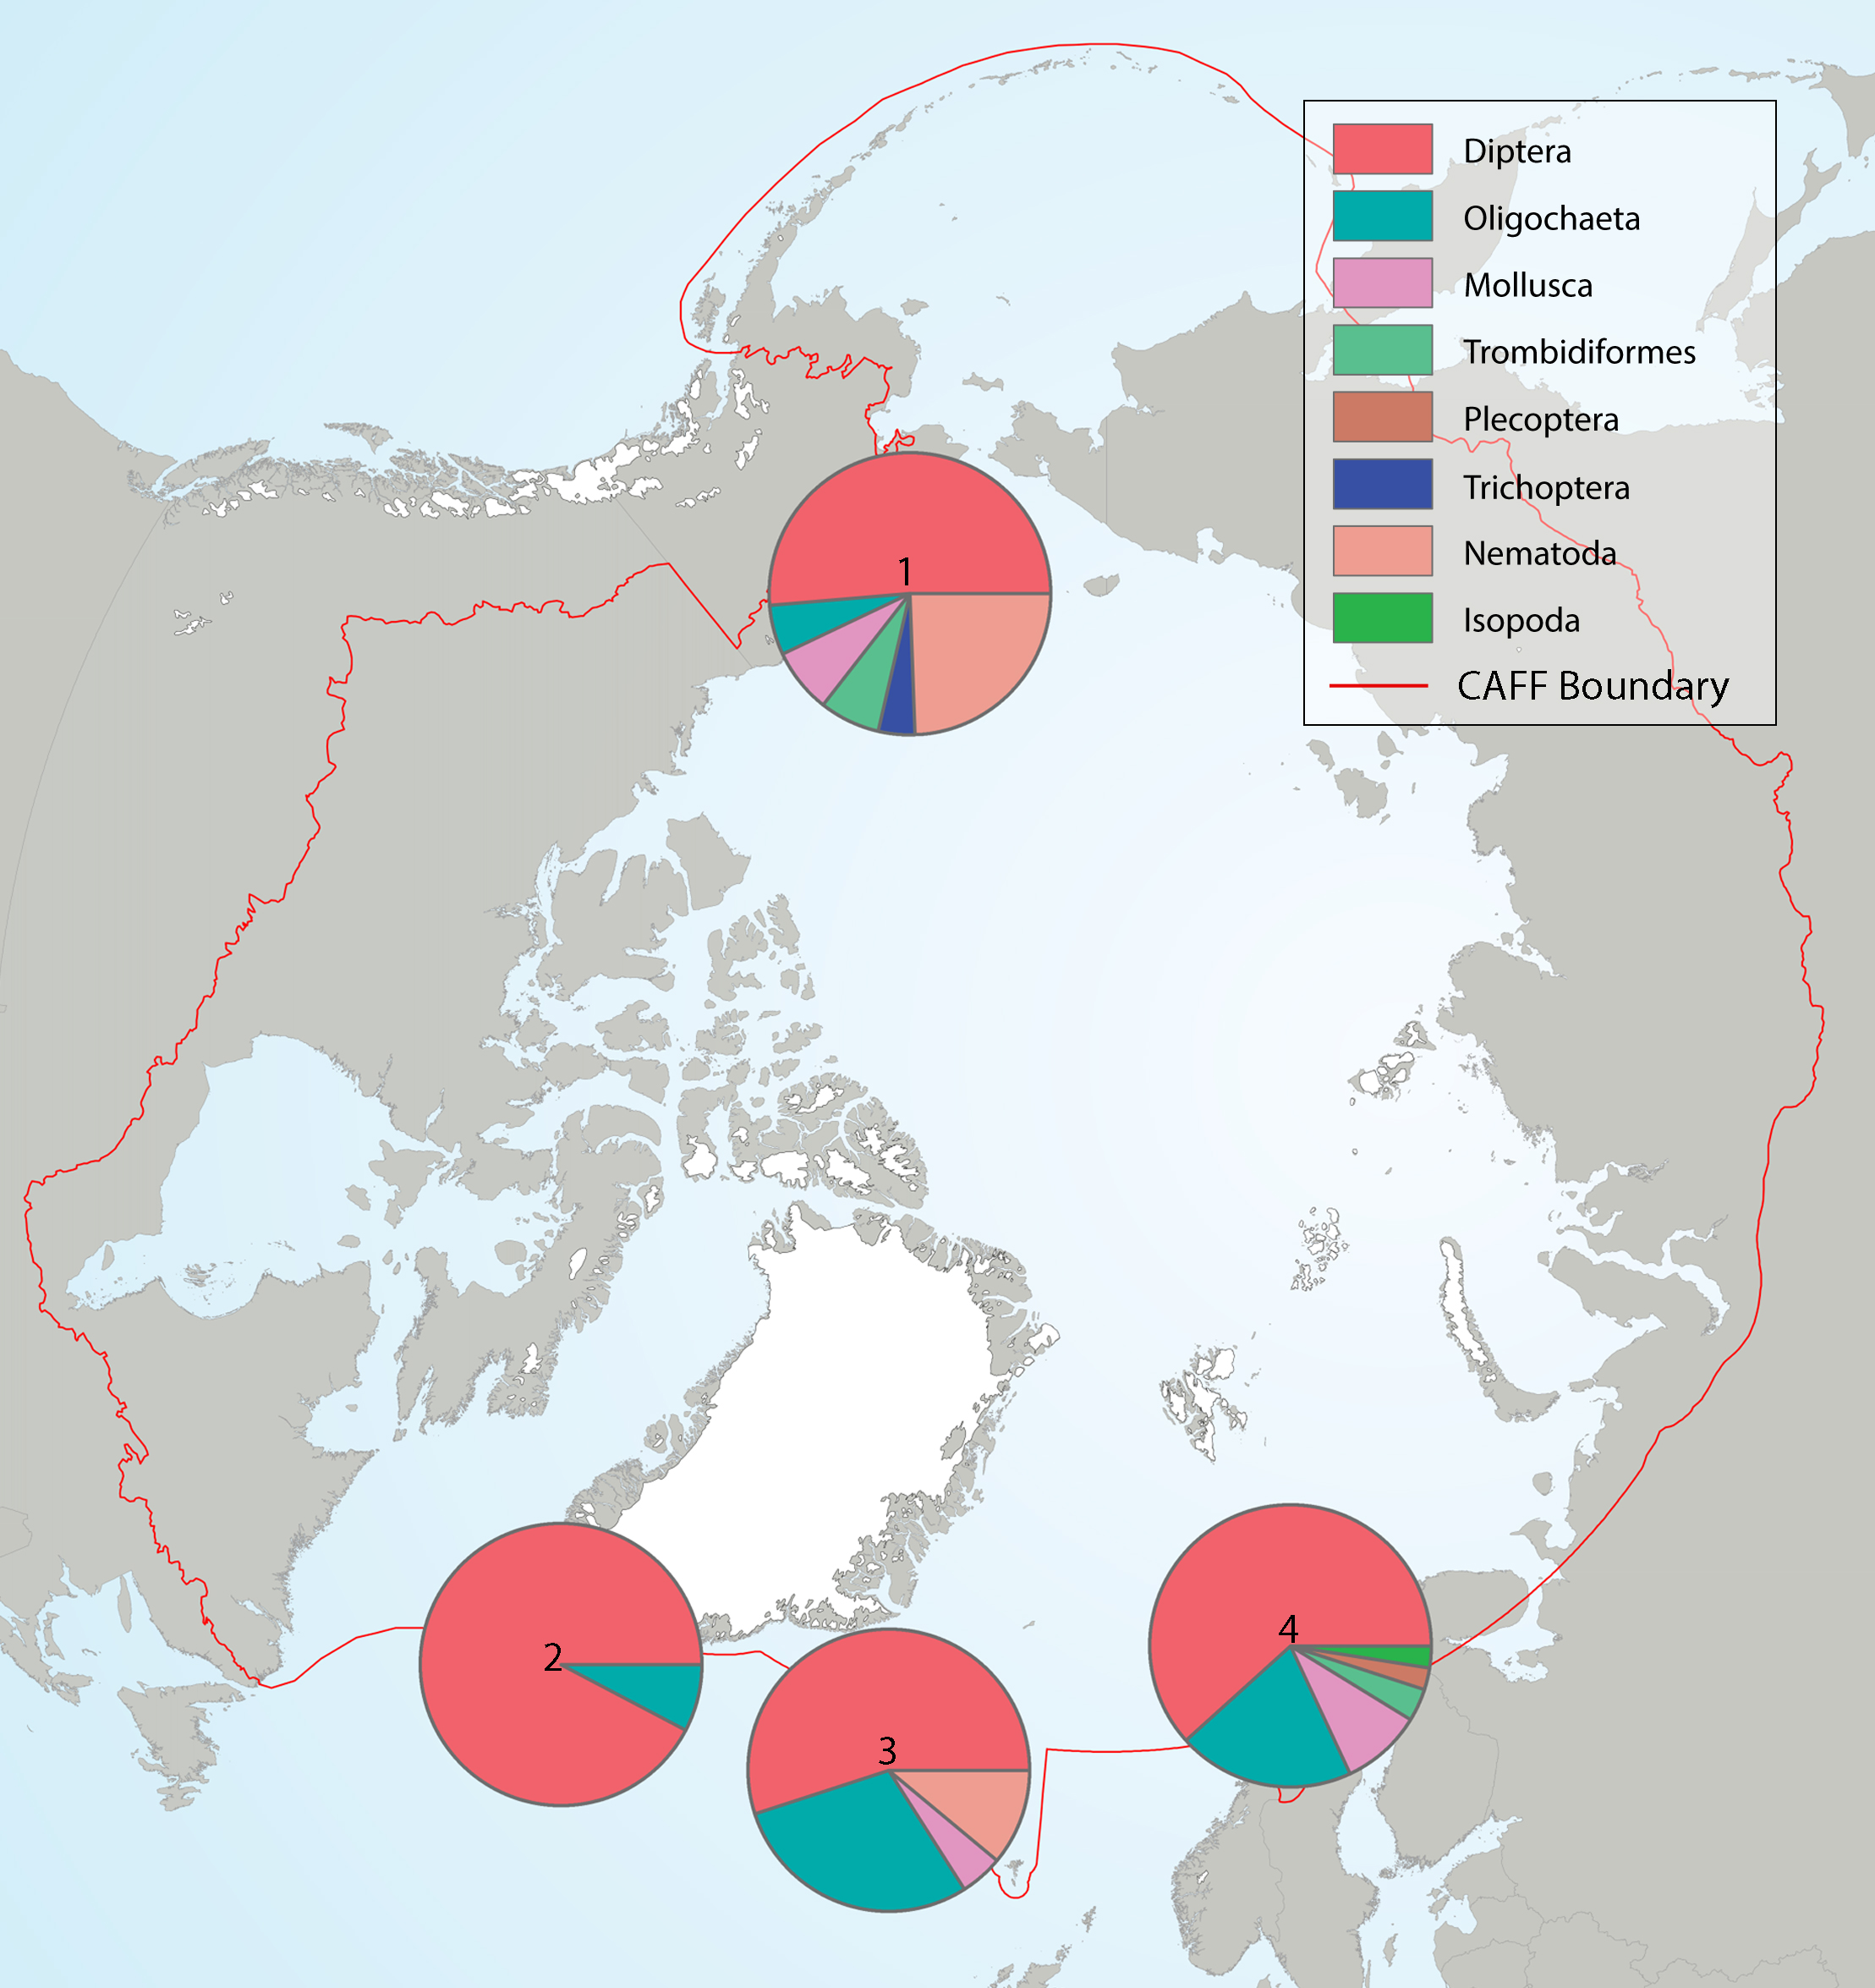
Summary of the taxa accounting for 85% of the lake littoral benthic macroinvertebrates collected in each of several highly-sampled geographic areas, with taxa grouped by order level or higher in pie charts placed spatially to indicate sampling area. Pie charts correspond to (1) Alaska, (2) Greenland low Arctic, (3) Iceland, and (4) Fennoscandia. State of the Arctic Freshwater Biodiversity Report - Chapter 4 - Page 69 - Figure 4-33