 CAFF - Arctic Biodiversity Data Service (ABDS)
Land use
Type of resources
Available actions
Topics
Keywords
Contact for the resource
Provided by
Years
Representation types
Update frequencies
status
-
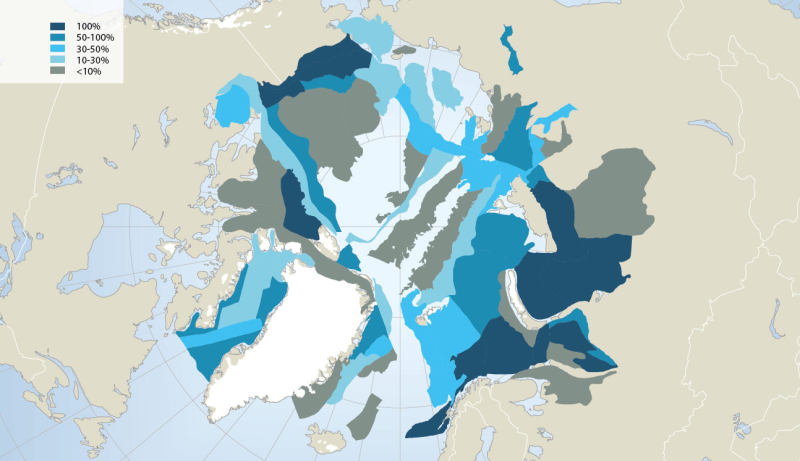
Extensive oil and gas activity has occurred in the Arctic, primarily land-based, with Russia extracting 80% of the oil and 99% of the gas to date (AMAP 2008). Furthermore, the Arctic still contains large petroleum hydrocarbon reserves and potentially holds one fifth of the world’s yet undiscovered resources, according to the US Geological Survey (USGS 2008) (Fig. 14.4). While much of the currently known Arctic oil and gas reserves are in Russia (75% of oil and 90% of gas; AMAP 2008), more than half of the estimated undiscovered Arctic oil reserves are in Alaska (offshore and onshore), the Amerasian Basin (offshore north of the Beaufort Sea) and in W and E Greenland (offshore). More than 70% of the Arctic undiscovered natural gas is estimated to be located in the W Siberian Basin (Yamal Peninsula and offshore in the Kara Sea), the E Barents Basin and in Alaska (offshore and onshore) (AMSA 2009). Associated with future exploration and development, each of these regions would require vastly expanded Arctic marine operations, and several regions such as offshore Greenland would require fully developed Arctic marine transport systems to carry hydrocarbons to global markets. In this context, regions of high interest for economic development face cumulative environmental pressure from anthropogenic activities such as hydrocarbon exploitation locally, together with global changes associated with climatic and oceanographic trends. Conservation of Arctic Flora and Fauna, CAFF 2013 - Akureyri . Arctic Biodiversity Assessment. Status and Trends in Arctic biodiversity. - Marine ecosystems (Chapter 14 - page 501). Figure adapted from the USGS
-

Geographic area covered by the Arctic Biodiversity Assessment and the CBMP–Terrestrial Plan. Subzones A to E are depicted as defined in the Circumpolar Arctic Vegetation Map (CAVM Team 2003). Subzones A, B and C are the high Arctic while subzones D and E are the low Arctic. Definition of high Arctic, low Arctic, and sub-Arctic follow Hohn & Jaakkola 2010. STATE OF THE ARCTIC TERRESTRIAL BIODIVERSITY REPORT - Chapter 1 - Page 14 - Figure 1.2
-

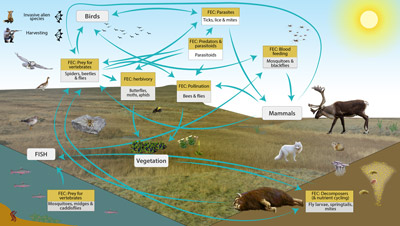
The Arctic terrestrial food web includes the exchange of energy and nutrients. Arrows to and from the driver boxes indicate the relative effect and counter effect of different types of drivers on the ecosystem. STATE OF THE ARCTIC TERRESTRIAL BIODIVERSITY REPORT - Chapter 2 - Page 26- Figure 2.4
-

Arctic foxes are currently monitored at 34 sites throughout the North, with most monitoring efforts concentrated in Fennoscandia (Figure 3-32). The duration of monitoring across all sites is variable at between 2 and 56 years and was ongoing at 27 of the 34 sites (79%) as of 2015. Monitoring projects cover almost equally the four climate zones of the species’ distribution—high Arctic, low Arctic, sub-Arctic, and montane/alpine. STATE OF THE ARCTIC TERRESTRIAL BIODIVERSITY REPORT - Chapter 3 - Page 82 - Figure 3.32
-
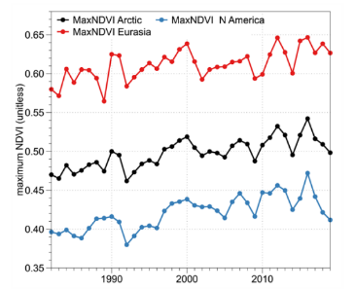
Circumpolar trends in primary productivity as indicated by the maximum Normalised Difference Vegetation Index, 1982–2017. (a) Brown shading indicates negative MaxNDVI trends, green shading indicates positive MaxNDVI trends. (b) Chart of trends for the circumpolar Arctic, Eurasia, and North America. Modified from Frost et al. 2020. STATE OF THE ARCTIC TERRESTRIAL BIODIVERSITY REPORT - Chapter 3 - Page 30 - Figure 3.1
-

Trends and distribution of muskoxen populations based on Table 3-5. Modified from Cuyler et al. 2020. STATE OF THE ARCTIC TERRESTRIAL BIODIVERSITY REPORT - Chapter 3 - Page 79 - Figure 3.30
-
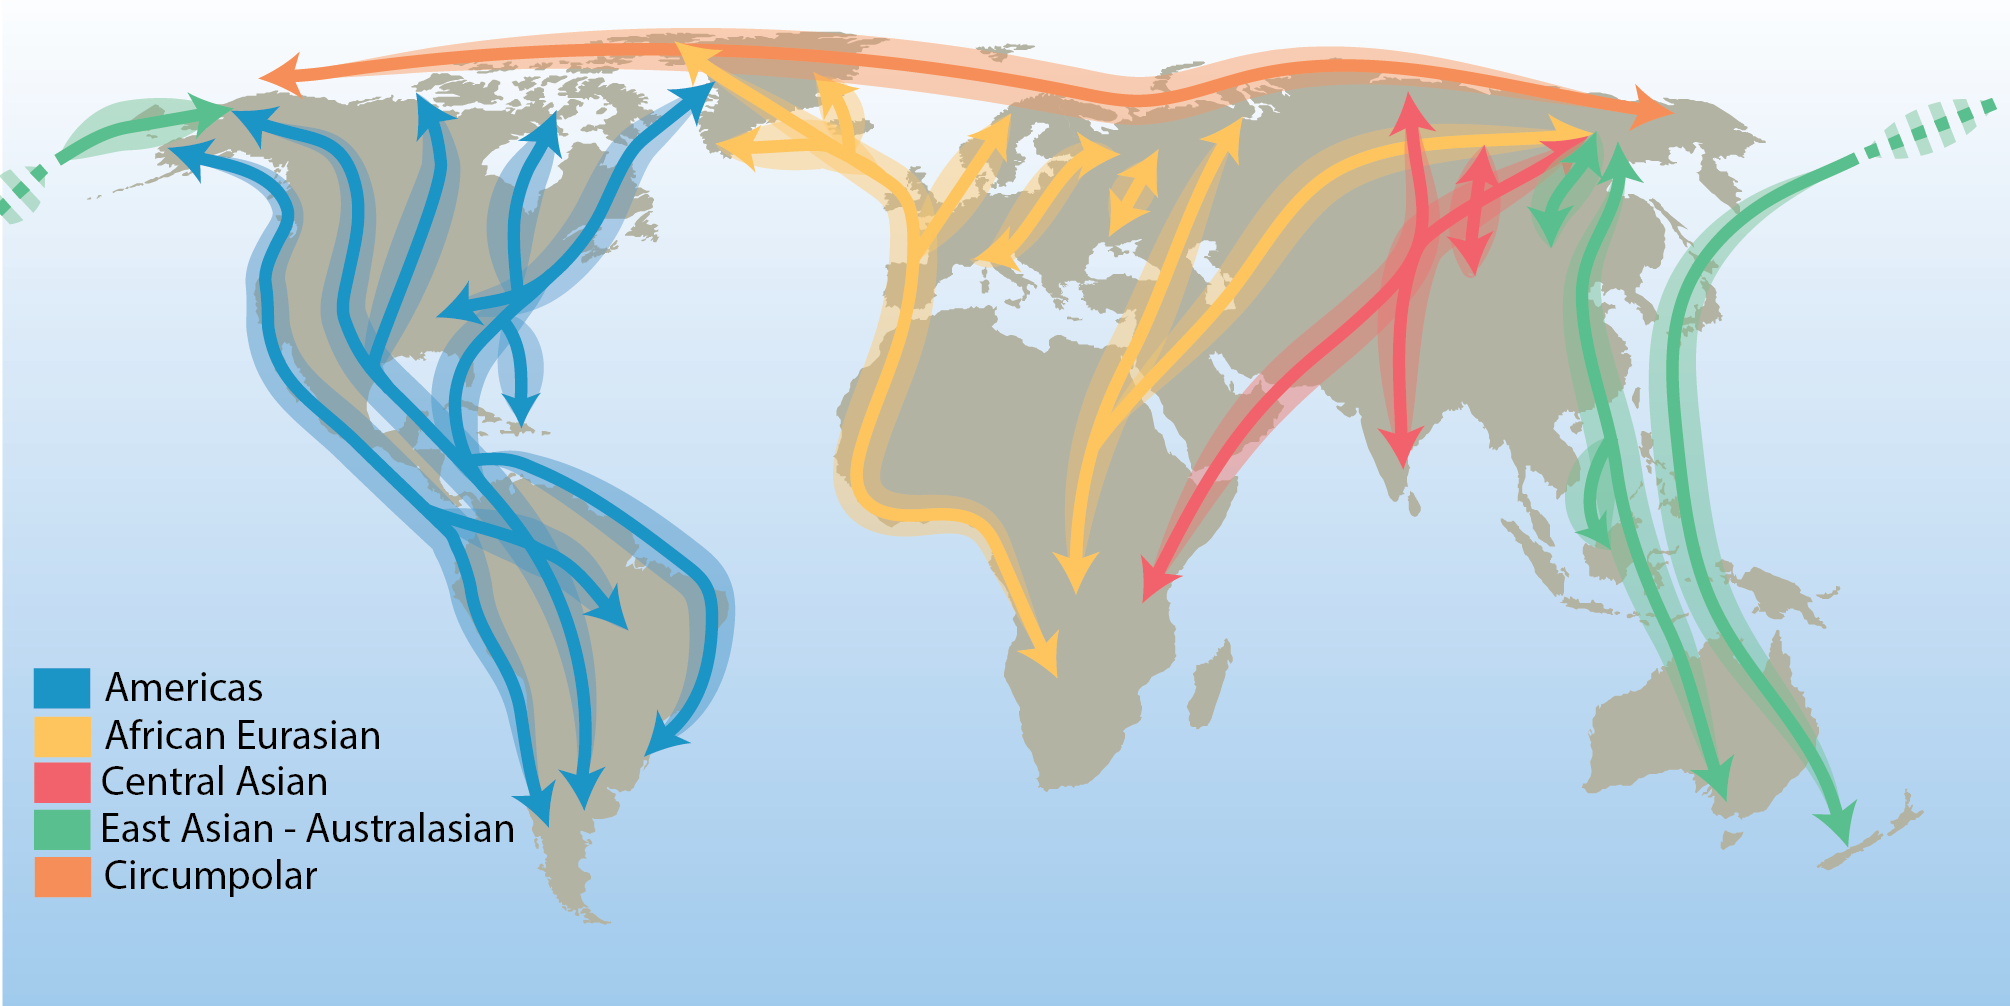
There are few true Arctic specialist birds that remain in the Arctic throughout their annual cycle. They include the willow and rock ptarmigan (Lagopus lagopus and L. muta), gyrfalcon (Falco rusticolus), snowy owl (Bubo scandiacus), Arctic redpoll (Carduelis hornemanni) and northern raven (Corvus corax)—a cosmopolitan species with resident populations in the Arctic. All other terrestrial Arctic-breeding bird species migrate to warmer regions during the northern winter, connecting the Arctic to all corners of the globe. Hence, their distributions are influenced by the routes they follow. These distinct migration routes are referred to as flyways and are defined by a combination of ecological and political boundaries and differ in spatial scale. The CBMP refers to the traditional four north–south flyways, in addition to a circumpolar flyway representing the few species that remain largely within the Arctic year-round (Figure 3-20). STATE OF THE ARCTIC TERRESTRIAL BIODIVERSITY REPORT - Chapter 3 - Page 48- Figure 3.20
-
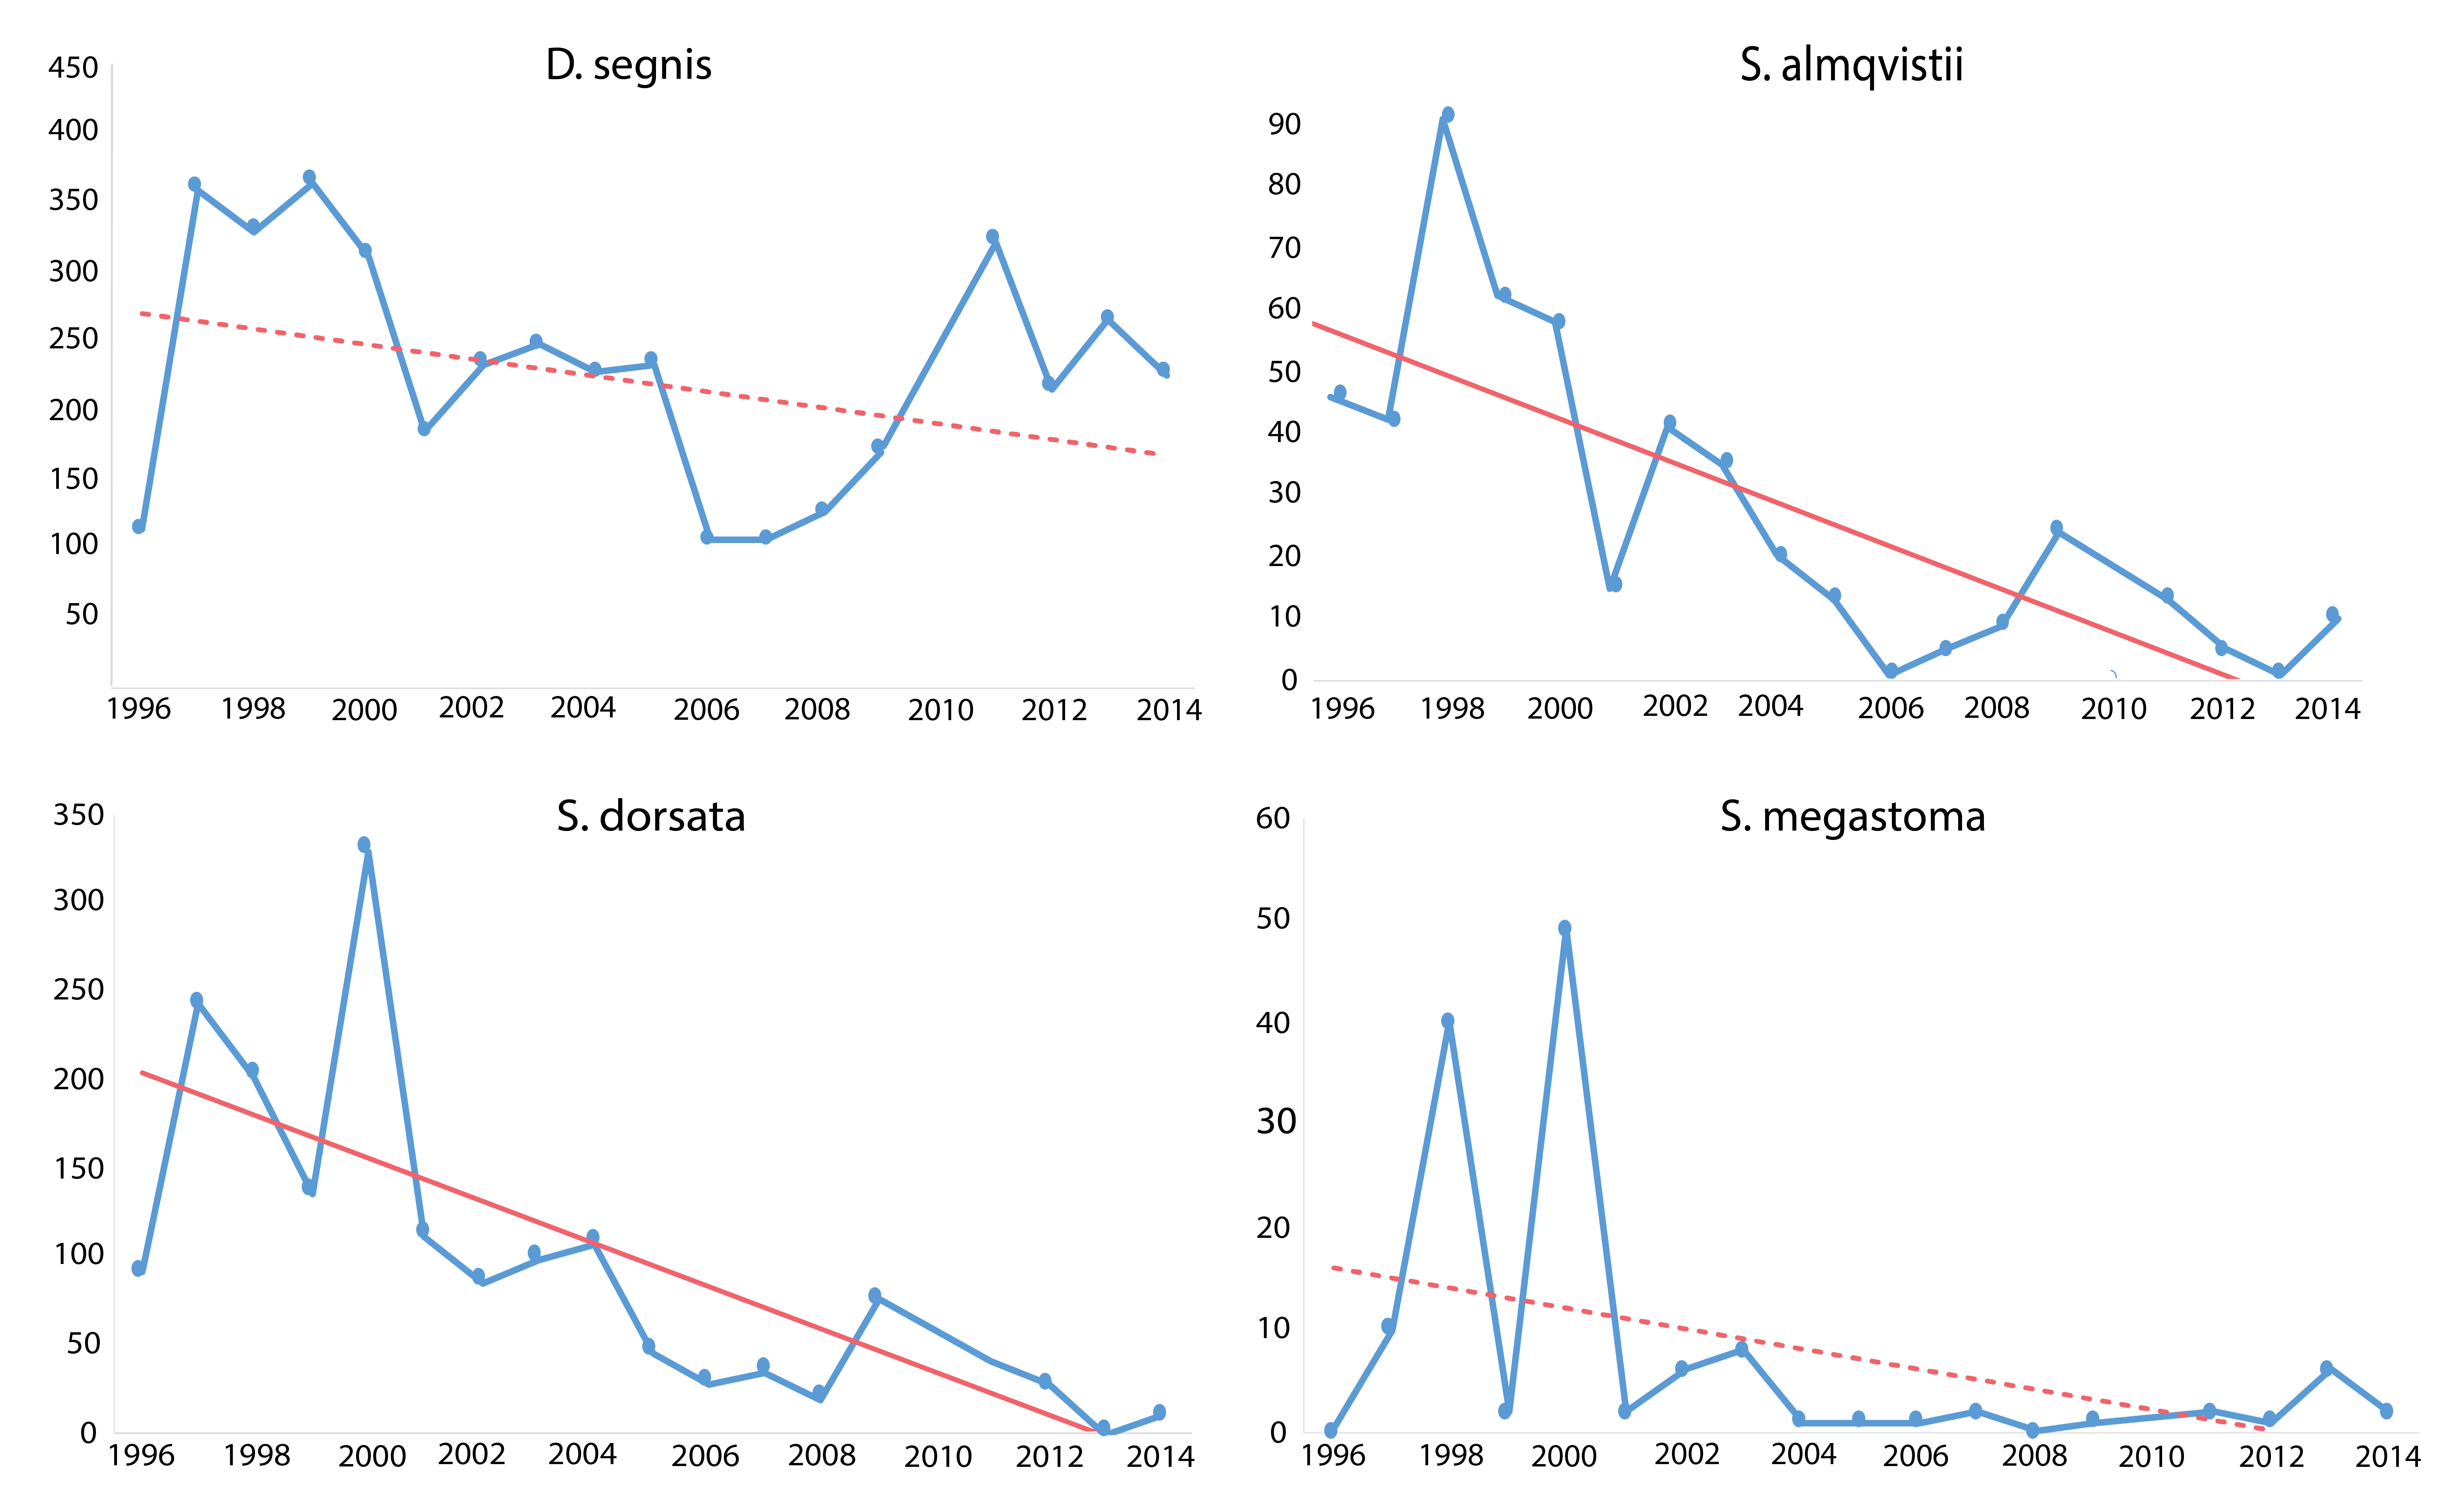
Trends in four muscid species occurring at Zackenberg Research Station, east Greenland, 1996–2014. Declines were detected in several species over five or more years. Significant regression lines drawn as solid. Non-significant as dotted lines. Modified from Gillespie et al. 2020a. (in the original figure six species showed a statistically significant decline, seven a non-significant decline and one species a non-significant rise) STATE OF THE ARCTIC TERRESTRIAL BIODIVERSITY REPORT - Chapter 3 - Page 39 - Figure 3.11
-
Conceptual model of the FECs and processes mediated by more than 2,500 species of Arctic arthropods known from Greenland, Iceland, Svalbard, and Jan Mayen. STATE OF THE ARCTIC TERRESTRIAL BIODIVERSITY REPORT - Chapter 3 - Page 37- Figure 3.7
-
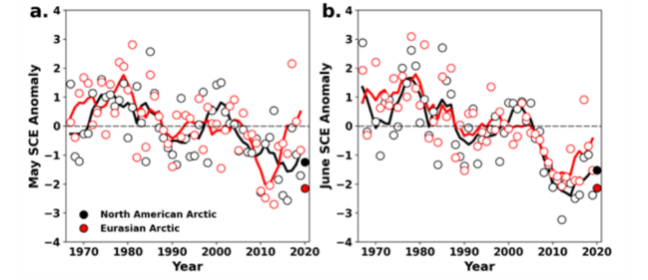
Monthly snow cover extent (SCE) for Arctic land areas (>60° N) for (a) May and (b) June 1967–2020, a 54-year record. Anomalies are relative to the 1981–2010 average and standardised (each observation was differenced from the mean and divided by the standard deviation, and thus unitless). Solid black and red lines depict 5-year running means for North America and Eurasia, respectively. Filled circles are used to highlight 2020 anomalies. (Mudryk et al. 2020). STATE OF THE ARCTIC TERRESTRIAL BIODIVERSITY REPORT - Chapter 2 - Page 23 - Figure 2.3