 CAFF - Arctic Biodiversity Data Service (ABDS)
unknown
Type of resources
Available actions
Topics
Keywords
Contact for the resource
Provided by
Years
Formats
Representation types
Update frequencies
status
Scale
-
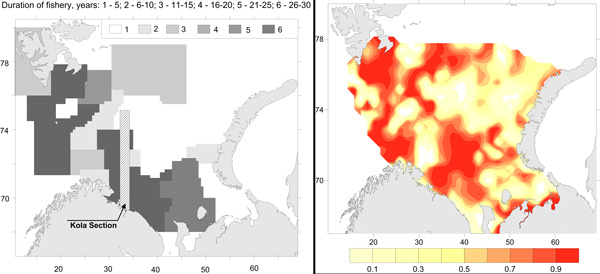
Commercial fishery impact on zoobenthos of the Barents Sea. Figure A) Intensity and duration of fishery efforts in standard commercial fishery areas in the Barents Sea. The darker the area the longer the fishery has been in operation. Figure B) Level of decline in macrobenthic biomass between 1926-1932 and 1968-1970 calculated as 1-b1968/b1930. The largest biomass decreases correspond to the darker colour, whereas lighter colour refers to no change (Denisenko 2013). STATE OF THE ARCTIC MARINE BIODIVERSITY REPORT - <a href="https://arcticbiodiversity.is/findings/benthos" target="_blank">Chapter 3</a> - Page 97 - Figure 3.3.4
-
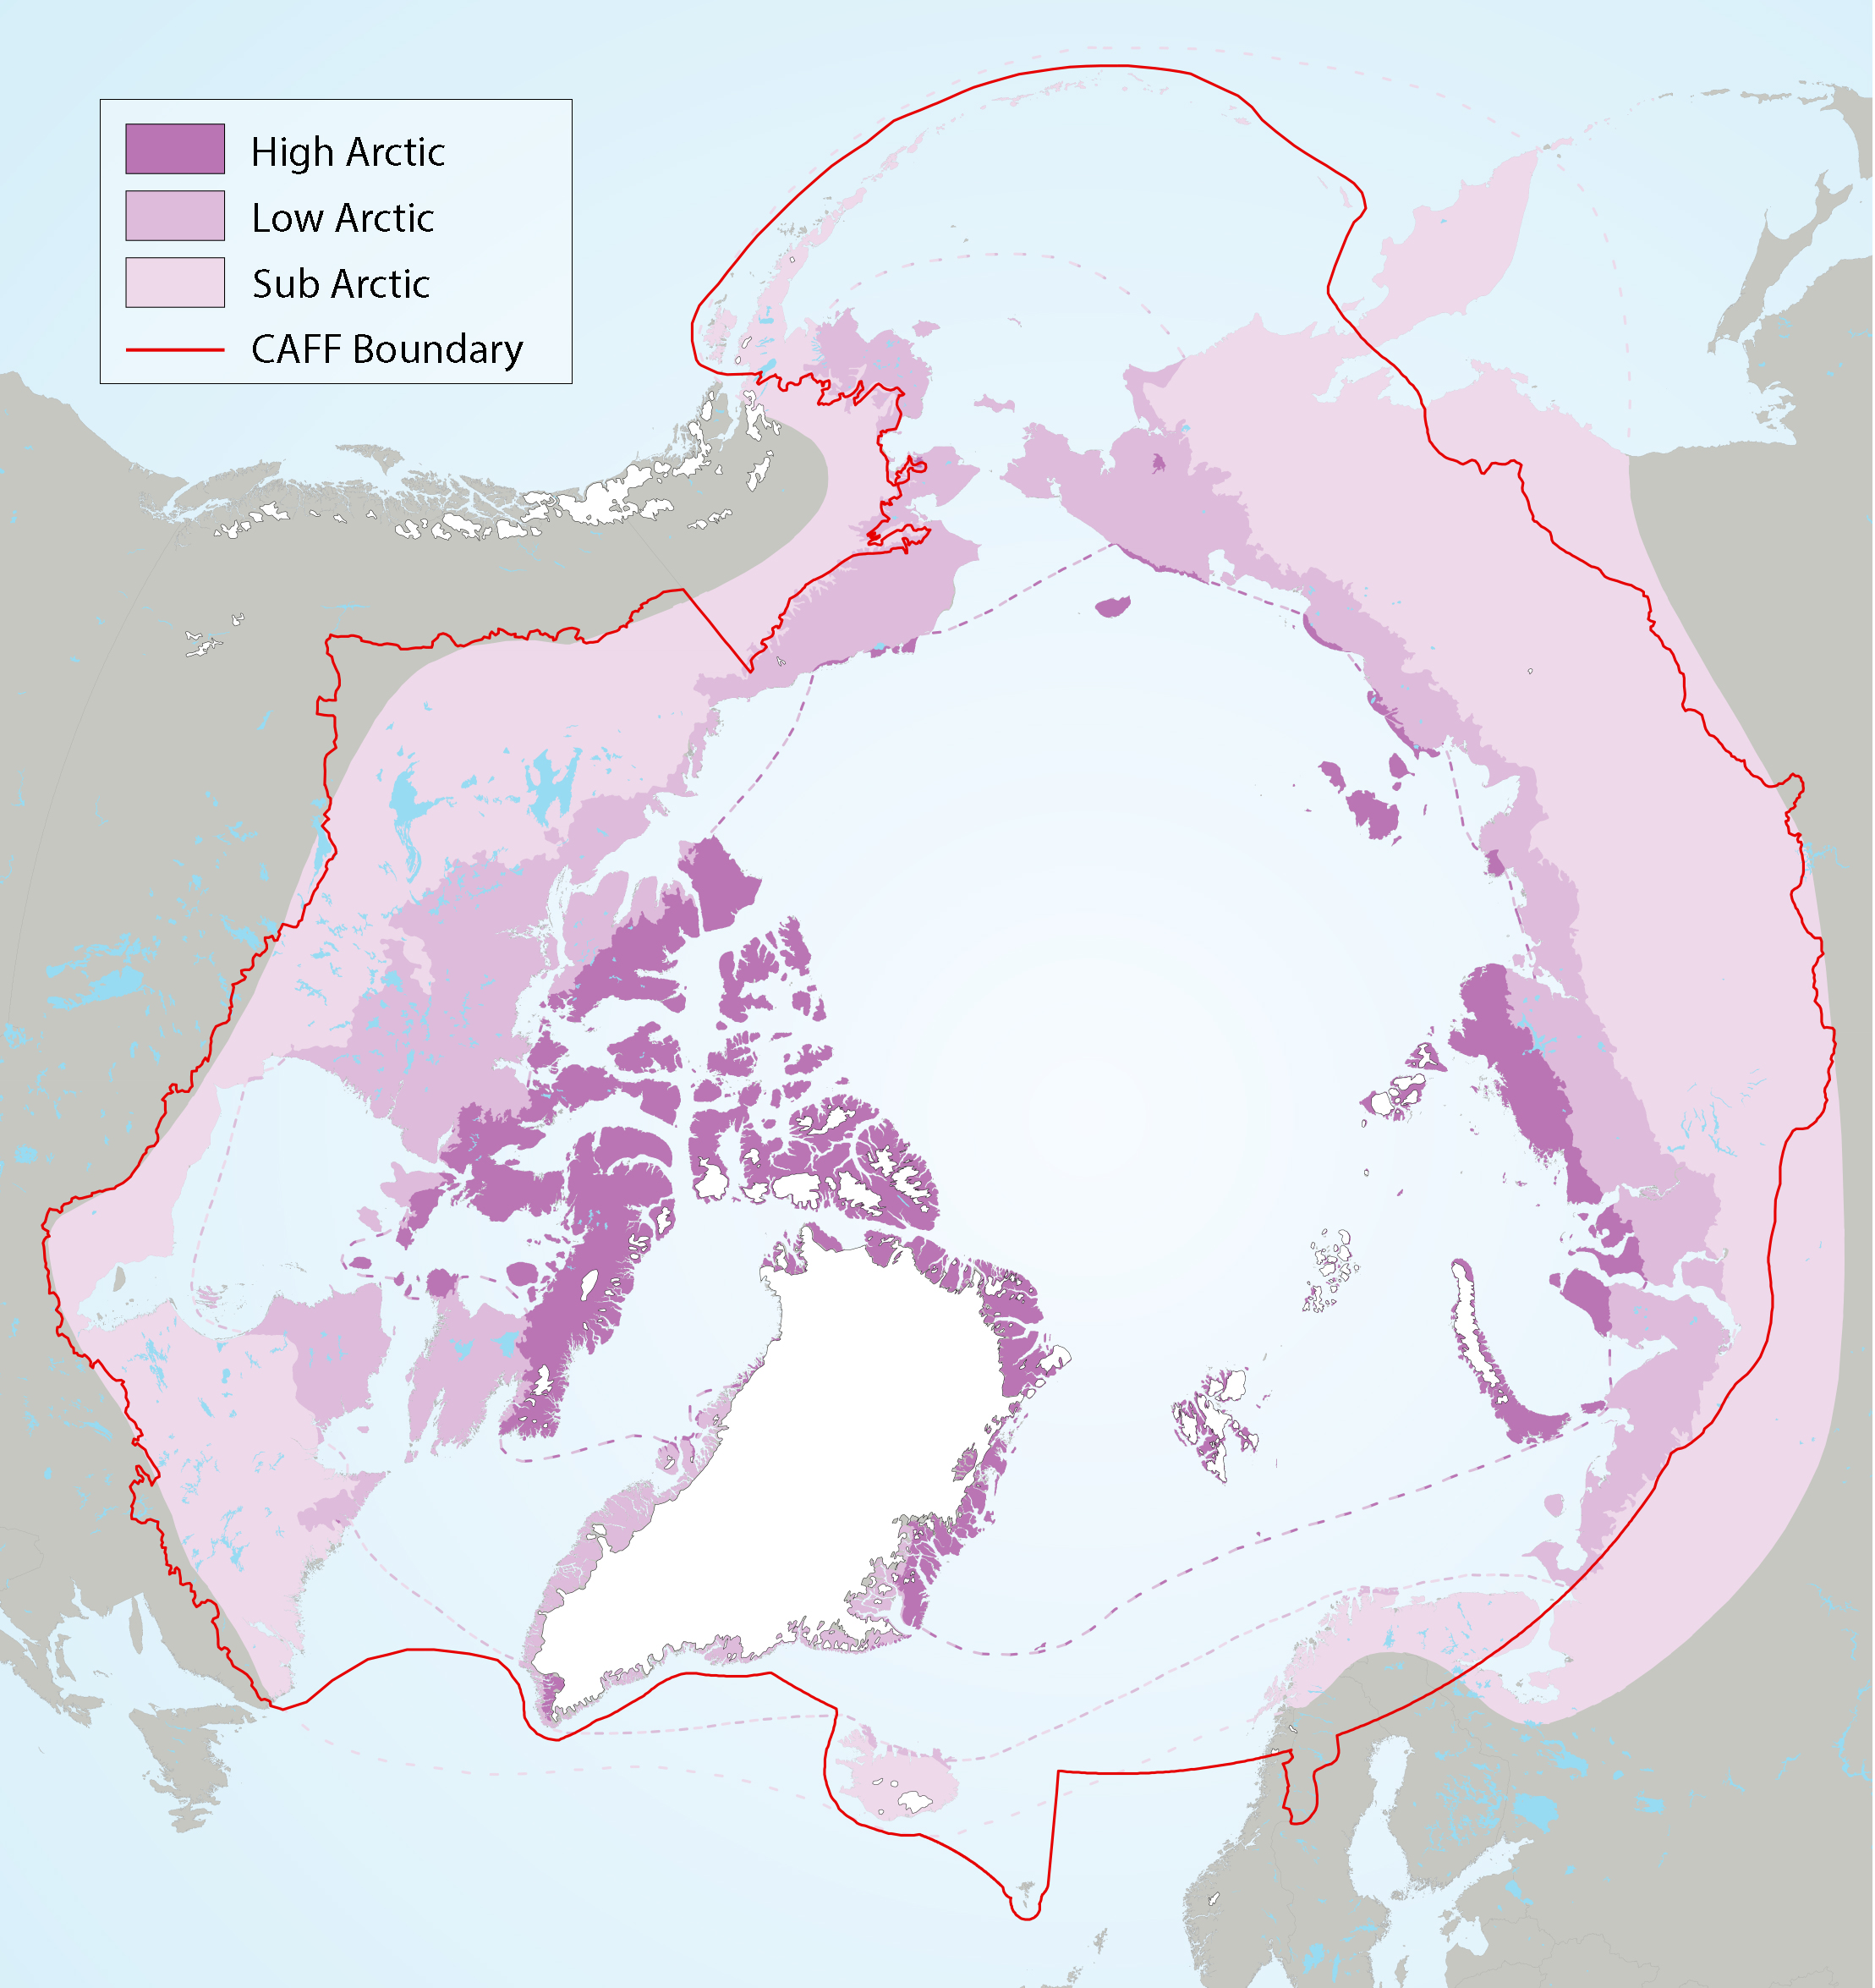
Figure 2-2 Arctic freshwater boundaries from the Arctic Council’s Arctic Biodiversity Assessment developed by CAFF, showing the three sub-regions of the Arctic, namely the high (dark purple), low (purple) and sub-Arctic (light purple)
-
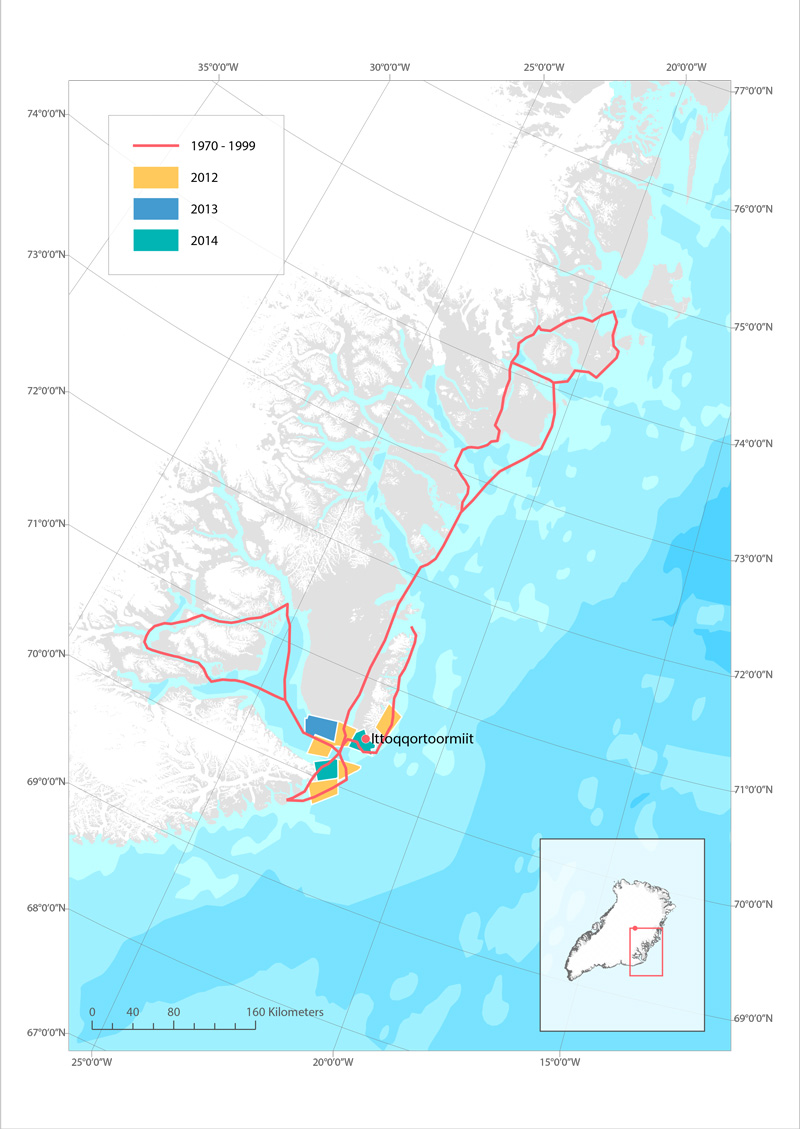
Routes used for hunting polar bear in Ittoqqoortoormiit, East Greenland before 1999 (red line), and in 2012 (yellow), 2013 (blue) and 2014 (green). STATE OF THE ARCTIC MARINE BIODIVERSITY REPORT - <a href="https://arcticbiodiversity.is/findings/marine-mammals" target="_blank">Chapter 3</a> - Page 159 - Box figure 3.6.1
-
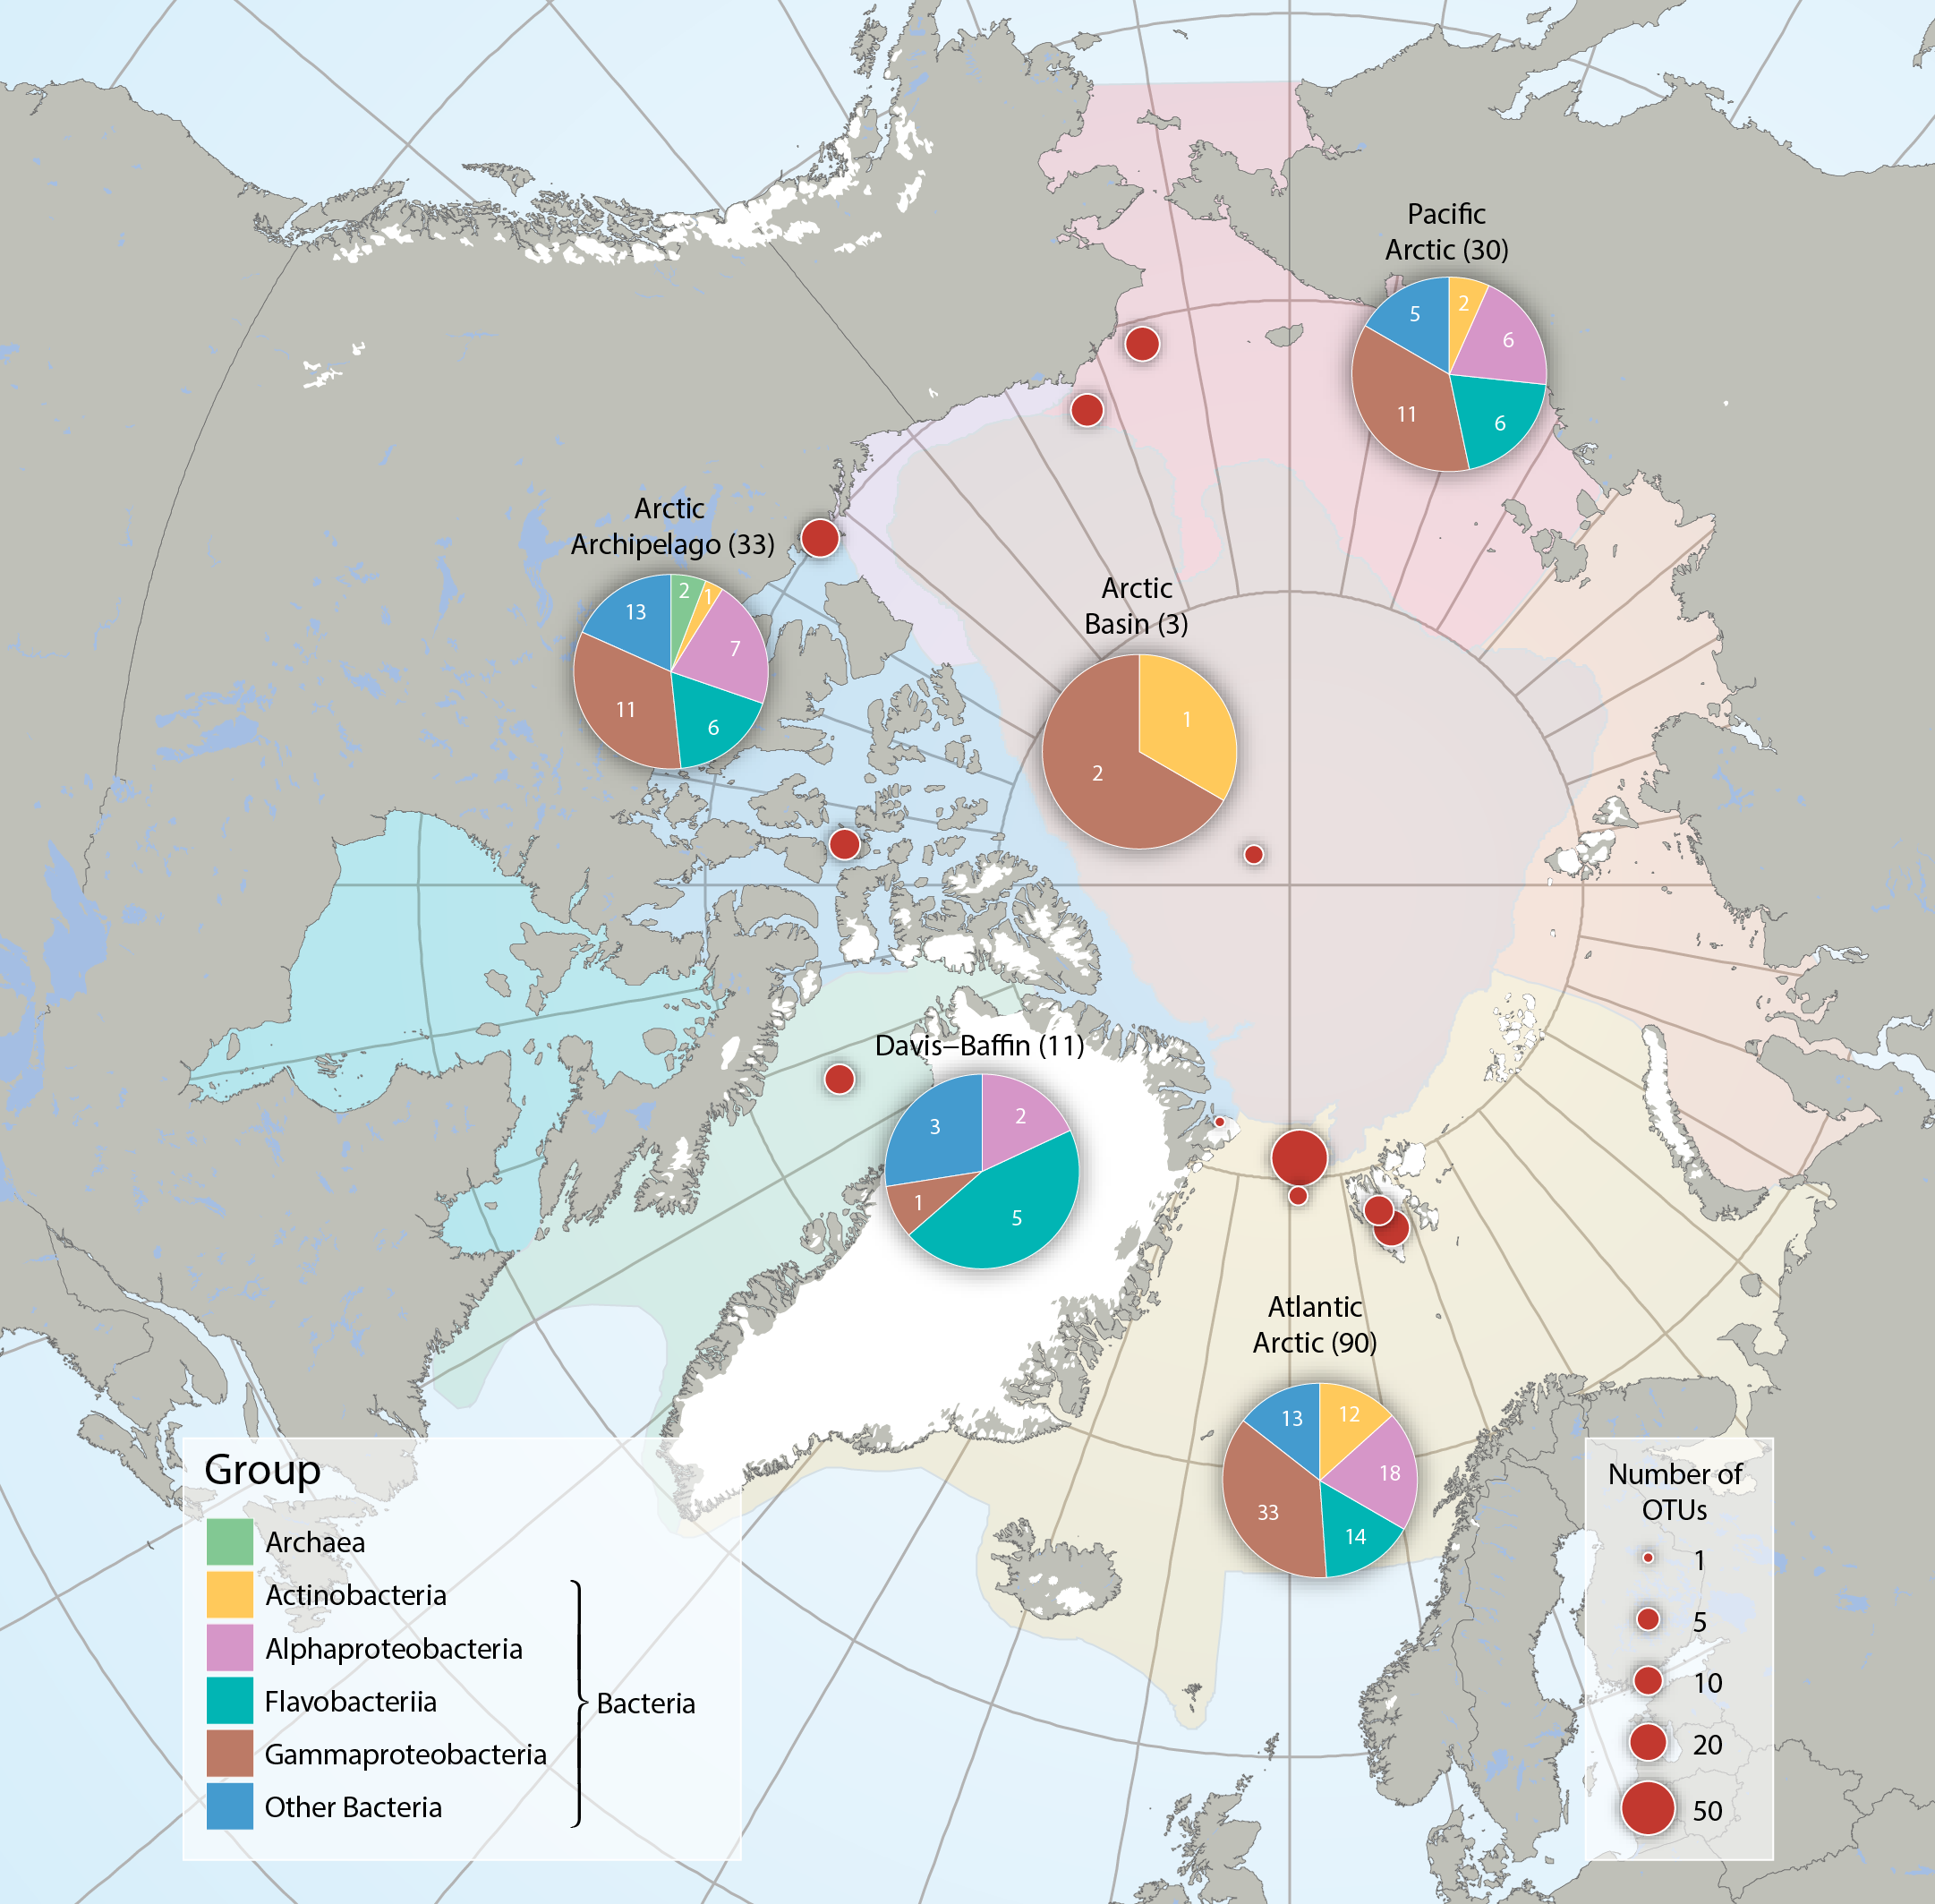
Bacteria and Archaea across five Arctic Marine Areas based on number of operational taxonomic units (OTUs), or molecular species. Composition of microbial groups, with respective numbers of OTUs (pie charts) and number of OTUs at sampling locations (red dots). Data aggregated by the CBMP Sea Ice Biota Expert Network. Data source: National Center for Biotechnology Information’s (NCBI 2017) Nucleotide and PubMed databases. STATE OF THE ARCTIC MARINE BIODIVERSITY REPORT - <a href="https://arcticbiodiversity.is/findings/sea-ice-biota" target="_blank">Chapter 3</a> - Page 38 - Figure 3.1.2 From the report draft: "Synthesis of available data was performed by using searches conducted in the National Center for Biotechnology Information’s “Nucleotide” (http://www.ncbi.nlm.nih.gov/guide/data-software/) and “PubMed” (http://www.ncbi.nlm.nih.gov/pubmed) databases. Aligned DNA sequences were downloaded and clustered into OTUs by maximum likelihood phylogenetic placement."
-
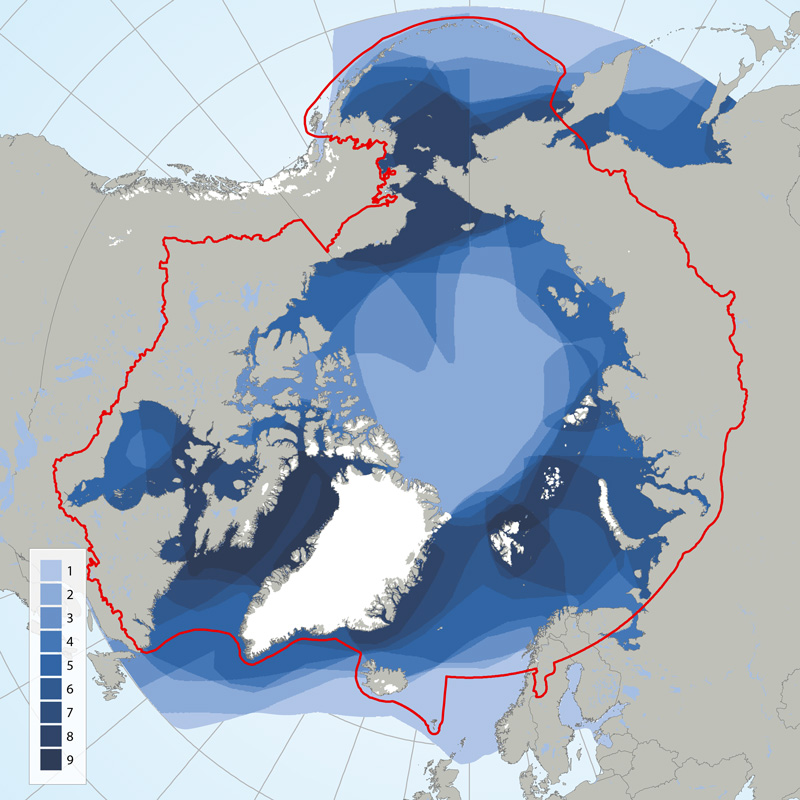
Circumpolar depiction of species richness based on the distributions of the 11 ice-associated Focal Ecosystem Components (according to the distributions reported in IUCN Red List species accounts). A maximum of nine species occur in any one geographic location. The Arctic gateways in both the Atlantic and Pacific regions have the highest species diversity. STATE OF THE ARCTIC MARINE BIODIVERSITY REPORT - <a href="https://arcticbiodiversity.is/findings/marine-mammals" target="_blank">Chapter 3</a> - Page 152 - Figure 3.6.1
-
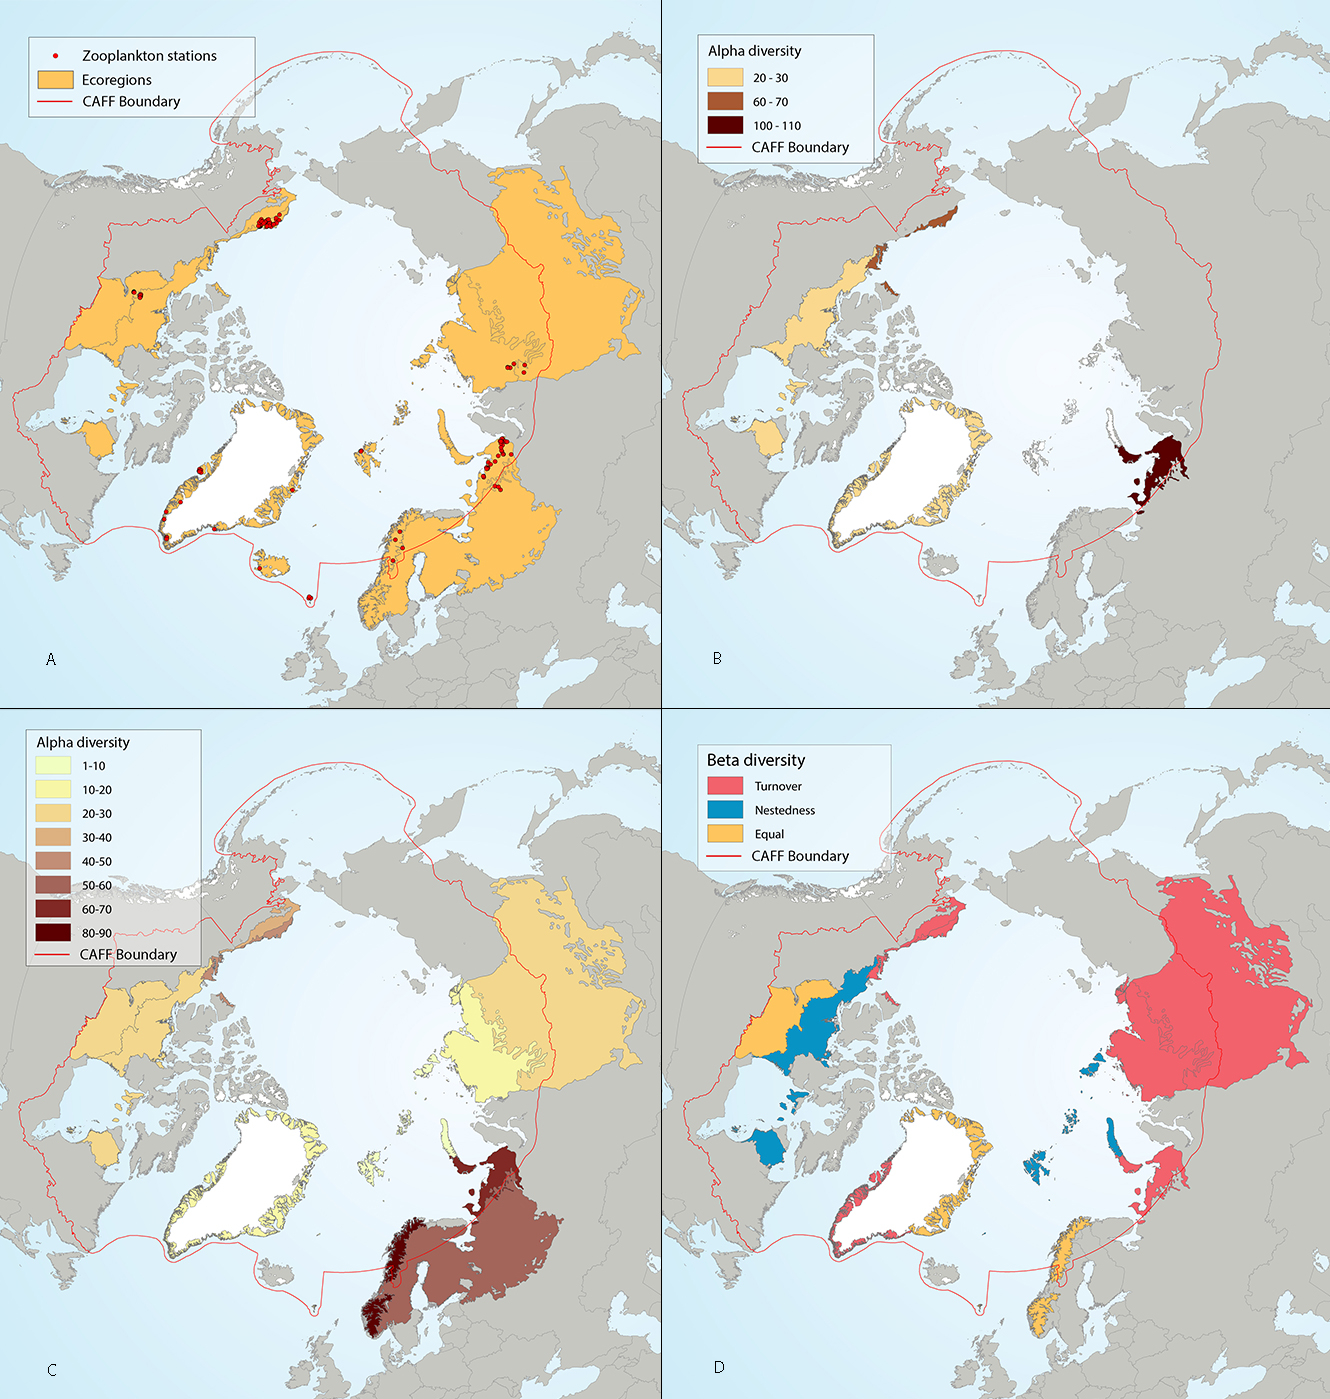
Results of circumpolar assessment of lake zooplankton, including crustaceans and rotifers, and indicating (a) the location of zooplankton stations, underlain by circumpolar ecoregions; (b) ecoregions with many zooplankton stations, colored on the basis of alpha diversity rarefied to 25 stations; (c) all ecoregions with zooplankton stations, colored on the basis of alpha diversity rarefied to 10 stations; (d) ecoregions with at least two stations in a hydrobasin, colored on the basis of the dominant component of beta diversity (species turnover, nestedness, approximately equal contribution, or no diversity) when averaged across hydrobasins in each ecoregion. State of the Arctic Freshwater Biodiversity Report - Chapter 4- Page 59 - Figure 4-26
-

Arctic foxes are currently monitored at 34 sites throughout the North, with most monitoring efforts concentrated in Fennoscandia (Figure 3-32). The duration of monitoring across all sites is variable at between 2 and 56 years and was ongoing at 27 of the 34 sites (79%) as of 2015. Monitoring projects cover almost equally the four climate zones of the species’ distribution—high Arctic, low Arctic, sub-Arctic, and montane/alpine. STATE OF THE ARCTIC TERRESTRIAL BIODIVERSITY REPORT - Chapter 3 - Page 82 - Figure 3.32
-
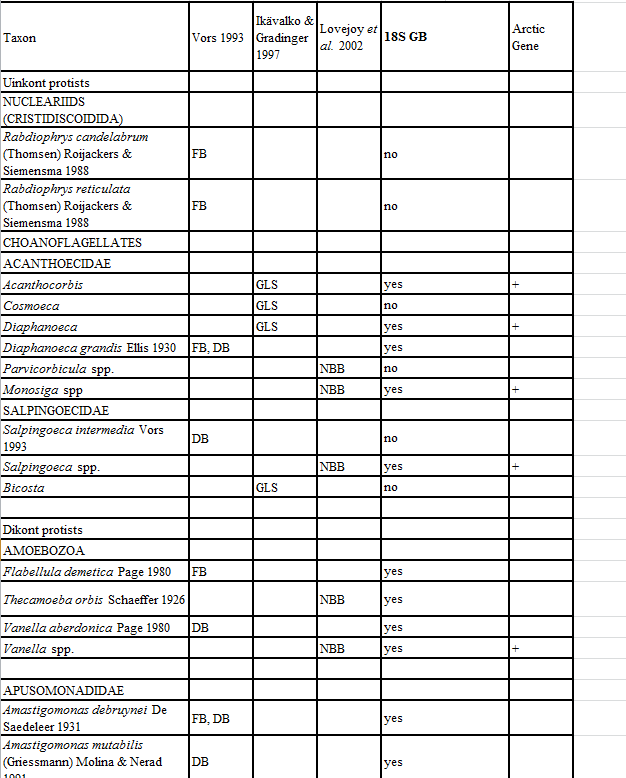
Appendix 11. Taxa of hetorotrophic protists reported from Foxe Basin, Canada (FB), Disko Bay, W Greenland (DB; Vors 1993), the Greenland Sea (GLS; Ikävalko & Gradinger 1997) and Northern Baffin Bay, Canada (NBB; Lovejoy et al. 2002).
-
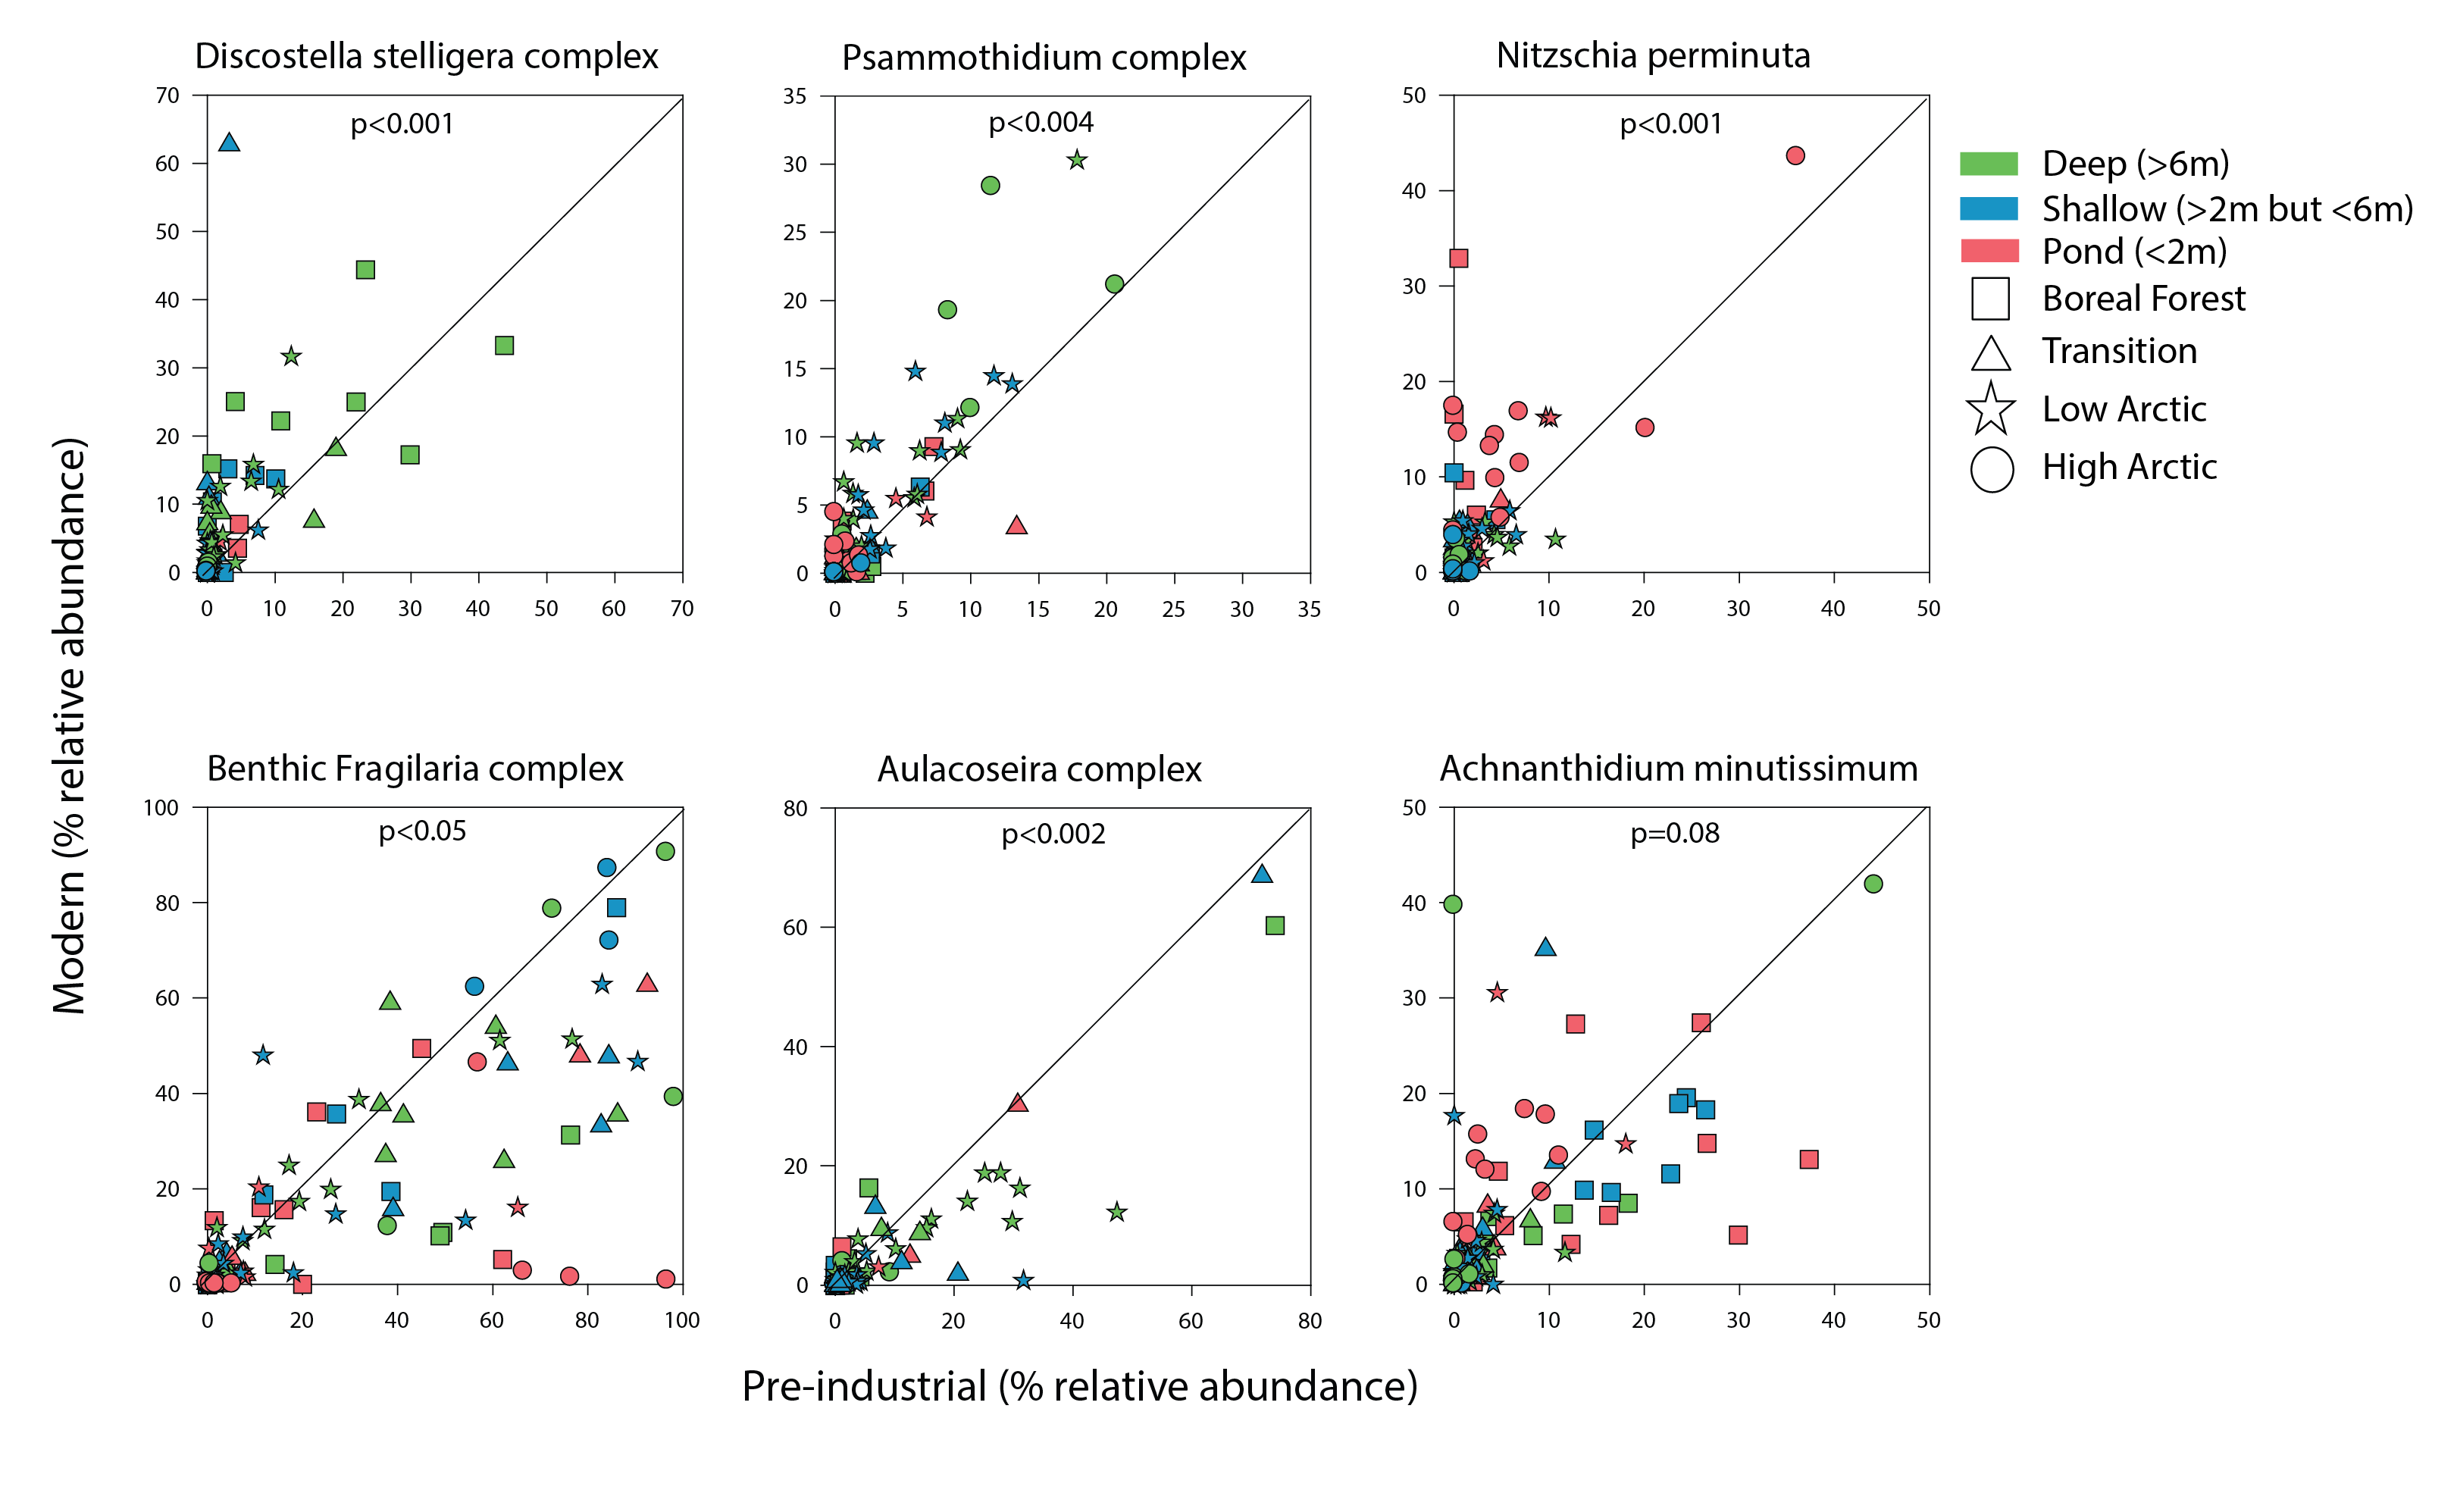
Figure 4 15 Comparison of the relative abundance of select diatom taxonomic groups between core bottoms (pre-industrial sediments; x- axis) and core tops (modern sediments; y-axis) with a 1:1 line to indicate whether there were higher abundances in fossil samples (below red line) or modern samples (above red line). State of the Arctic Freshwater Biodiversity Report - Chapter 2 - Page 15 - Figure 2-1
-
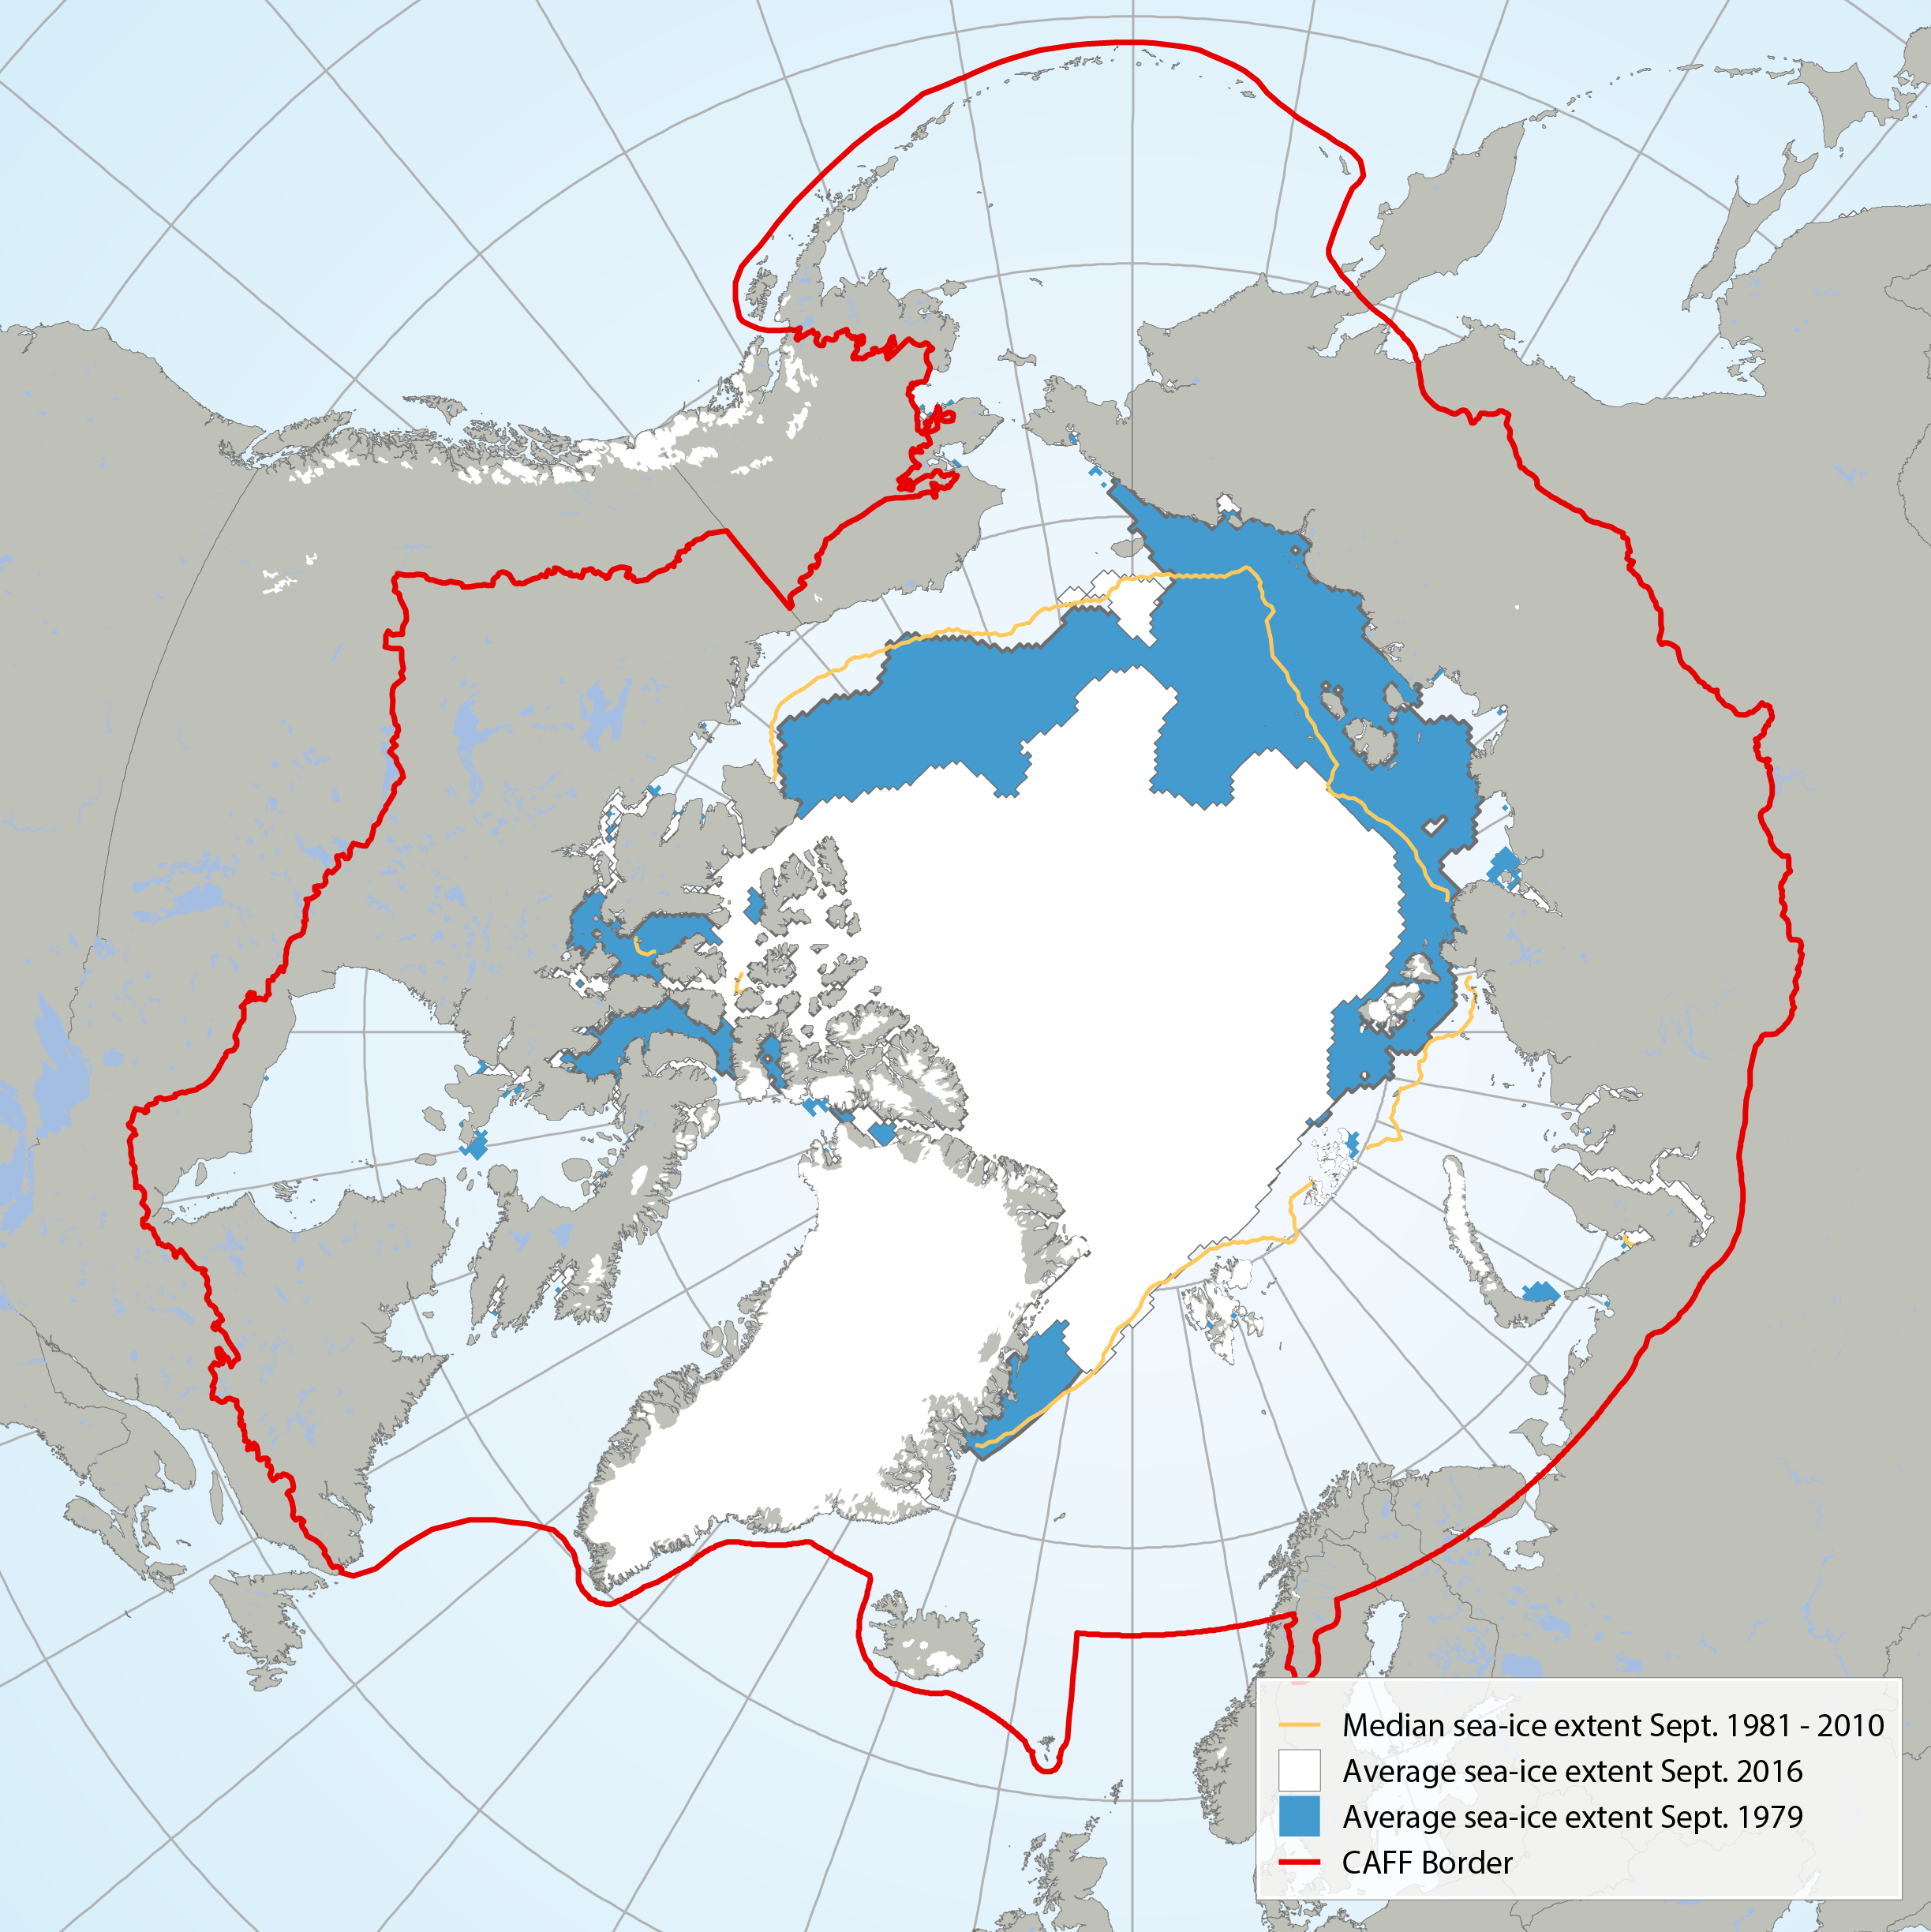
Average September sea ice extent in 1979 (blue) compared with 2016 (white) and the median sea ice extent (yellow line) from 1981 to 2010 (Data: NSDIC 2016). STATE OF THE ARCTIC MARINE BIODIVERSITY REPORT - <a href="https://arcticbiodiversity.is/marine" target="_blank">Chapter 2</a> - Page 27 - Figure 2.4