 CAFF - Arctic Biodiversity Data Service (ABDS)
climatologyMeteorologyAtmosphere
Type of resources
Available actions
Topics
Keywords
Contact for the resource
Provided by
Representation types
Update frequencies
status
-

Arctic foxes are currently monitored at 34 sites throughout the North, with most monitoring efforts concentrated in Fennoscandia (Figure 3-32). The duration of monitoring across all sites is variable at between 2 and 56 years and was ongoing at 27 of the 34 sites (79%) as of 2015. Monitoring projects cover almost equally the four climate zones of the species’ distribution—high Arctic, low Arctic, sub-Arctic, and montane/alpine. STATE OF THE ARCTIC TERRESTRIAL BIODIVERSITY REPORT - Chapter 3 - Page 82 - Figure 3.32
-
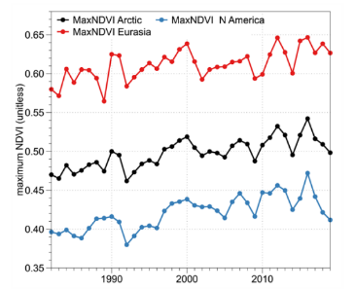
Circumpolar trends in primary productivity as indicated by the maximum Normalised Difference Vegetation Index, 1982–2017. (a) Brown shading indicates negative MaxNDVI trends, green shading indicates positive MaxNDVI trends. (b) Chart of trends for the circumpolar Arctic, Eurasia, and North America. Modified from Frost et al. 2020. STATE OF THE ARCTIC TERRESTRIAL BIODIVERSITY REPORT - Chapter 3 - Page 30 - Figure 3.1
-

Trends and distribution of muskoxen populations based on Table 3-5. Modified from Cuyler et al. 2020. STATE OF THE ARCTIC TERRESTRIAL BIODIVERSITY REPORT - Chapter 3 - Page 79 - Figure 3.30
-
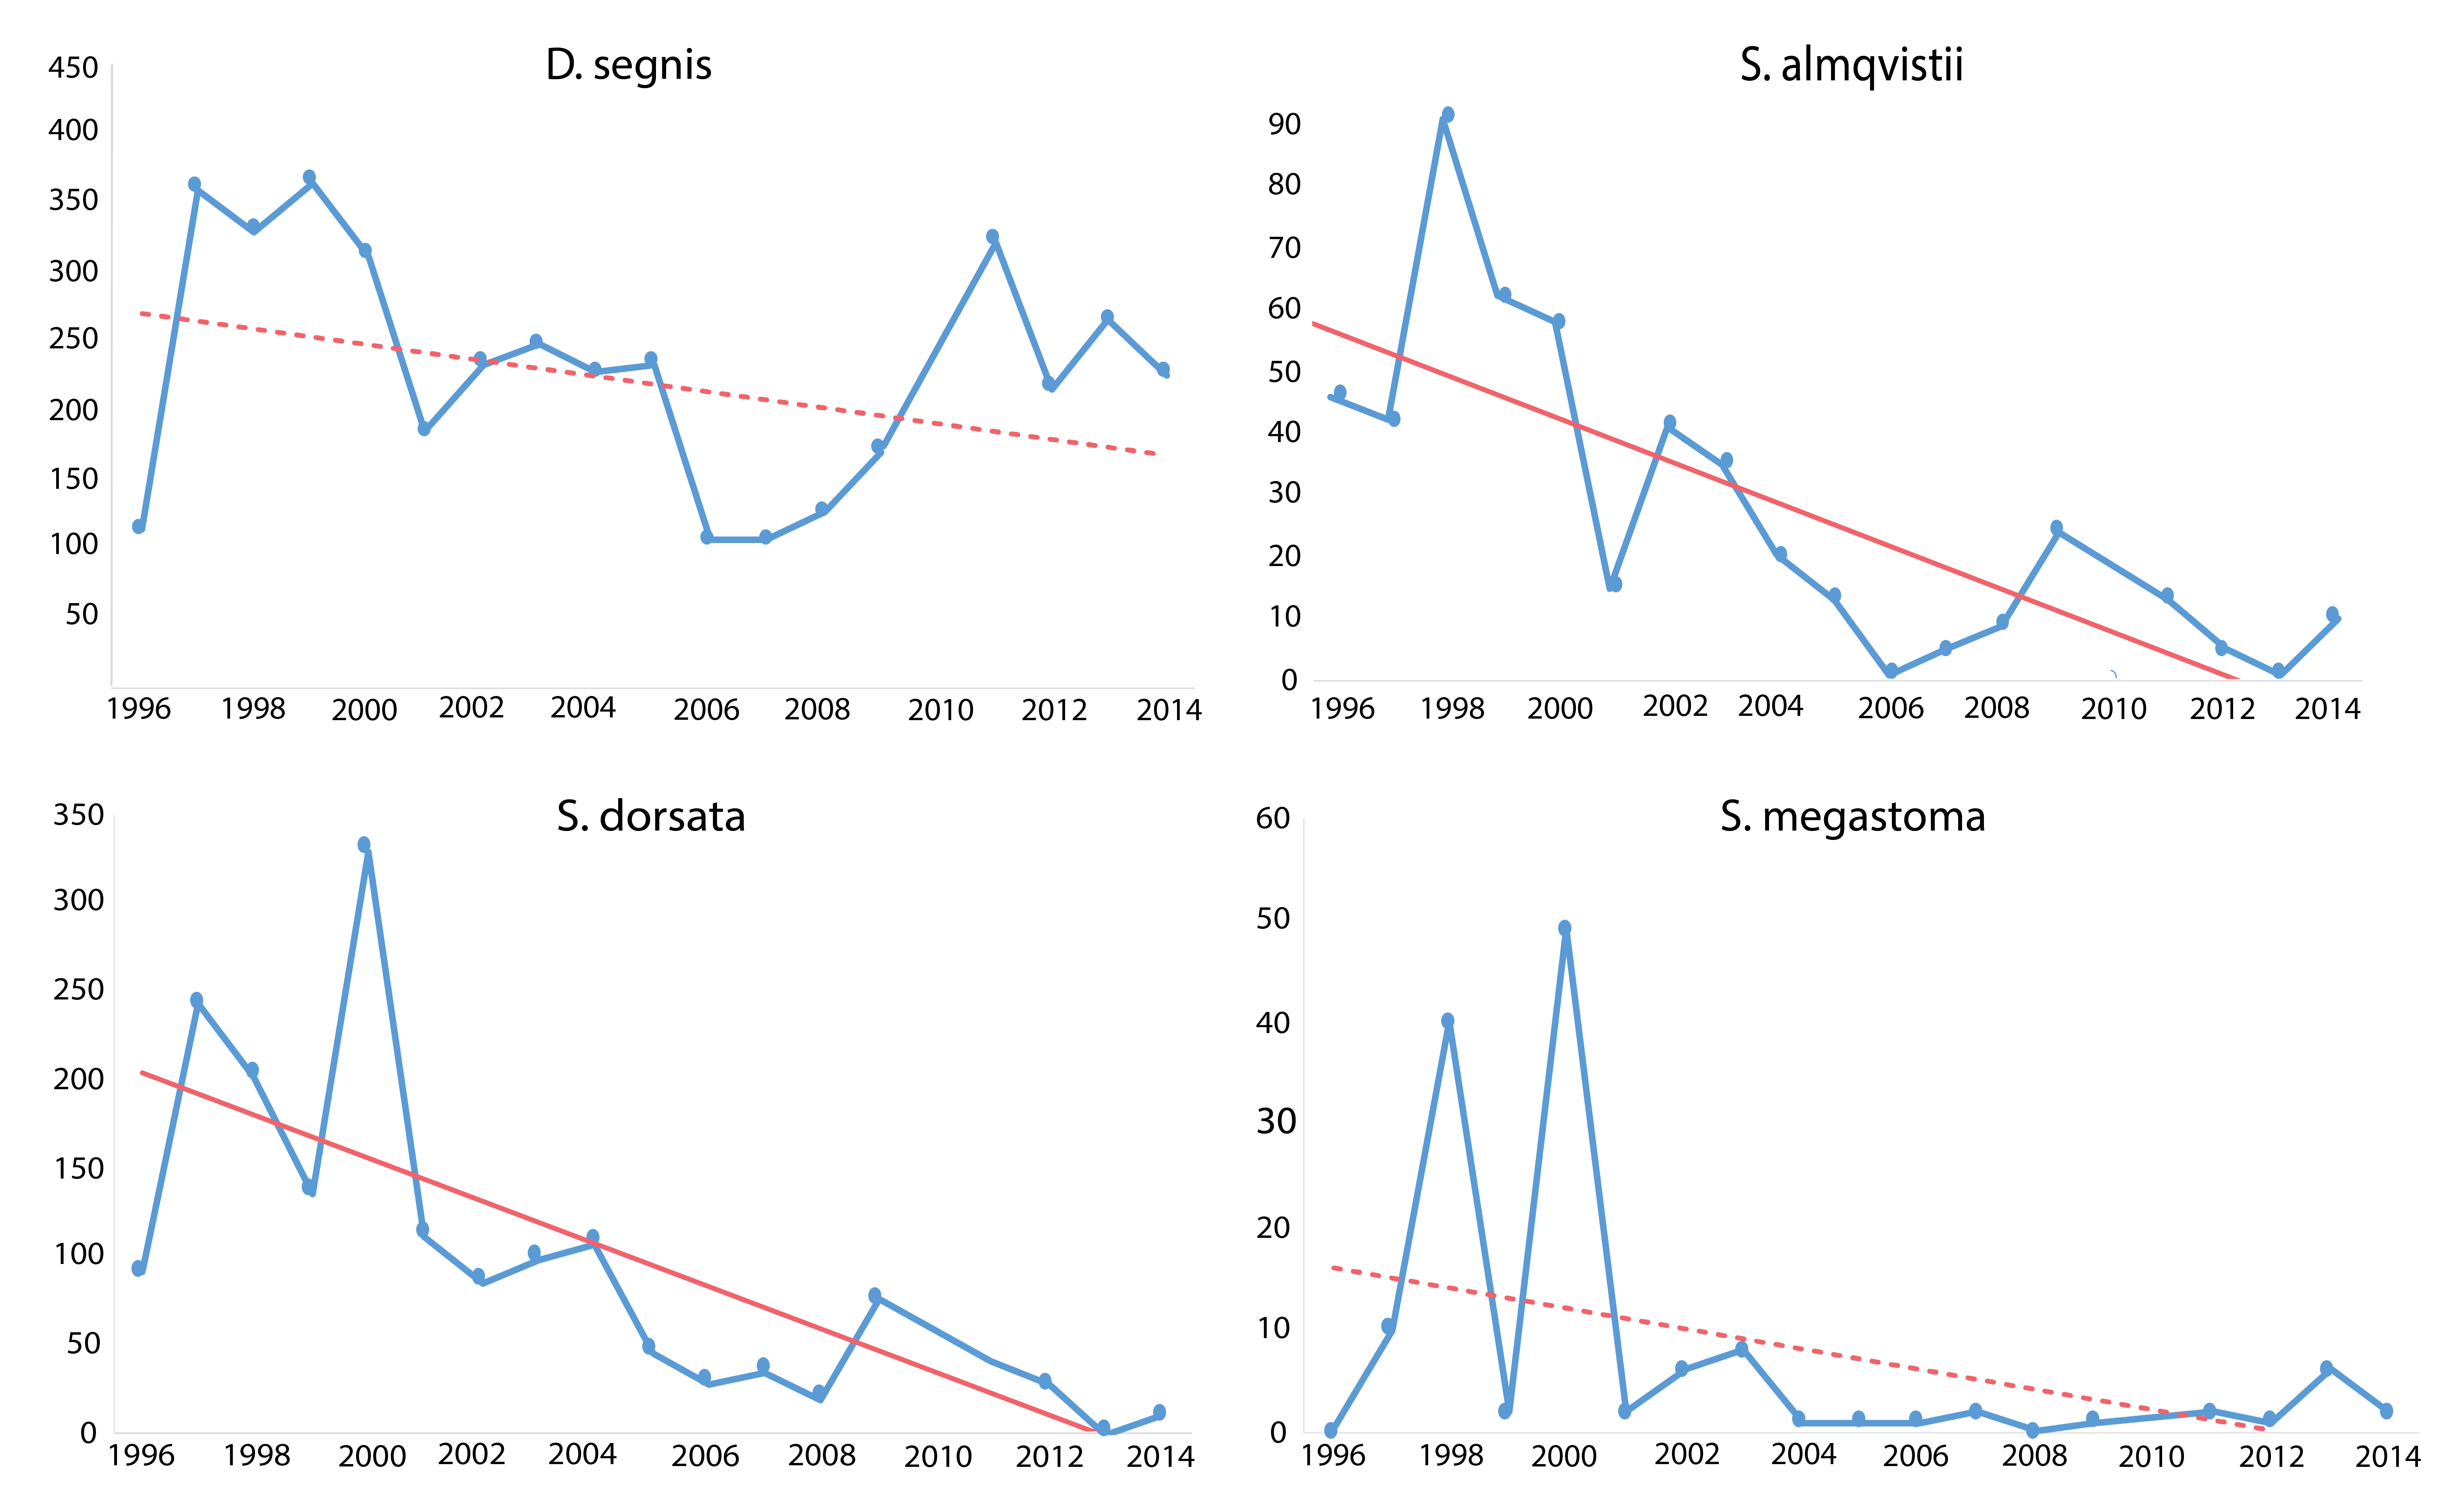
Trends in four muscid species occurring at Zackenberg Research Station, east Greenland, 1996–2014. Declines were detected in several species over five or more years. Significant regression lines drawn as solid. Non-significant as dotted lines. Modified from Gillespie et al. 2020a. (in the original figure six species showed a statistically significant decline, seven a non-significant decline and one species a non-significant rise) STATE OF THE ARCTIC TERRESTRIAL BIODIVERSITY REPORT - Chapter 3 - Page 39 - Figure 3.11
-
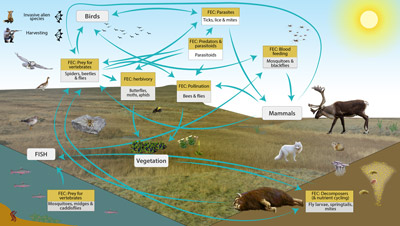
Conceptual model of the FECs and processes mediated by more than 2,500 species of Arctic arthropods known from Greenland, Iceland, Svalbard, and Jan Mayen. STATE OF THE ARCTIC TERRESTRIAL BIODIVERSITY REPORT - Chapter 3 - Page 37- Figure 3.7
-

Geographic area covered by the Arctic Biodiversity Assessment and the CBMP–Terrestrial Plan. Subzones A to E are depicted as defined in the Circumpolar Arctic Vegetation Map (CAVM Team 2003). Subzones A, B and C are the high Arctic while subzones D and E are the low Arctic. Definition of high Arctic, low Arctic, and sub-Arctic follow Hohn & Jaakkola 2010. STATE OF THE ARCTIC TERRESTRIAL BIODIVERSITY REPORT - Chapter 1 - Page 14 - Figure 1.2
-
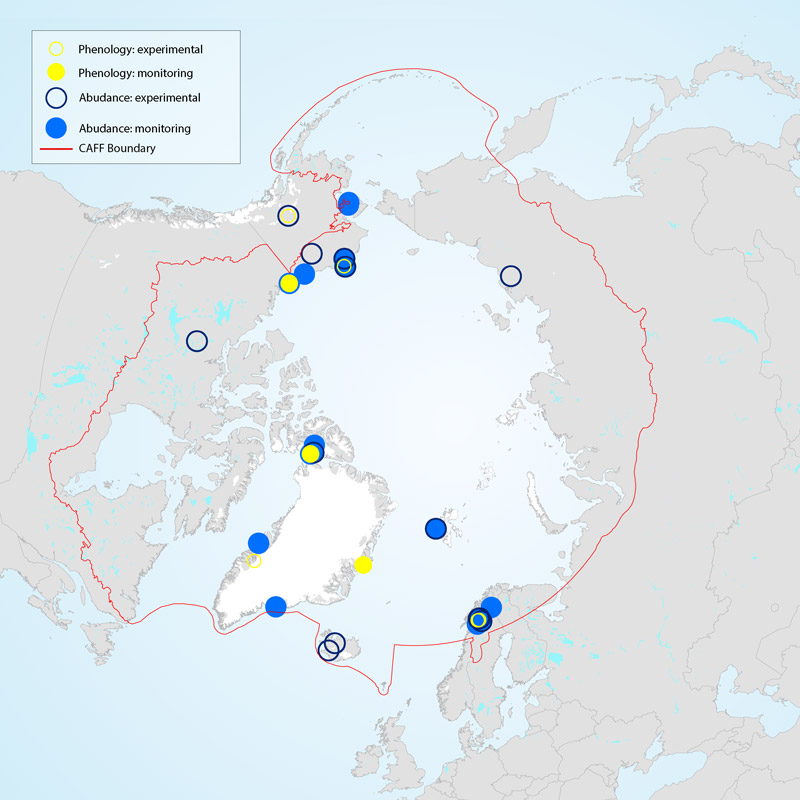
Vegetation monitoring occurs across the Arctic, but the duration of monitoring efforts is variable and is dependent upon both study design and access to resources. Although many field studies on vegetation have been conducted in the Arctic (Figure 3-5), not all can be considered monitoring since some recorded only select measurements over limited time frames. Studies reporting on abundance and composition of vegetation reflect a larger and more widespread geographical coverage than the typically more site-limited and time-consuming phenology studies (Figure 3-5). Geographical gaps in coverage of Siberia and large parts of the Canadian Arctic are evident. STATE OF THE ARCTIC TERRESTRIAL BIODIVERSITY REPORT - Chapter 3 - Page 34 - Figure 3.5
-
Monthly snow cover extent (SCE) for Arctic land areas (>60° N) for (a) May and (b) June 1967–2020, a 54-year record. Anomalies are relative to the 1981–2010 average and standardised (each observation was differenced from the mean and divided by the standard deviation, and thus unitless). Solid black and red lines depict 5-year running means for North America and Eurasia, respectively. Filled circles are used to highlight 2020 anomalies. (Mudryk et al. 2020). STATE OF THE ARCTIC TERRESTRIAL BIODIVERSITY REPORT - Chapter 2 - Page 23 - Figure 2.3
-
Population trends for springtails in Empetrum nigrum plant community in Kobbefjord, Greenland, 2007–2017. (a) mean population abundance of total Collembola in individuals per square metre, (b) mean number of species per sample, and (c) Shannon-Wiener diversity index per sample. Vertical error bars are standard errors of the mean. Solid lines indicate significant regression lines. Modified from Gillespie et al. 2020a. STATE OF THE ARCTIC TERRESTRIAL BIODIVERSITY REPORT - Chapter 3 - Page 40 - Figure 3.13
-
The CBMP–Terrestrial Plan identifies five FECs for monitoring terrestrial birds; herbivores, insectivores, carnivores, omnivores and piscivores. Due to their migratory nature, a wider range of drivers, from both within and outside the Arctic, affect birds and their associated FEC attributes compared to other terrestrial FECs. Figure 3-21 illustrates a conceptual model for Arctic terrestrial birds that includes examples of FECs and key drivers. STATE OF THE ARCTIC TERRESTRIAL BIODIVERSITY REPORT - Chapter 3 - Page 46 - Figure 3.21