 CAFF - Arctic Biodiversity Data Service (ABDS)
oceans
Type of resources
Available actions
Topics
Keywords
Contact for the resource
Provided by
Years
Formats
Representation types
Update frequencies
status
Scale
-
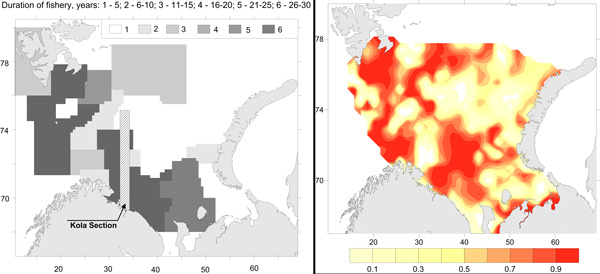
Commercial fishery impact on zoobenthos of the Barents Sea. Figure A) Intensity and duration of fishery efforts in standard commercial fishery areas in the Barents Sea. The darker the area the longer the fishery has been in operation. Figure B) Level of decline in macrobenthic biomass between 1926-1932 and 1968-1970 calculated as 1-b1968/b1930. The largest biomass decreases correspond to the darker colour, whereas lighter colour refers to no change (Denisenko 2013). STATE OF THE ARCTIC MARINE BIODIVERSITY REPORT - <a href="https://arcticbiodiversity.is/findings/benthos" target="_blank">Chapter 3</a> - Page 97 - Figure 3.3.4
-
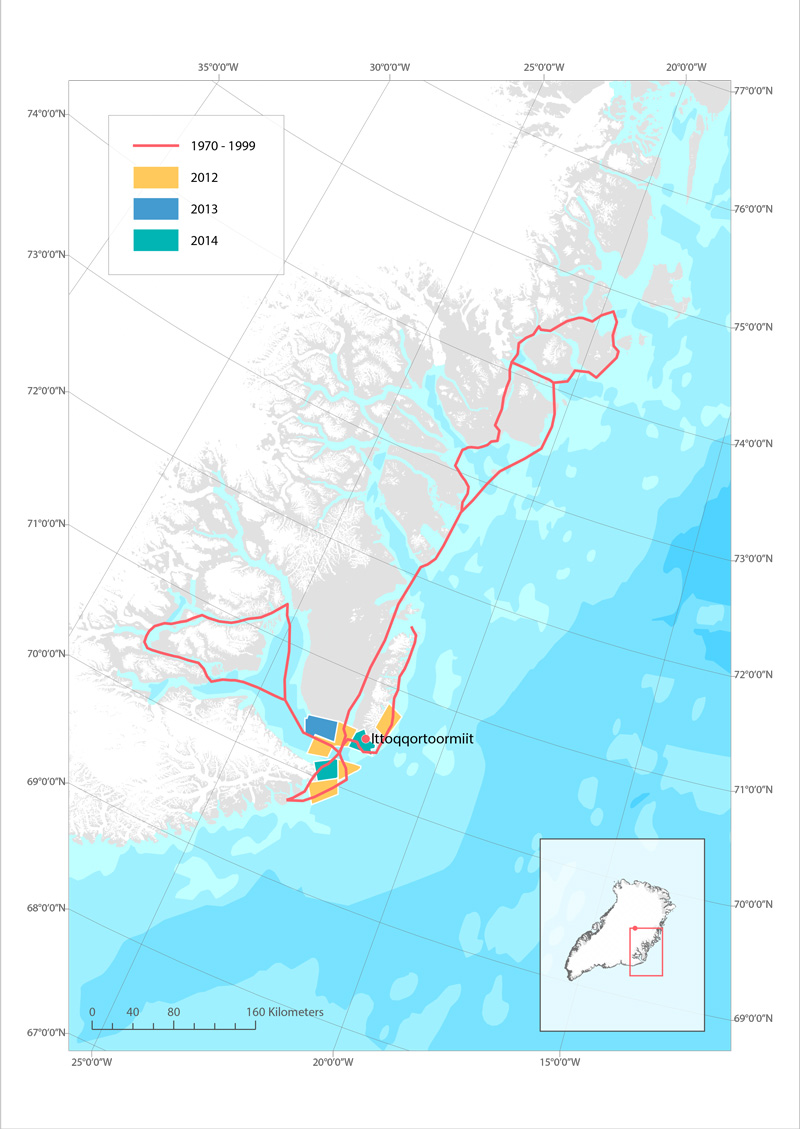
Routes used for hunting polar bear in Ittoqqoortoormiit, East Greenland before 1999 (red line), and in 2012 (yellow), 2013 (blue) and 2014 (green). STATE OF THE ARCTIC MARINE BIODIVERSITY REPORT - <a href="https://arcticbiodiversity.is/findings/marine-mammals" target="_blank">Chapter 3</a> - Page 159 - Box figure 3.6.1
-
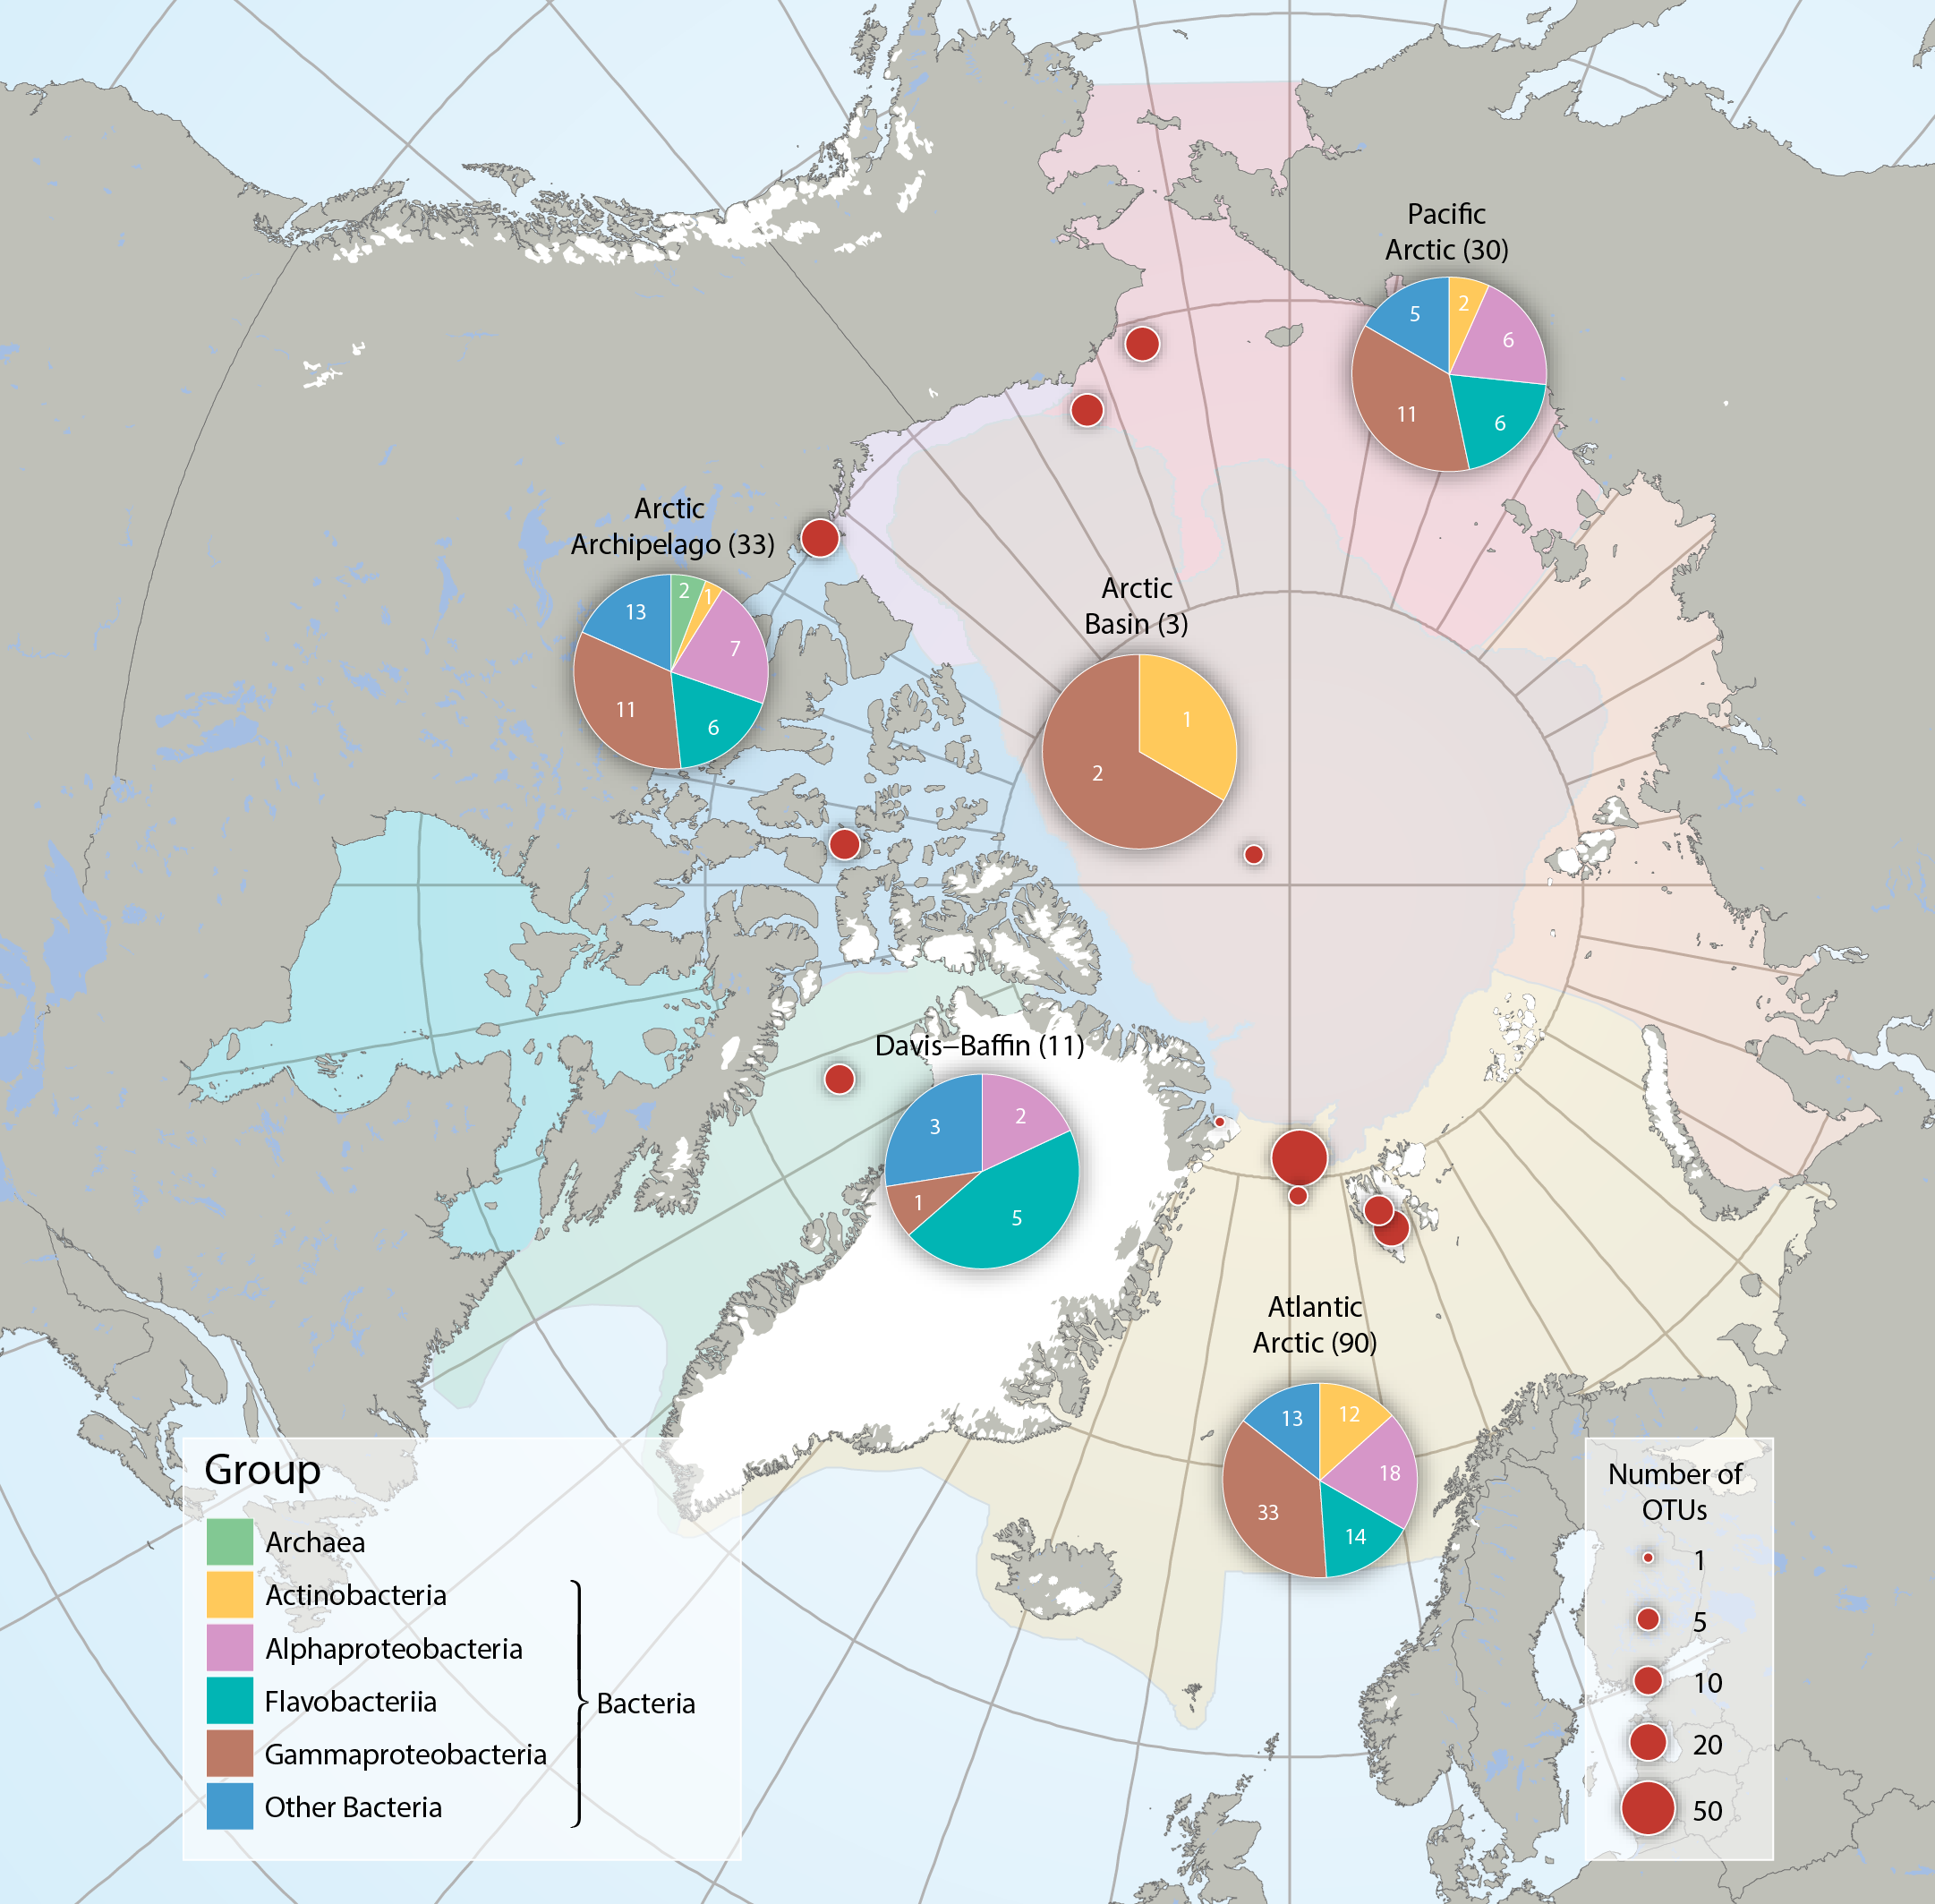
Bacteria and Archaea across five Arctic Marine Areas based on number of operational taxonomic units (OTUs), or molecular species. Composition of microbial groups, with respective numbers of OTUs (pie charts) and number of OTUs at sampling locations (red dots). Data aggregated by the CBMP Sea Ice Biota Expert Network. Data source: National Center for Biotechnology Information’s (NCBI 2017) Nucleotide and PubMed databases. STATE OF THE ARCTIC MARINE BIODIVERSITY REPORT - <a href="https://arcticbiodiversity.is/findings/sea-ice-biota" target="_blank">Chapter 3</a> - Page 38 - Figure 3.1.2 From the report draft: "Synthesis of available data was performed by using searches conducted in the National Center for Biotechnology Information’s “Nucleotide” (http://www.ncbi.nlm.nih.gov/guide/data-software/) and “PubMed” (http://www.ncbi.nlm.nih.gov/pubmed) databases. Aligned DNA sequences were downloaded and clustered into OTUs by maximum likelihood phylogenetic placement."
-
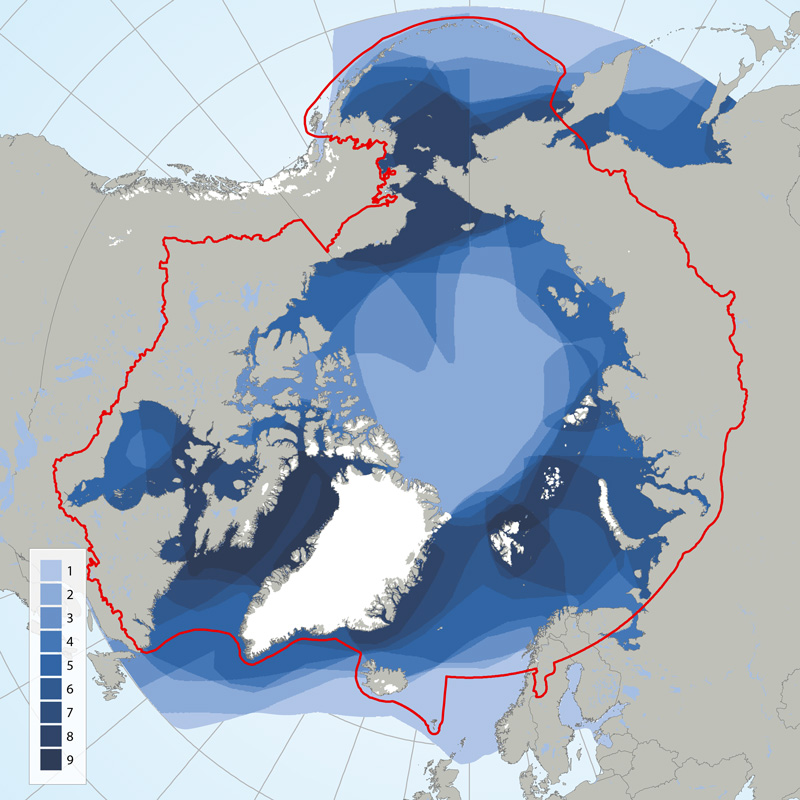
Circumpolar depiction of species richness based on the distributions of the 11 ice-associated Focal Ecosystem Components (according to the distributions reported in IUCN Red List species accounts). A maximum of nine species occur in any one geographic location. The Arctic gateways in both the Atlantic and Pacific regions have the highest species diversity. STATE OF THE ARCTIC MARINE BIODIVERSITY REPORT - <a href="https://arcticbiodiversity.is/findings/marine-mammals" target="_blank">Chapter 3</a> - Page 152 - Figure 3.6.1
-
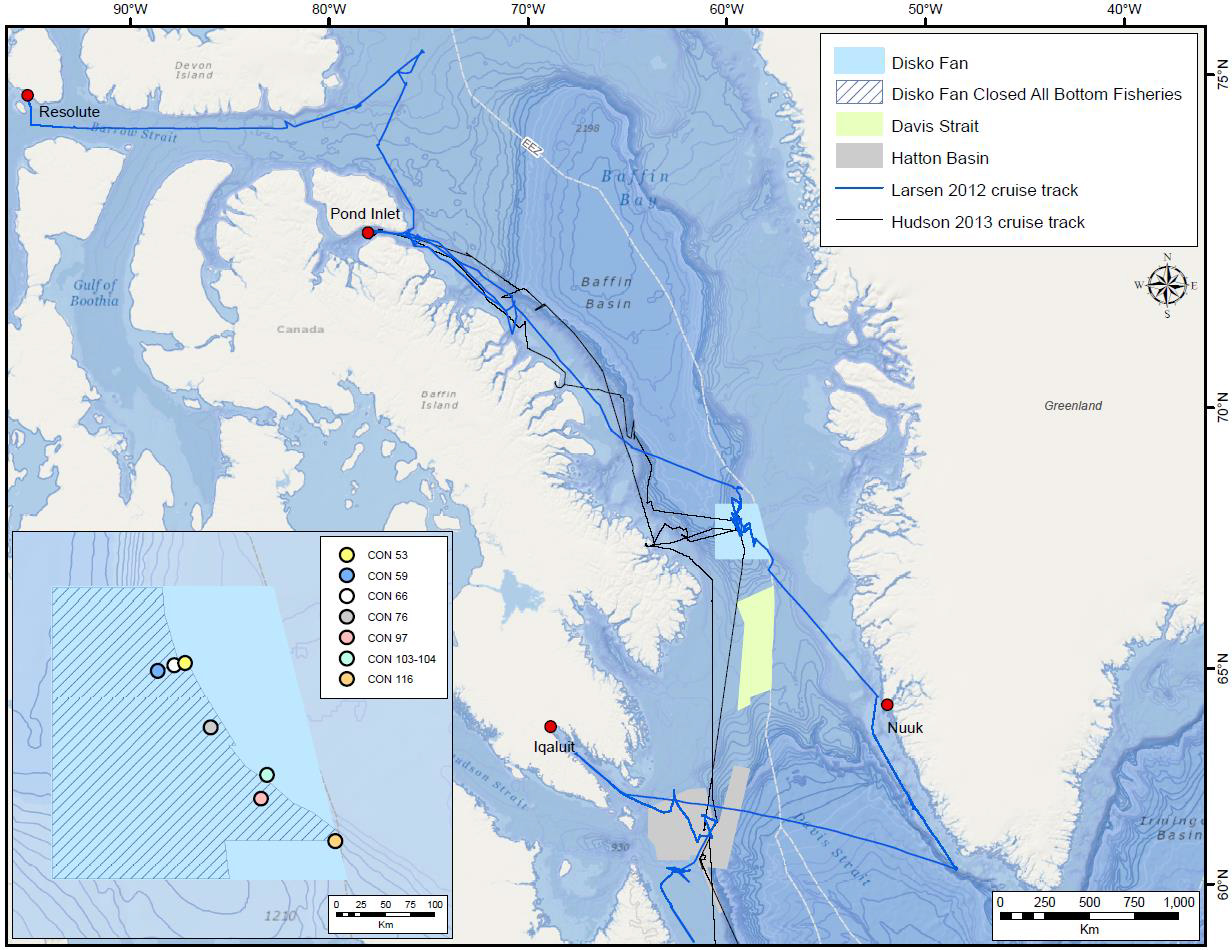
In 2012 and 2013, Fisheries and Oceans Canada conducted benthic imagery surveys in the Davis Strait and Baffin Basin in two areas then closed to bottom fishing, the Hatton Basin Voluntary Closure (now the Hatton Basin Conservation Area) and the Narwhal Closure (now partially in the Disko Fan Conservation Area). The photo transects were established as long-term biodiversity monitoring sites to monitor the impact of human activity, including climate change, on the region’s benthic marine biota in accordance with the protocols of the Circumpolar Biodiversity Monitoring Program established by the Council of Arctic Flora and Fauna. These images were analyzed in a techncial report that summarises the epibenthic megafauna found in seven image transects from the Disko Fan Conservation Area. A total of 480 taxa were found, 280 of which were identified as belonging to one of the following phyla: Annelida, Arthropoda, Brachiopoda, Bryozoa, Chordata, Cnidaria, Echinodermata, Mollusca, Nemertea, and Porifera. The remaining 200 taxa could not be assigned to a phylum and were categorised as Unidentified. Each taxon was identified to the lowest possible taxonomic level, typically class, order, or family. The summaries for each of the taxa include their identification numbers in the World Register of Marine Species and Integrated Taxonomic Information System’s databases, taxonomic hierarchies, images, and written descriptions. The report is intended to provide baseline documentation of the epibenthic megafauna in the Disko Fan Conservation Area, and serve as a taxonomic resource for future image analyses in the Arctic. Baker, E., Beazley, L., McMillan, A., Rowsell, J. and Kenchington, E. 2018. Epibenthic Megafauna of the Disko Fan Conservation Area in the Davis Strait (Eastern Arctic) Identified from In Situ Benthic Image Transects. Can. Tech. Rep. Fish. Aquat. Sci. 3272: vi + 388 p.
-
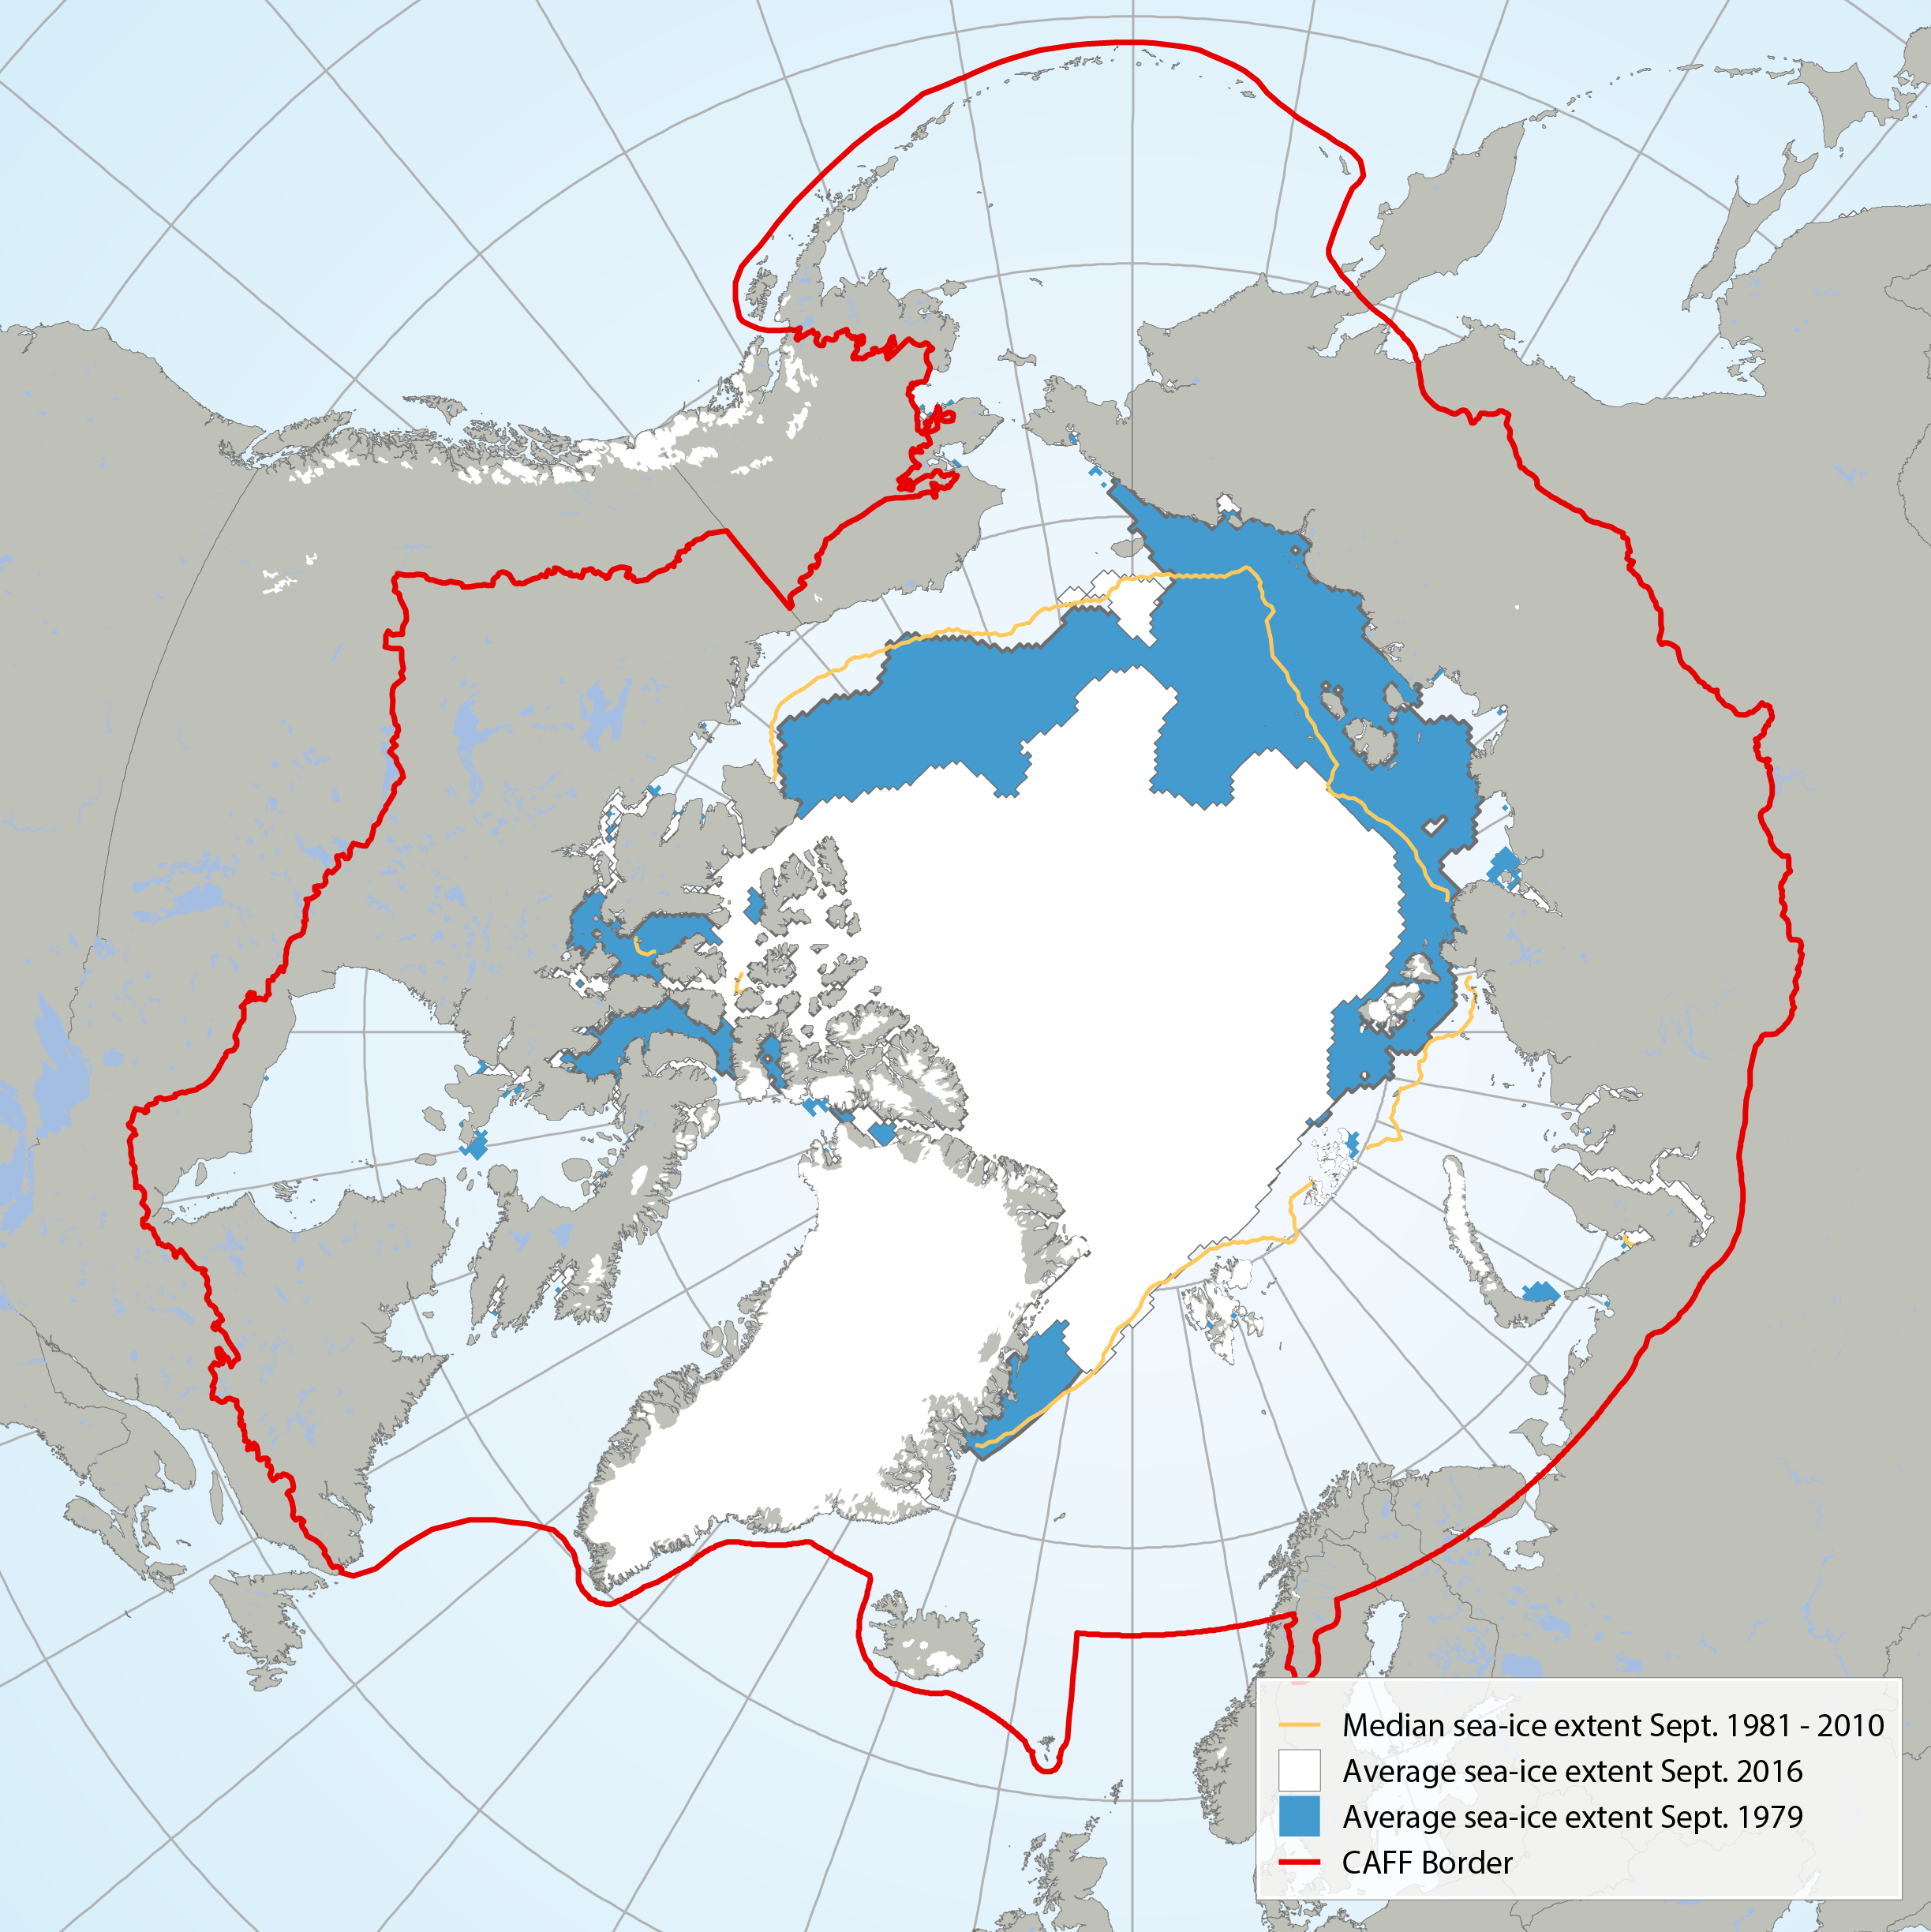
Average September sea ice extent in 1979 (blue) compared with 2016 (white) and the median sea ice extent (yellow line) from 1981 to 2010 (Data: NSDIC 2016). STATE OF THE ARCTIC MARINE BIODIVERSITY REPORT - <a href="https://arcticbiodiversity.is/marine" target="_blank">Chapter 2</a> - Page 27 - Figure 2.4
-
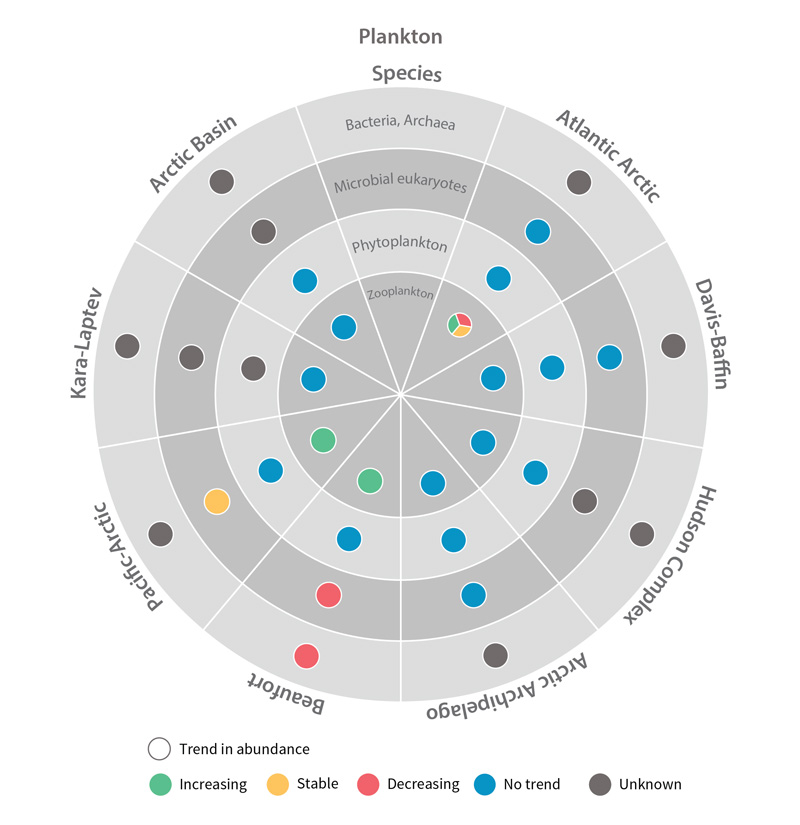
Trends in abundance of plankton Focal Ecosystem Components across each Arctic Marine Area. STATE OF THE ARCTIC MARINE BIODIVERSITY REPORT - Chapter 4 - Page 178 - Figure 4.2
-
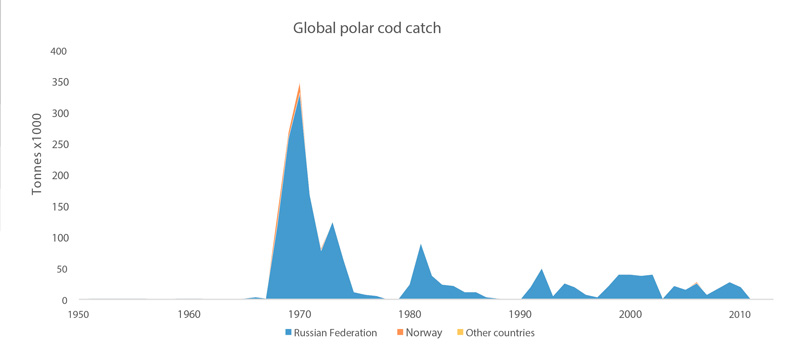
Global catches of polar cod from 1950 to 2011 (FAO 2015); 95% of the catches are from the Barents Sea. STATE OF THE ARCTIC MARINE BIODIVERSITY REPORT - <a href="https://arcticbiodiversity.is/findings/marine-fishes" target="_blank">Chapter 3</a> - Page 116 - Figure 3.4.4
-
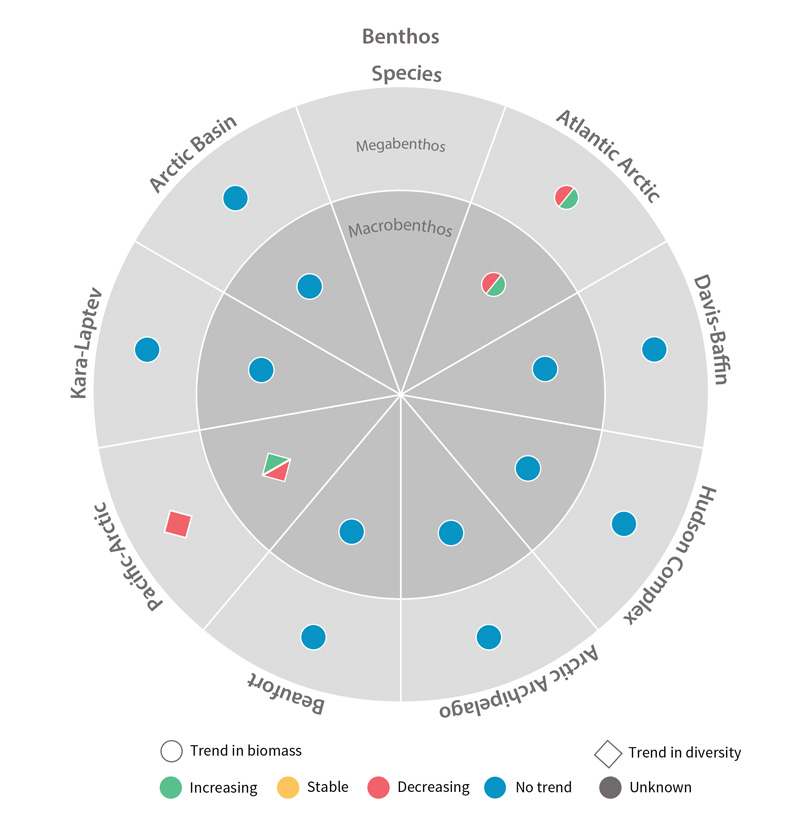
Trends in biomass or diversity of benthic Focal Ecosystem Components across each Arctic Marine Area. STATE OF THE ARCTIC MARINE BIODIVERSITY REPORT - Chapter 4 - Page 179 - Figure 4.3
-
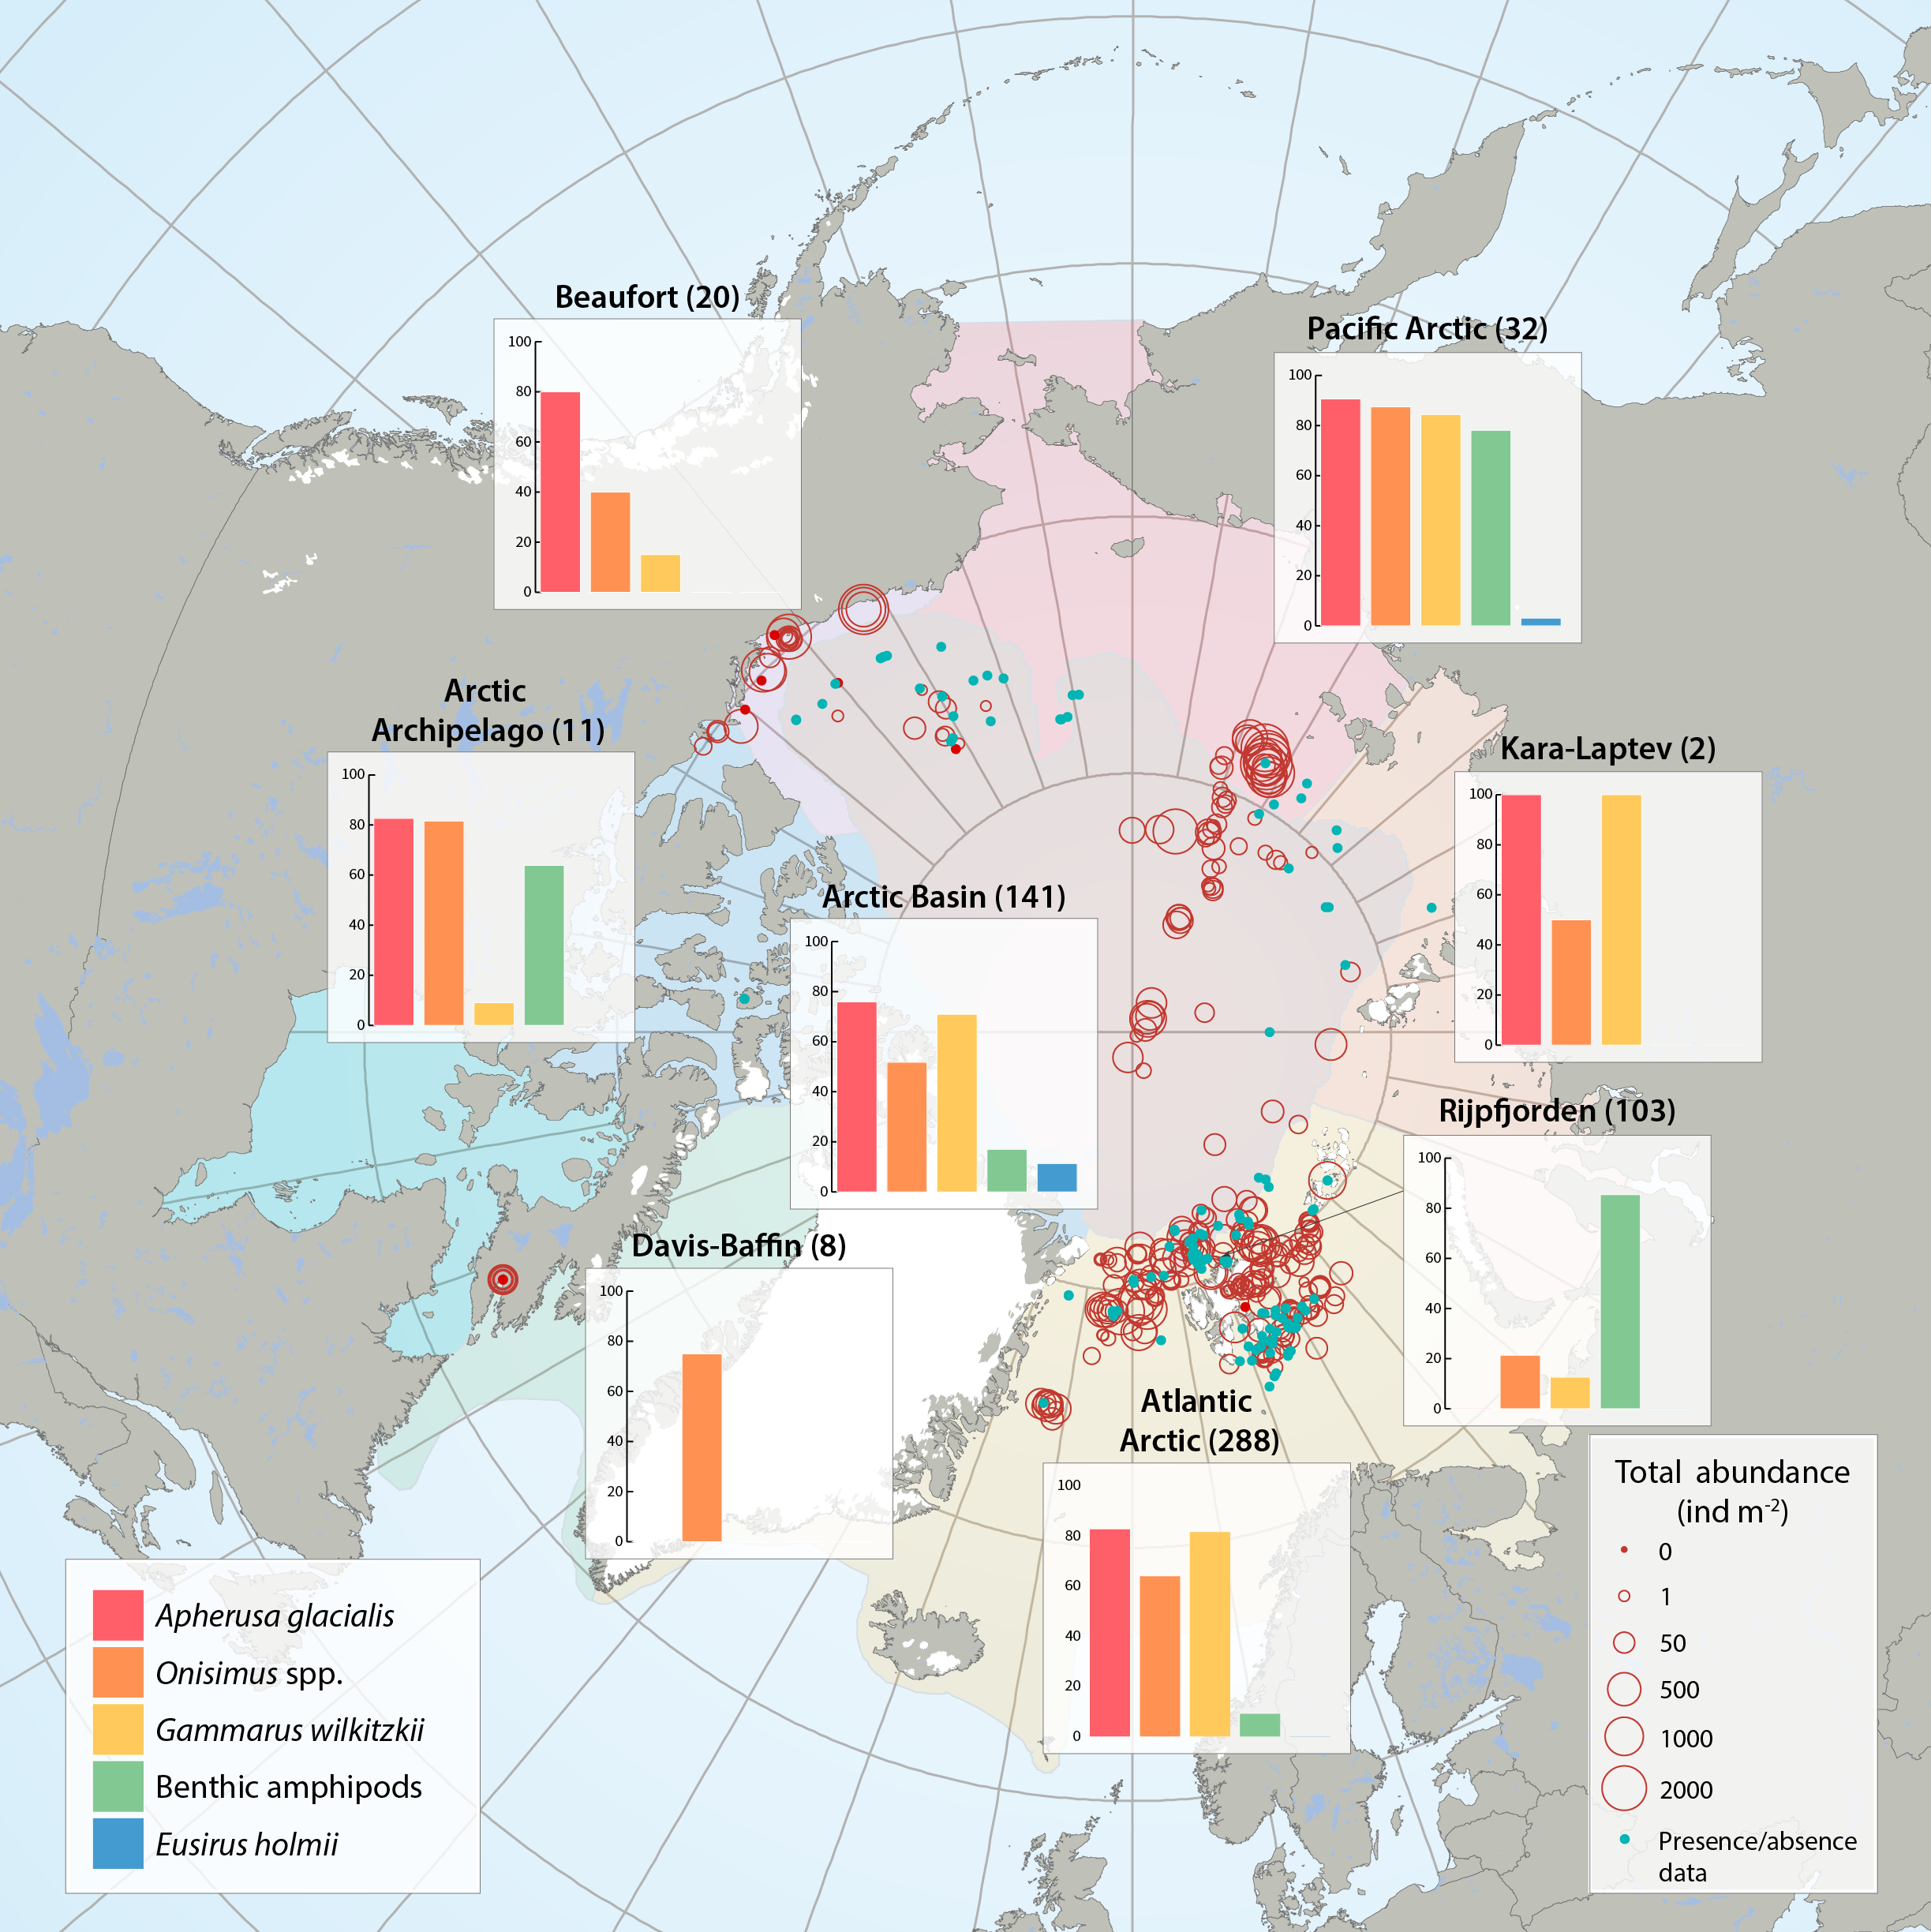
Sea ice amphipod (macrofauna) distribution and abundance across the Arctic aggregated from 47 sources between 1977 and 2012 by the CBMP Sea Ice Biota Expert Network. Bar graphs illustrate the frequency of occurrence (%) of amphipods in samples that contained at least one ice-associated amphipod. Red circles illustrate the total abundances of all ice-associated amphipods in quantitative samples (individuals m-2) at locations of sampling for each Arctic Marine Area (AMA). Number of sampling efforts for each region is given in parenthesis after region name. Blue dots represent samples where only presence/ absence data were available and where amphipods were present. STATE OF THE ARCTIC MARINE BIODIVERSITY REPORT - <a href="https://arcticbiodiversity.is/findings/sea-ice-biota" target="_blank">Chapter 3</a> - Page 44 - Figure 3.1.6 From the report draft: "This summary includes 47 data sources of under-ice amphipods published between 1977 and 2012. When available, we collected information on abundance or density (ind. m-2, or ind. m-3 that were converted to ind. m-2) and biomass (g m-2, wet weight). If abundance or biomass data were not available, we examined presence/relative abundance information. Frequency of occurrence was calculated for regions across the Arctic using integrated data for all available years."