 CAFF - Arctic Biodiversity Data Service (ABDS)
SAFBR
Type of resources
Available actions
Topics
Keywords
Contact for the resource
Provided by
Representation types
Update frequencies
status
-

Summary of the taxa accounting for 85% of the river benthic macroinvertebrates collected in each of several highly-sampled geographic areas, with taxa grouped by order level or higher in pie charts placed spatially to indicate sampling area. Pie charts correspond to (1) Alaska, (2) western Canada, (3) southern Canada, south of Hudson Bay, (4) northern Labrador, (5) Baffin Island, (6) Ellesmere Island, (7) Greenland high Arctic, (8) Greenland low Arctic, (9) Iceland, (10) Svalbard, and (11) Fennoscandia. State of the Arctic Freshwater Biodiversity Report - Chapter 4 - Page 70 - Figure 4-34
-

Results of circumpolar assessment of river diatoms, indicating (a) the location of river diatom stations, underlain by circumpolar ecoregions; (b) ecoregions with many river diatom stations, colored on the basis of alpha diversity rarefied to 40 stations; (c) all ecoregions with river diatom stations, colored on the basis of alpha diversity rarefied to 10 stations; (d) ecoregions with at least two stations in a hydrobasin, colored on the basis of the dominant component of beta diversity (species turnover, nestedness, approximately equal contribution, or no diversity) when averaged across hydrobasins in each ecoregion. State of the Arctic Freshwater Biodiversity Report - Chapter 4 - Page 36 - Figure 4-8
-

Figure 3-5 Changes in alpha diversity (red line), predator body size (blue dashed line), and ecosystem metabolism (blue solid line) with a shift in glacial cover from high (left) to low (right). Redrawn from Milner et al. (2017). State of the Arctic Freshwater Biodiversity Report - Chapter 3 - Page 22 - Figure 3-5
-
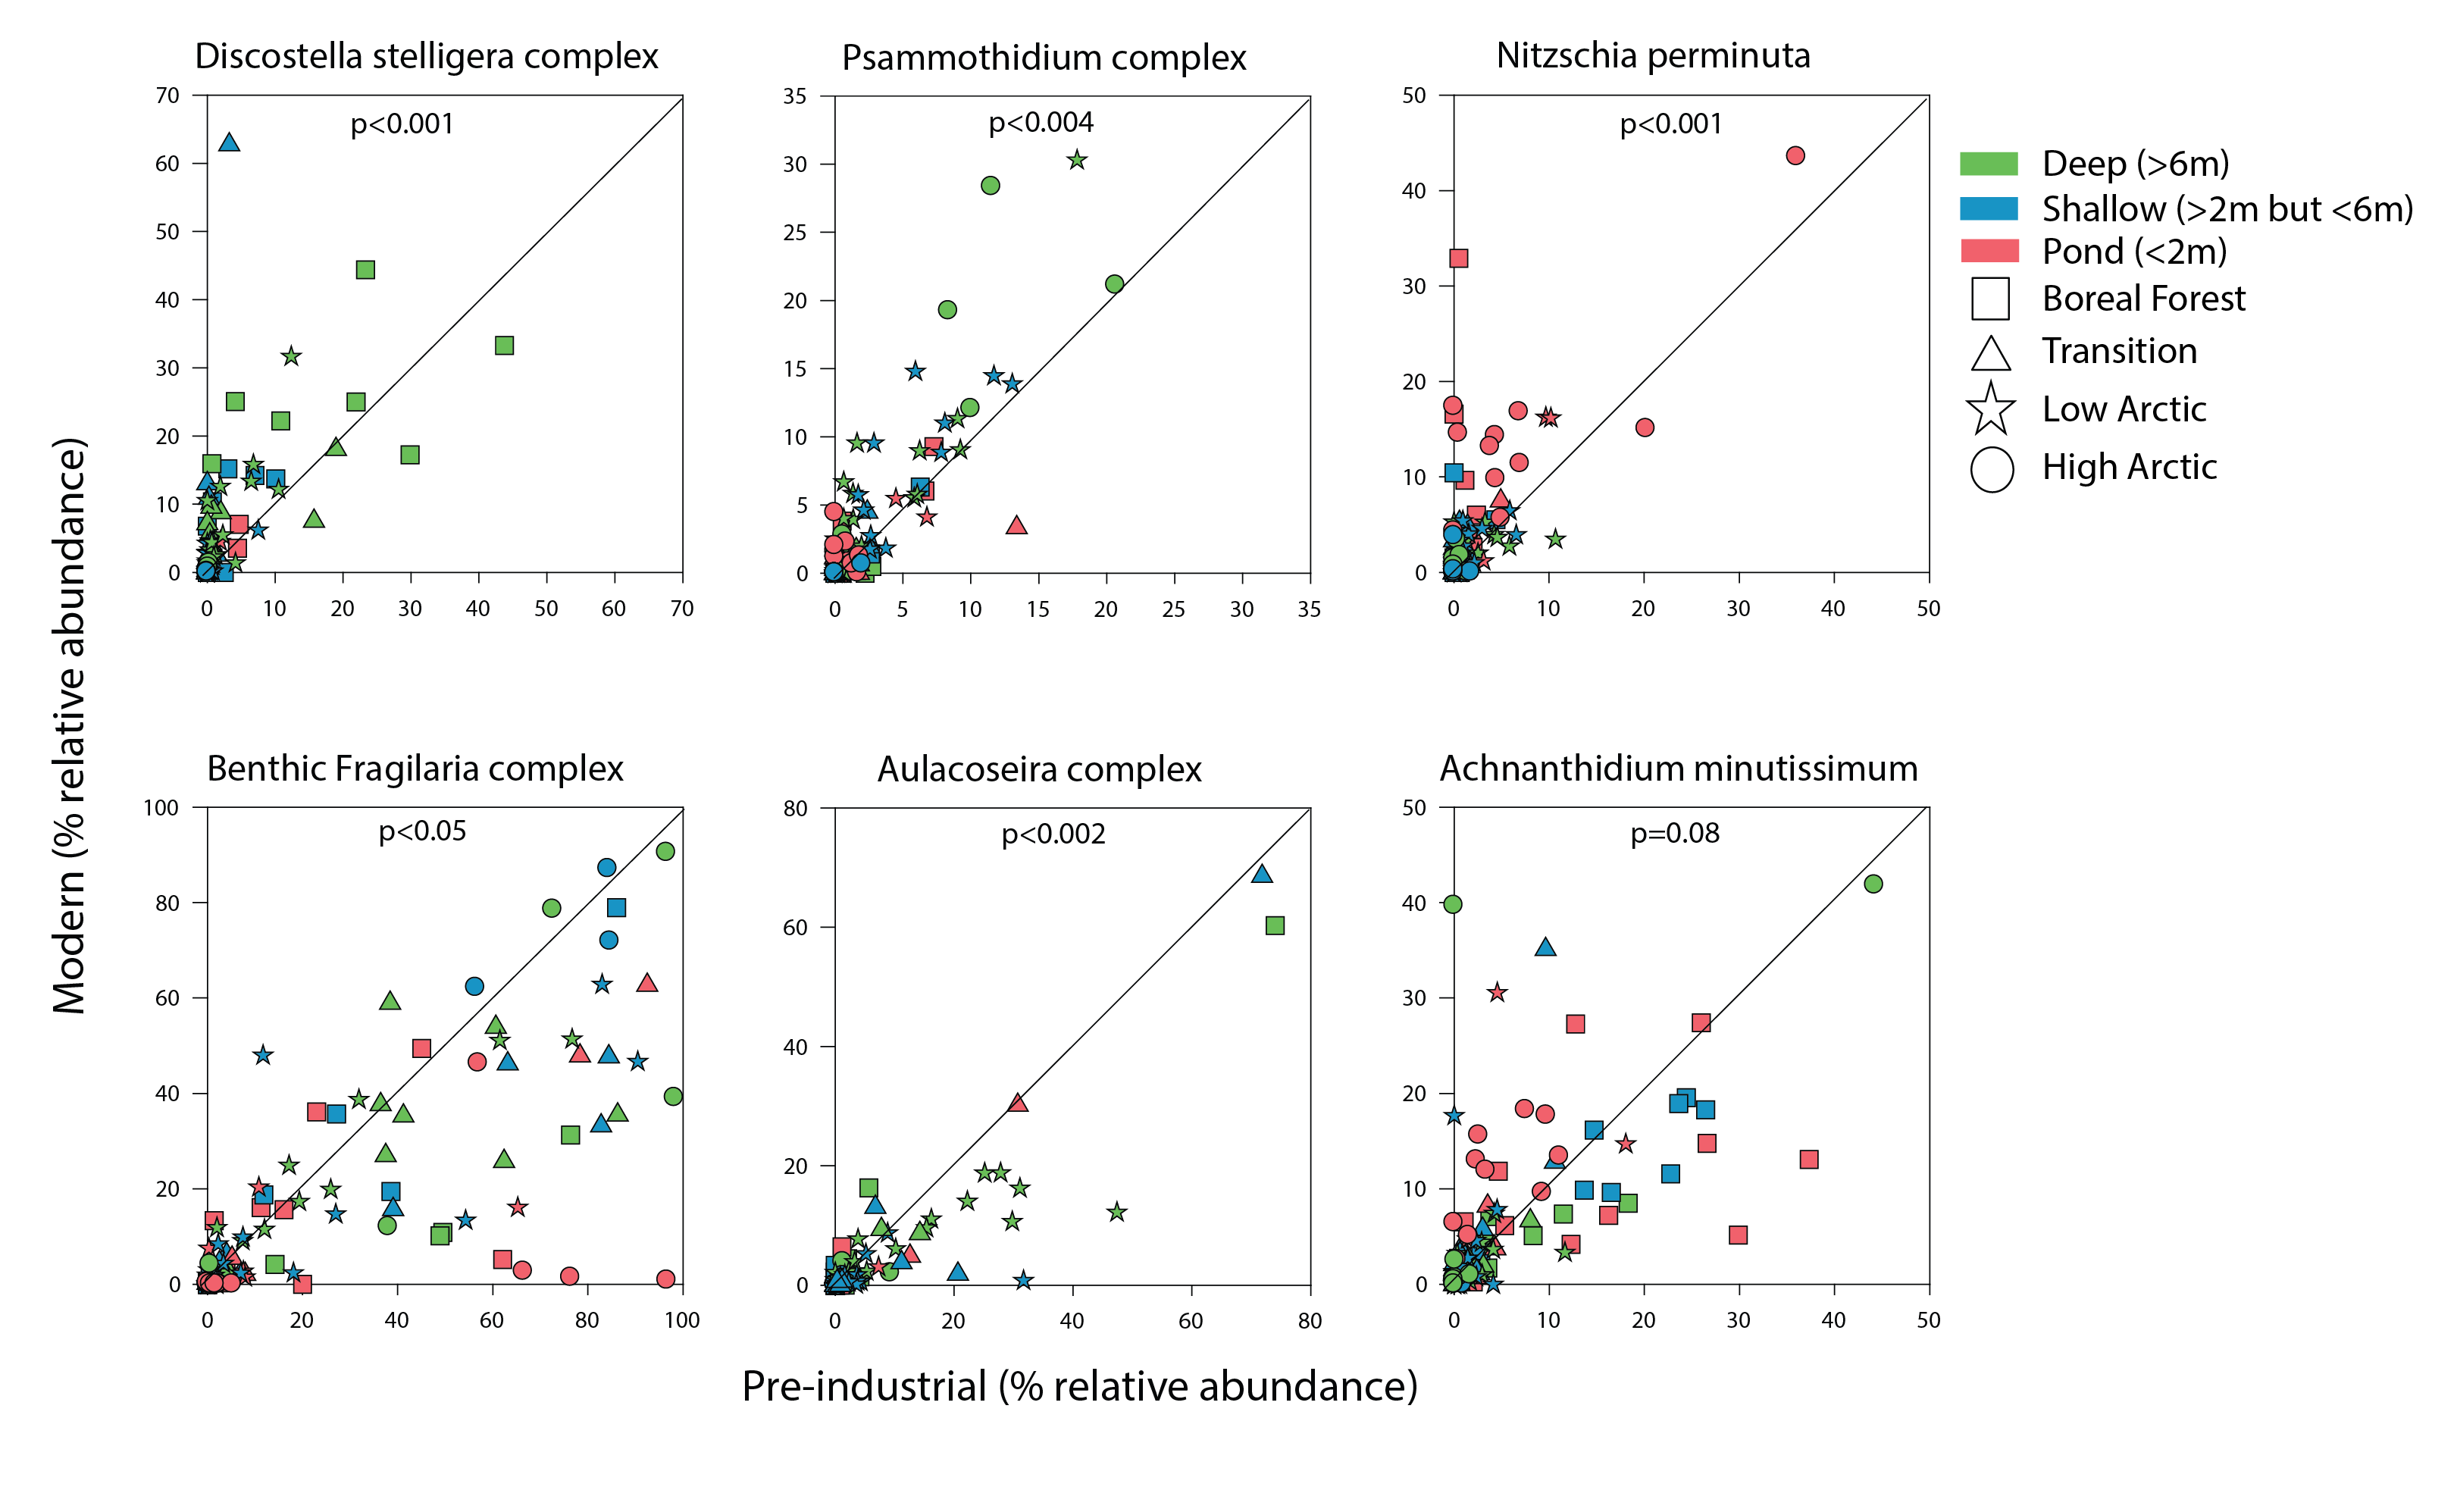
Figure 4 15 Comparison of the relative abundance of select diatom taxonomic groups between core bottoms (pre-industrial sediments; x- axis) and core tops (modern sediments; y-axis) with a 1:1 line to indicate whether there were higher abundances in fossil samples (below red line) or modern samples (above red line). State of the Arctic Freshwater Biodiversity Report - Chapter 2 - Page 15 - Figure 2-1
-
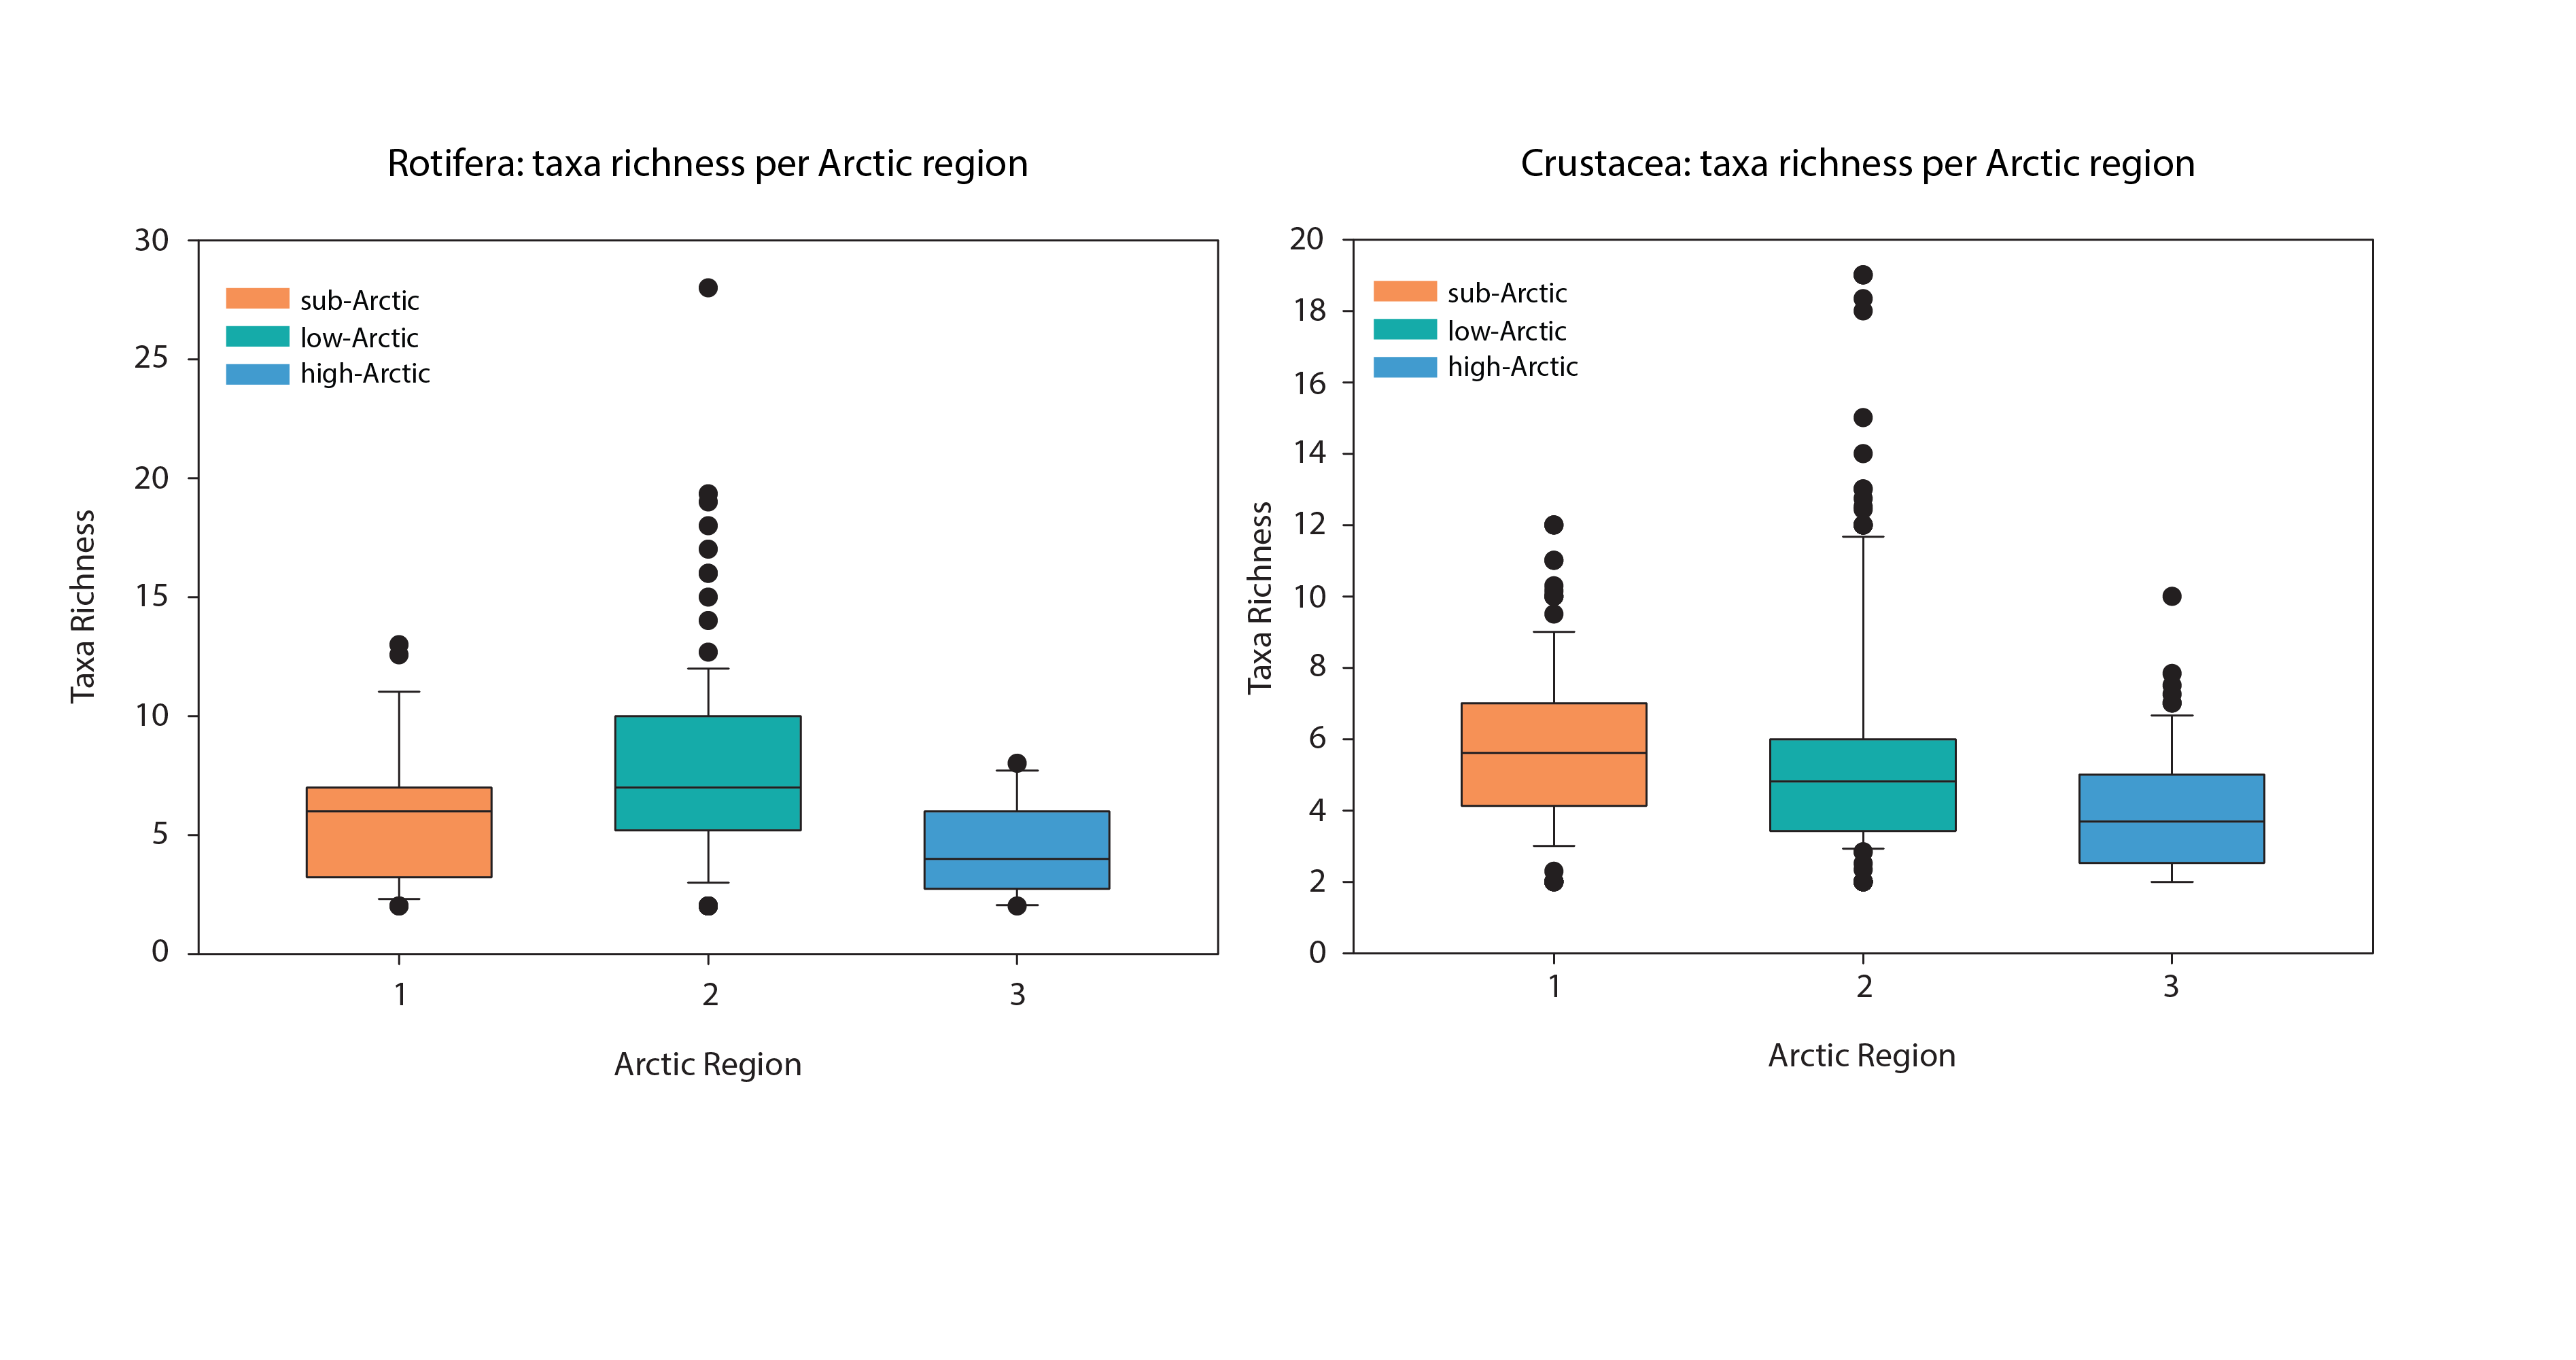
Box-plots of taxa richness (average per lake) by Arctic regions for rotifers (left) and crustaceans (right). Crustacean taxa are restricted to taxa within Calanoida, Cyclopoida and Cladocera. Samples with only a single taxon have been excluded. Boxes represent median and interquartile range. State of the Arctic Freshwater Biodiversity Report - Chapter 4 - Page 60 - Figure 4-27
-
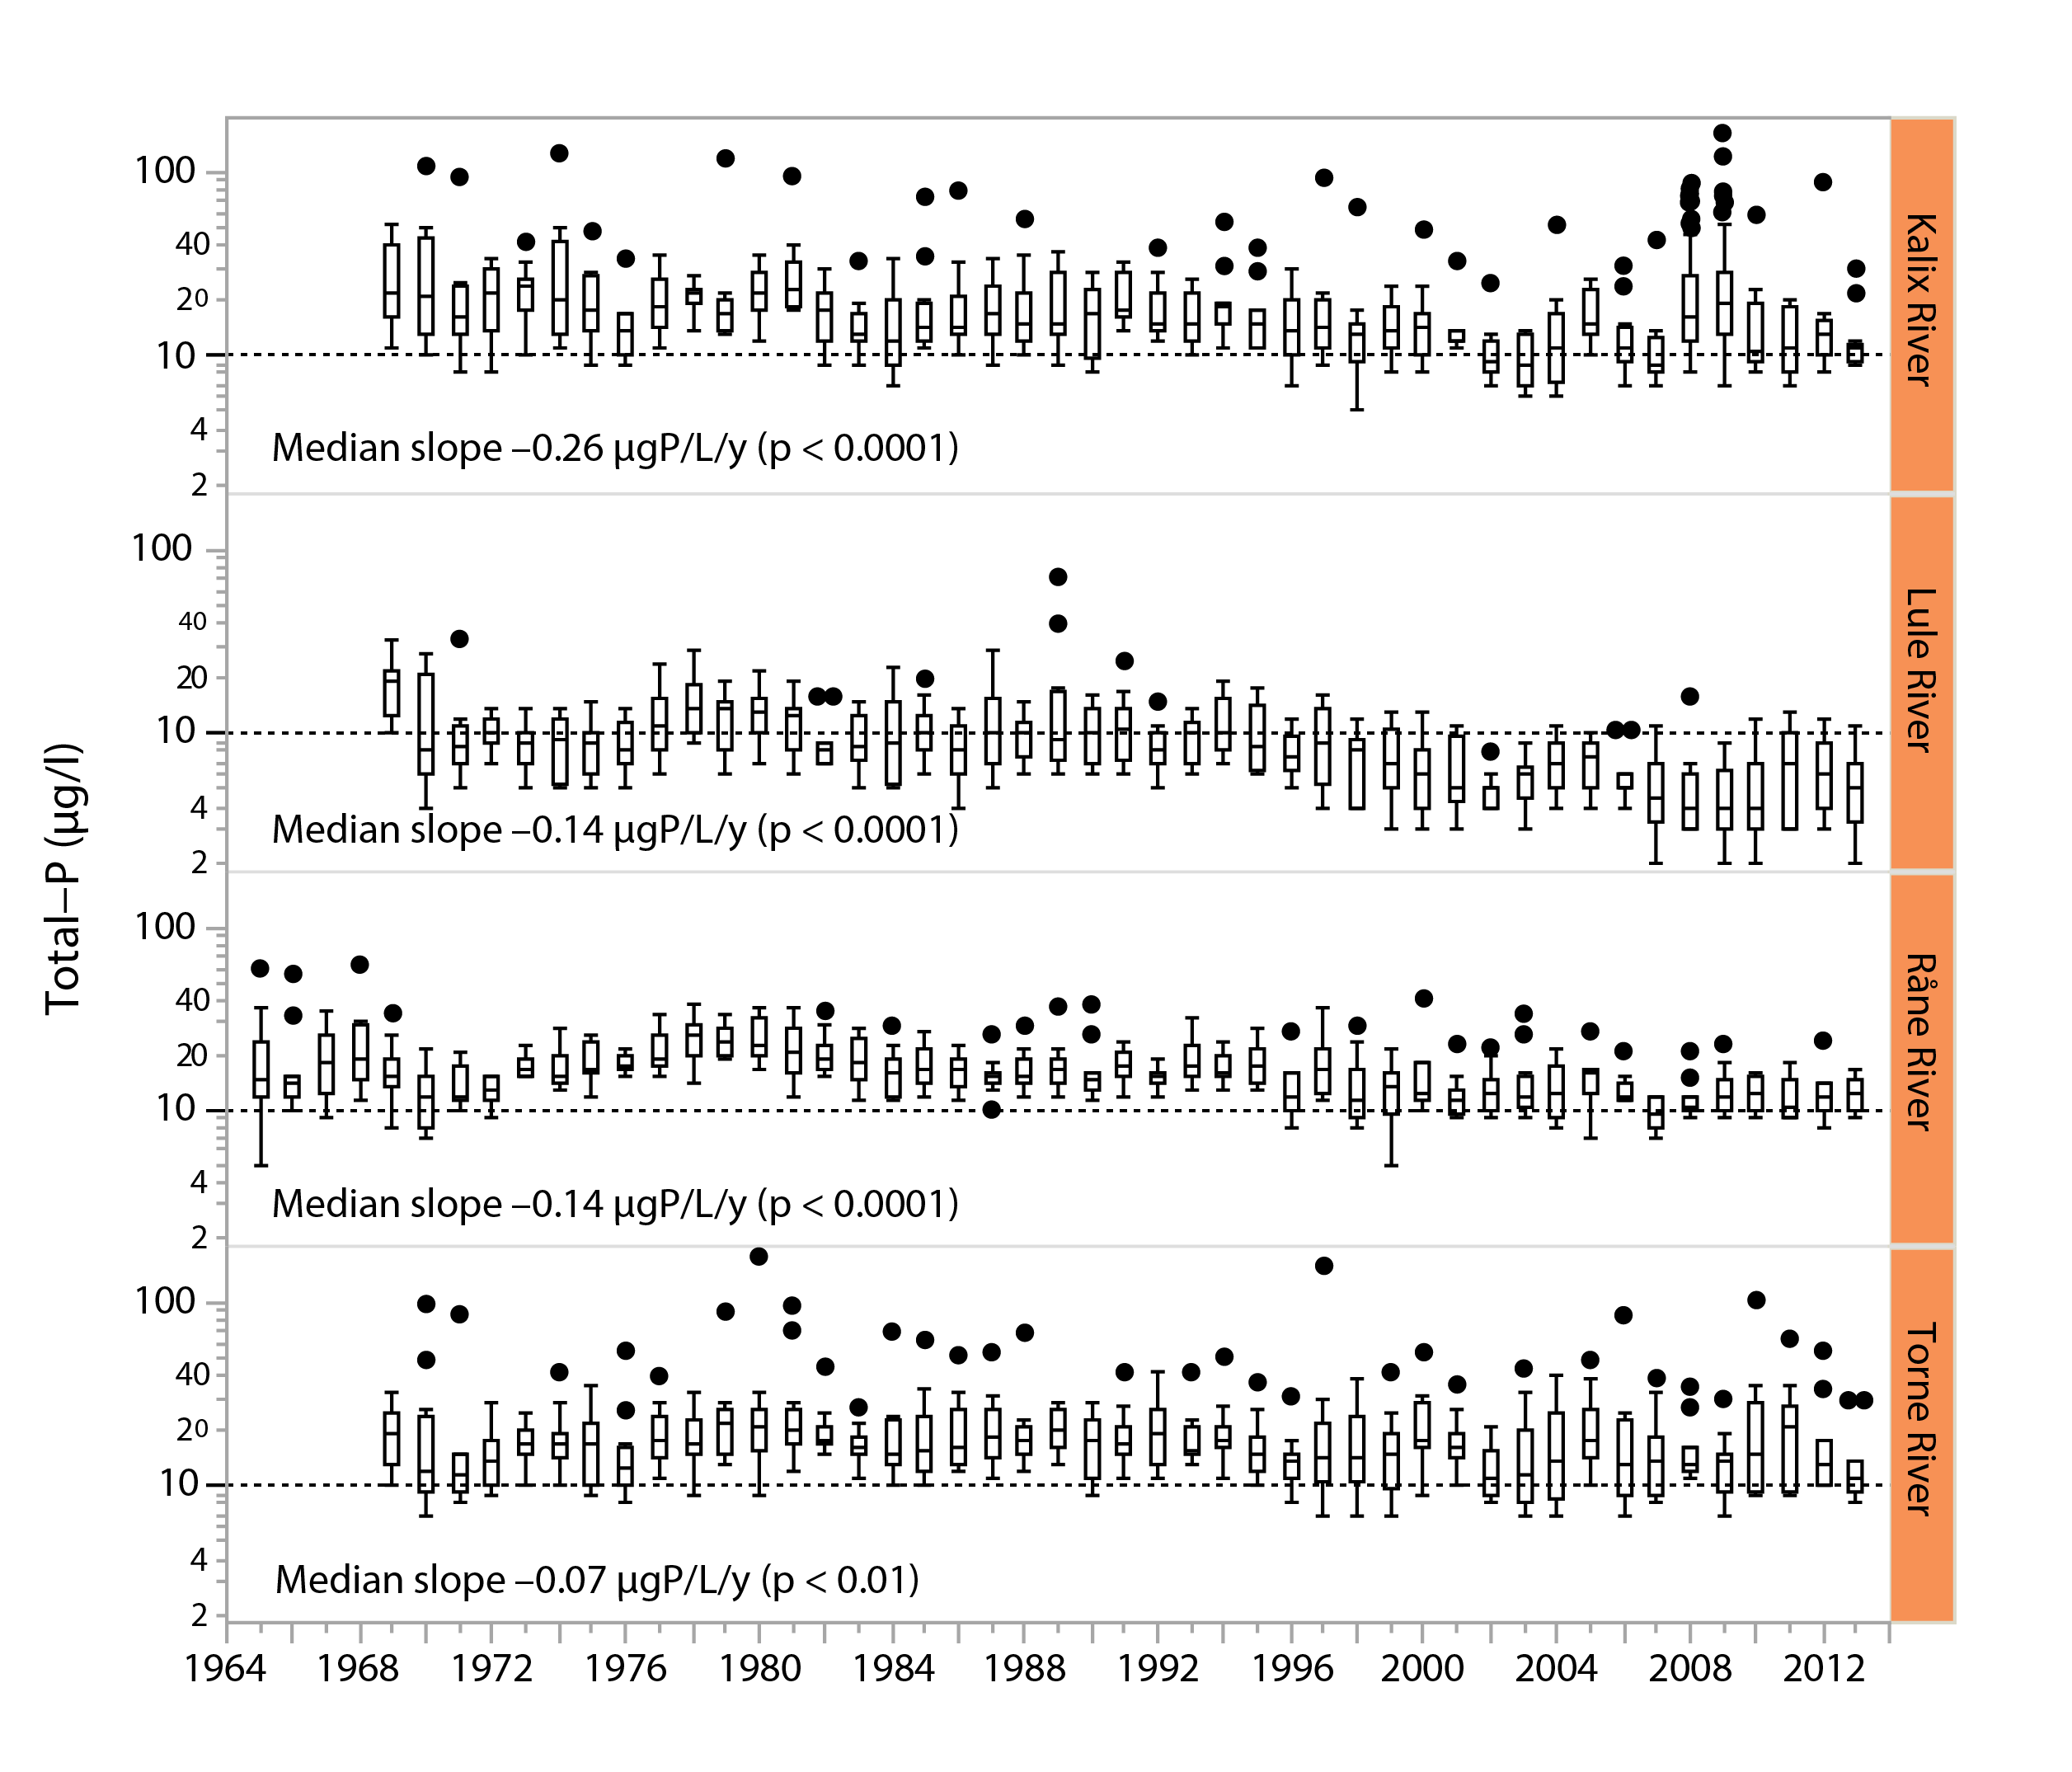
Figure 3-3 Long-term trends in total phosphorus water concentrations (μg/L) in four major, unregulated rivers that drain the subarctic Arctic/alpine ecoregion of the Scandinavian peninsula, the Kalix river, The Lule river, the Råne river, and the Torne river. Slopes and p-values are given in the different panels. Boxes indicate medians and 25th and 75th percentiles, while whiskers give the 10th and 90th percentiles. State of the Arctic Freshwater Biodiversity Report - Chapter 3 - Page 21 - Figure 3-3
-
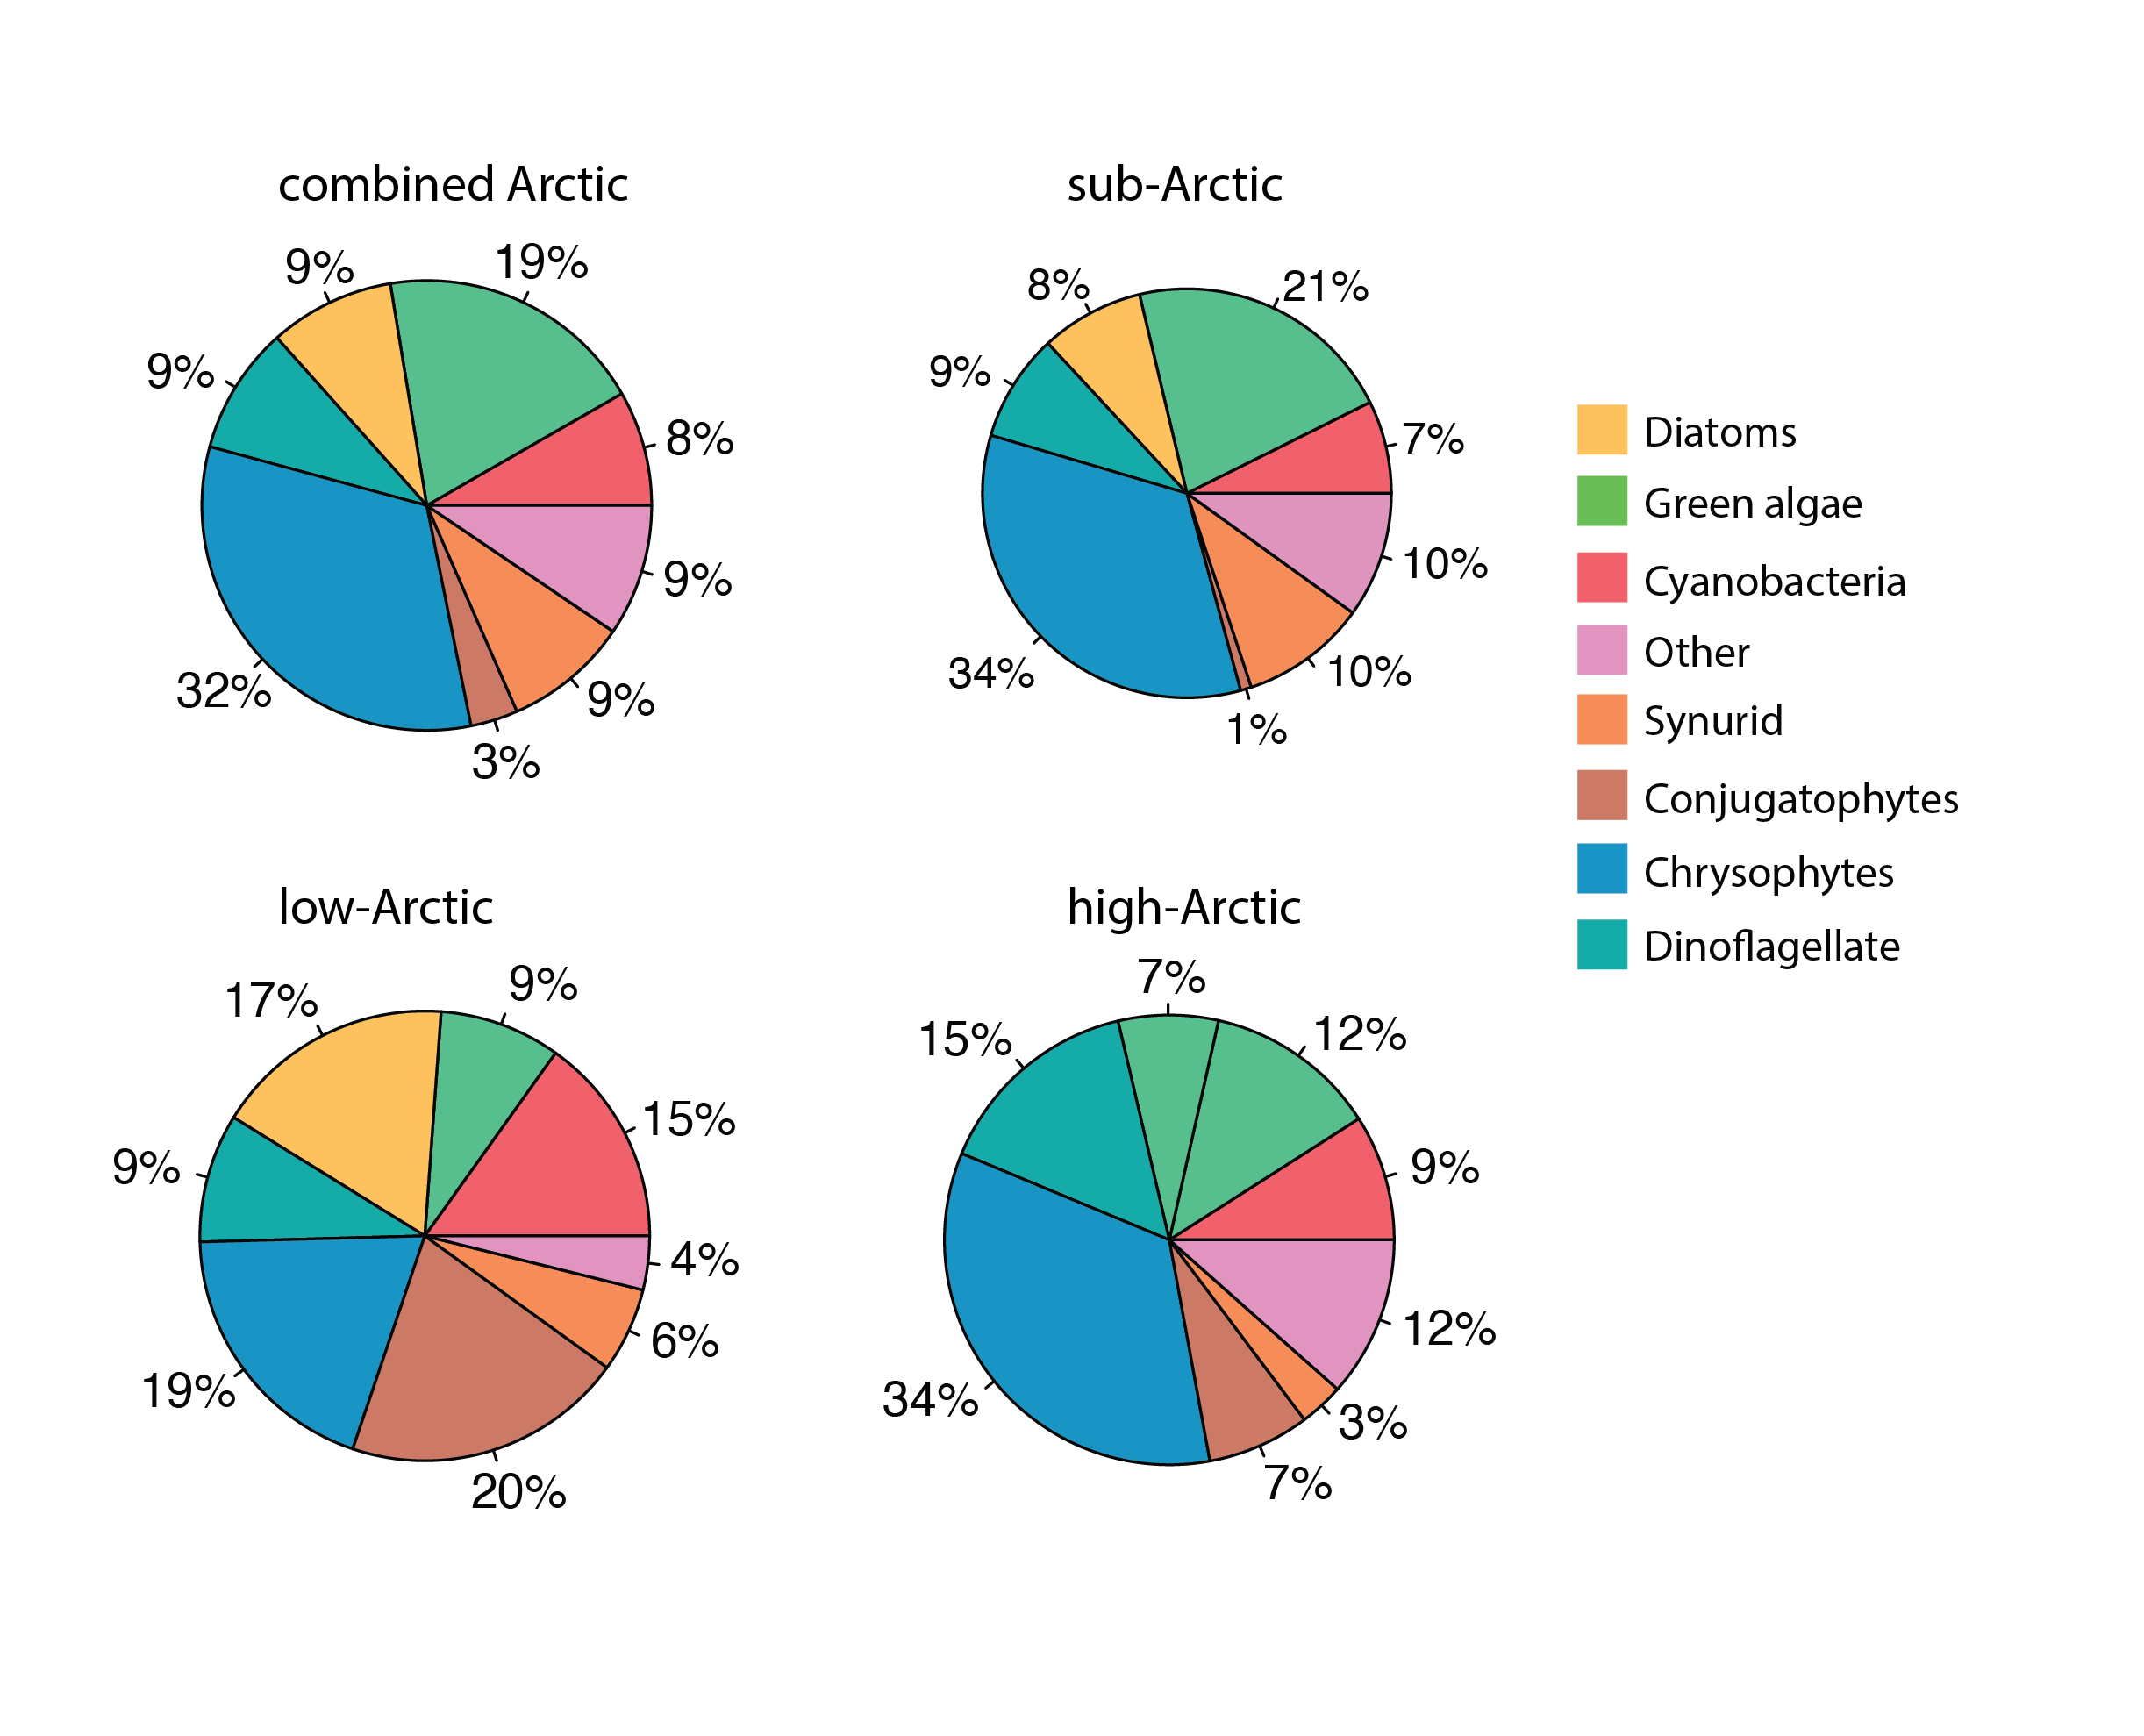
Phytoplankton percent composition by dominant classes across the three Arctic regions, using relative presence across stations calculated from from presence – absence data. State of the Arctic Freshwater Biodiversity Report - Chapter 4 - Page 48 - Figure 4-19
-
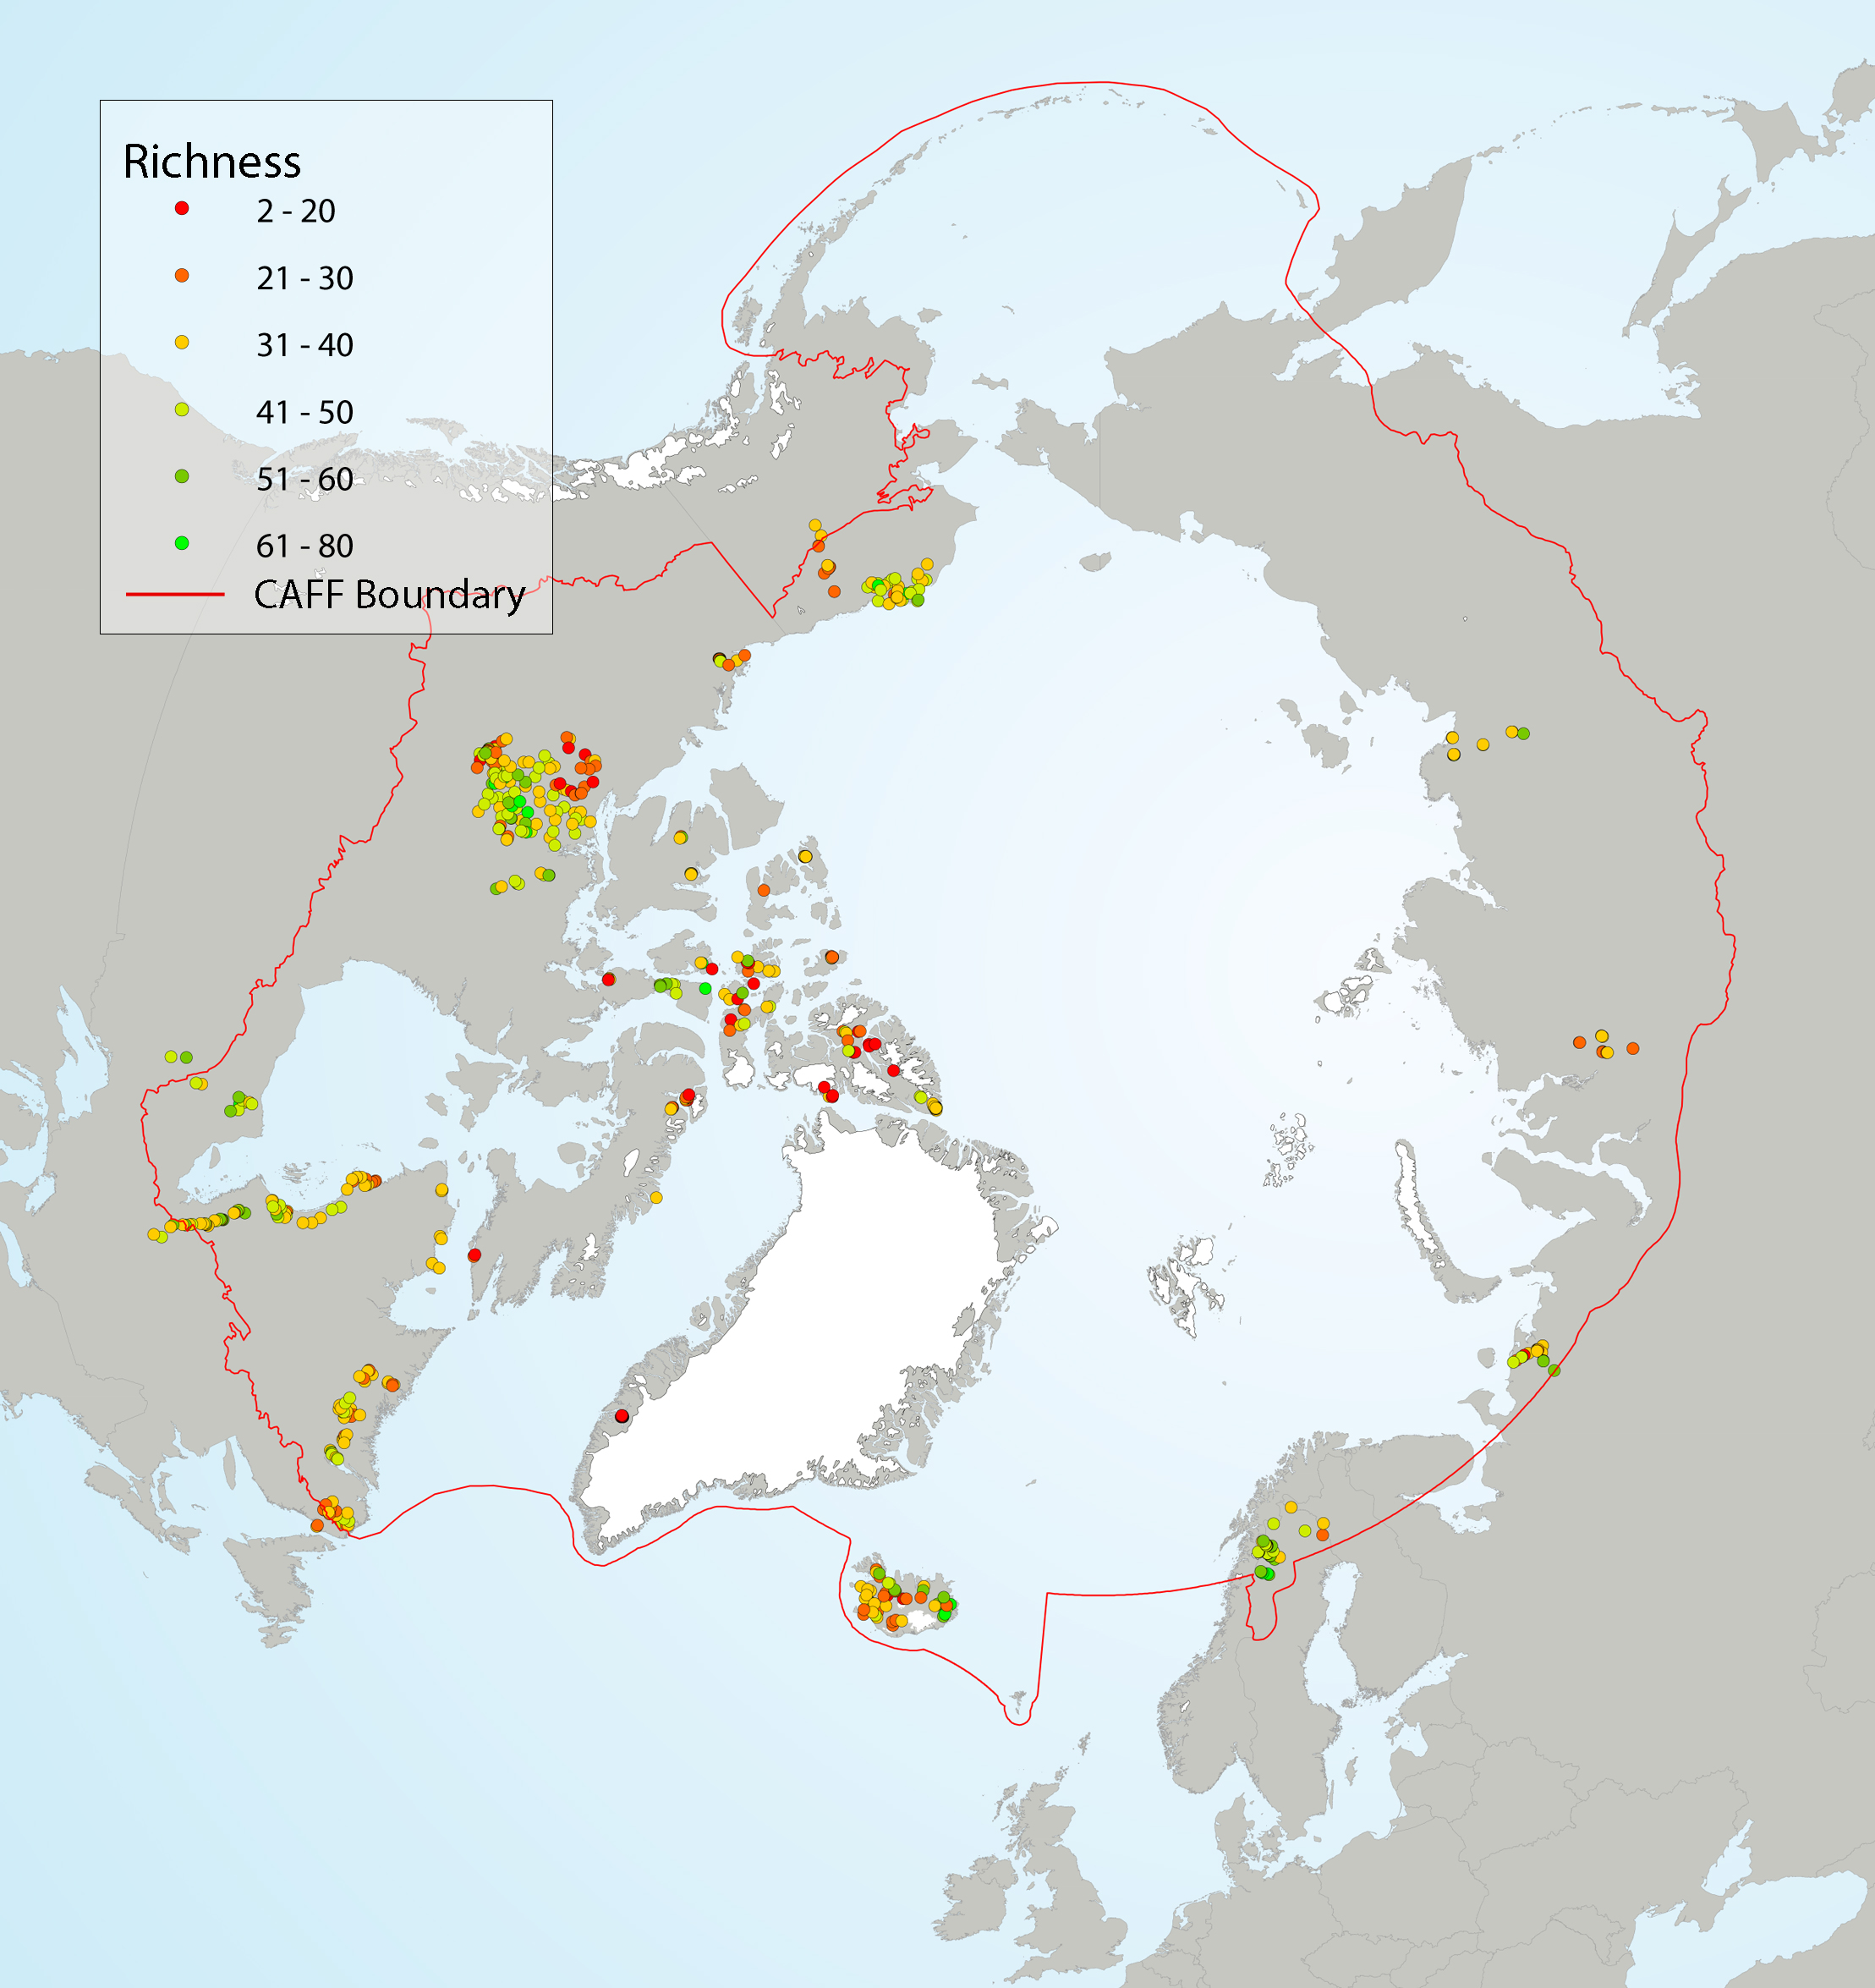
Figure 4 9 Local diatom species richness of Arctic lake surface sediments, showing (left) richness as a function of latitude, and (right) site-specific richness. A LOESS smoother (blue line) with a span of 0.75 and a 95% confidence interval (grey shading) was applied to the data (left) to better highlight the general trend. Coloured circles on the map indicate the species richness at the sampling sites. State of the Arctic Freshwater Biodiversity Report - Chapter 4 - Page 37 - Figure 4-9
-
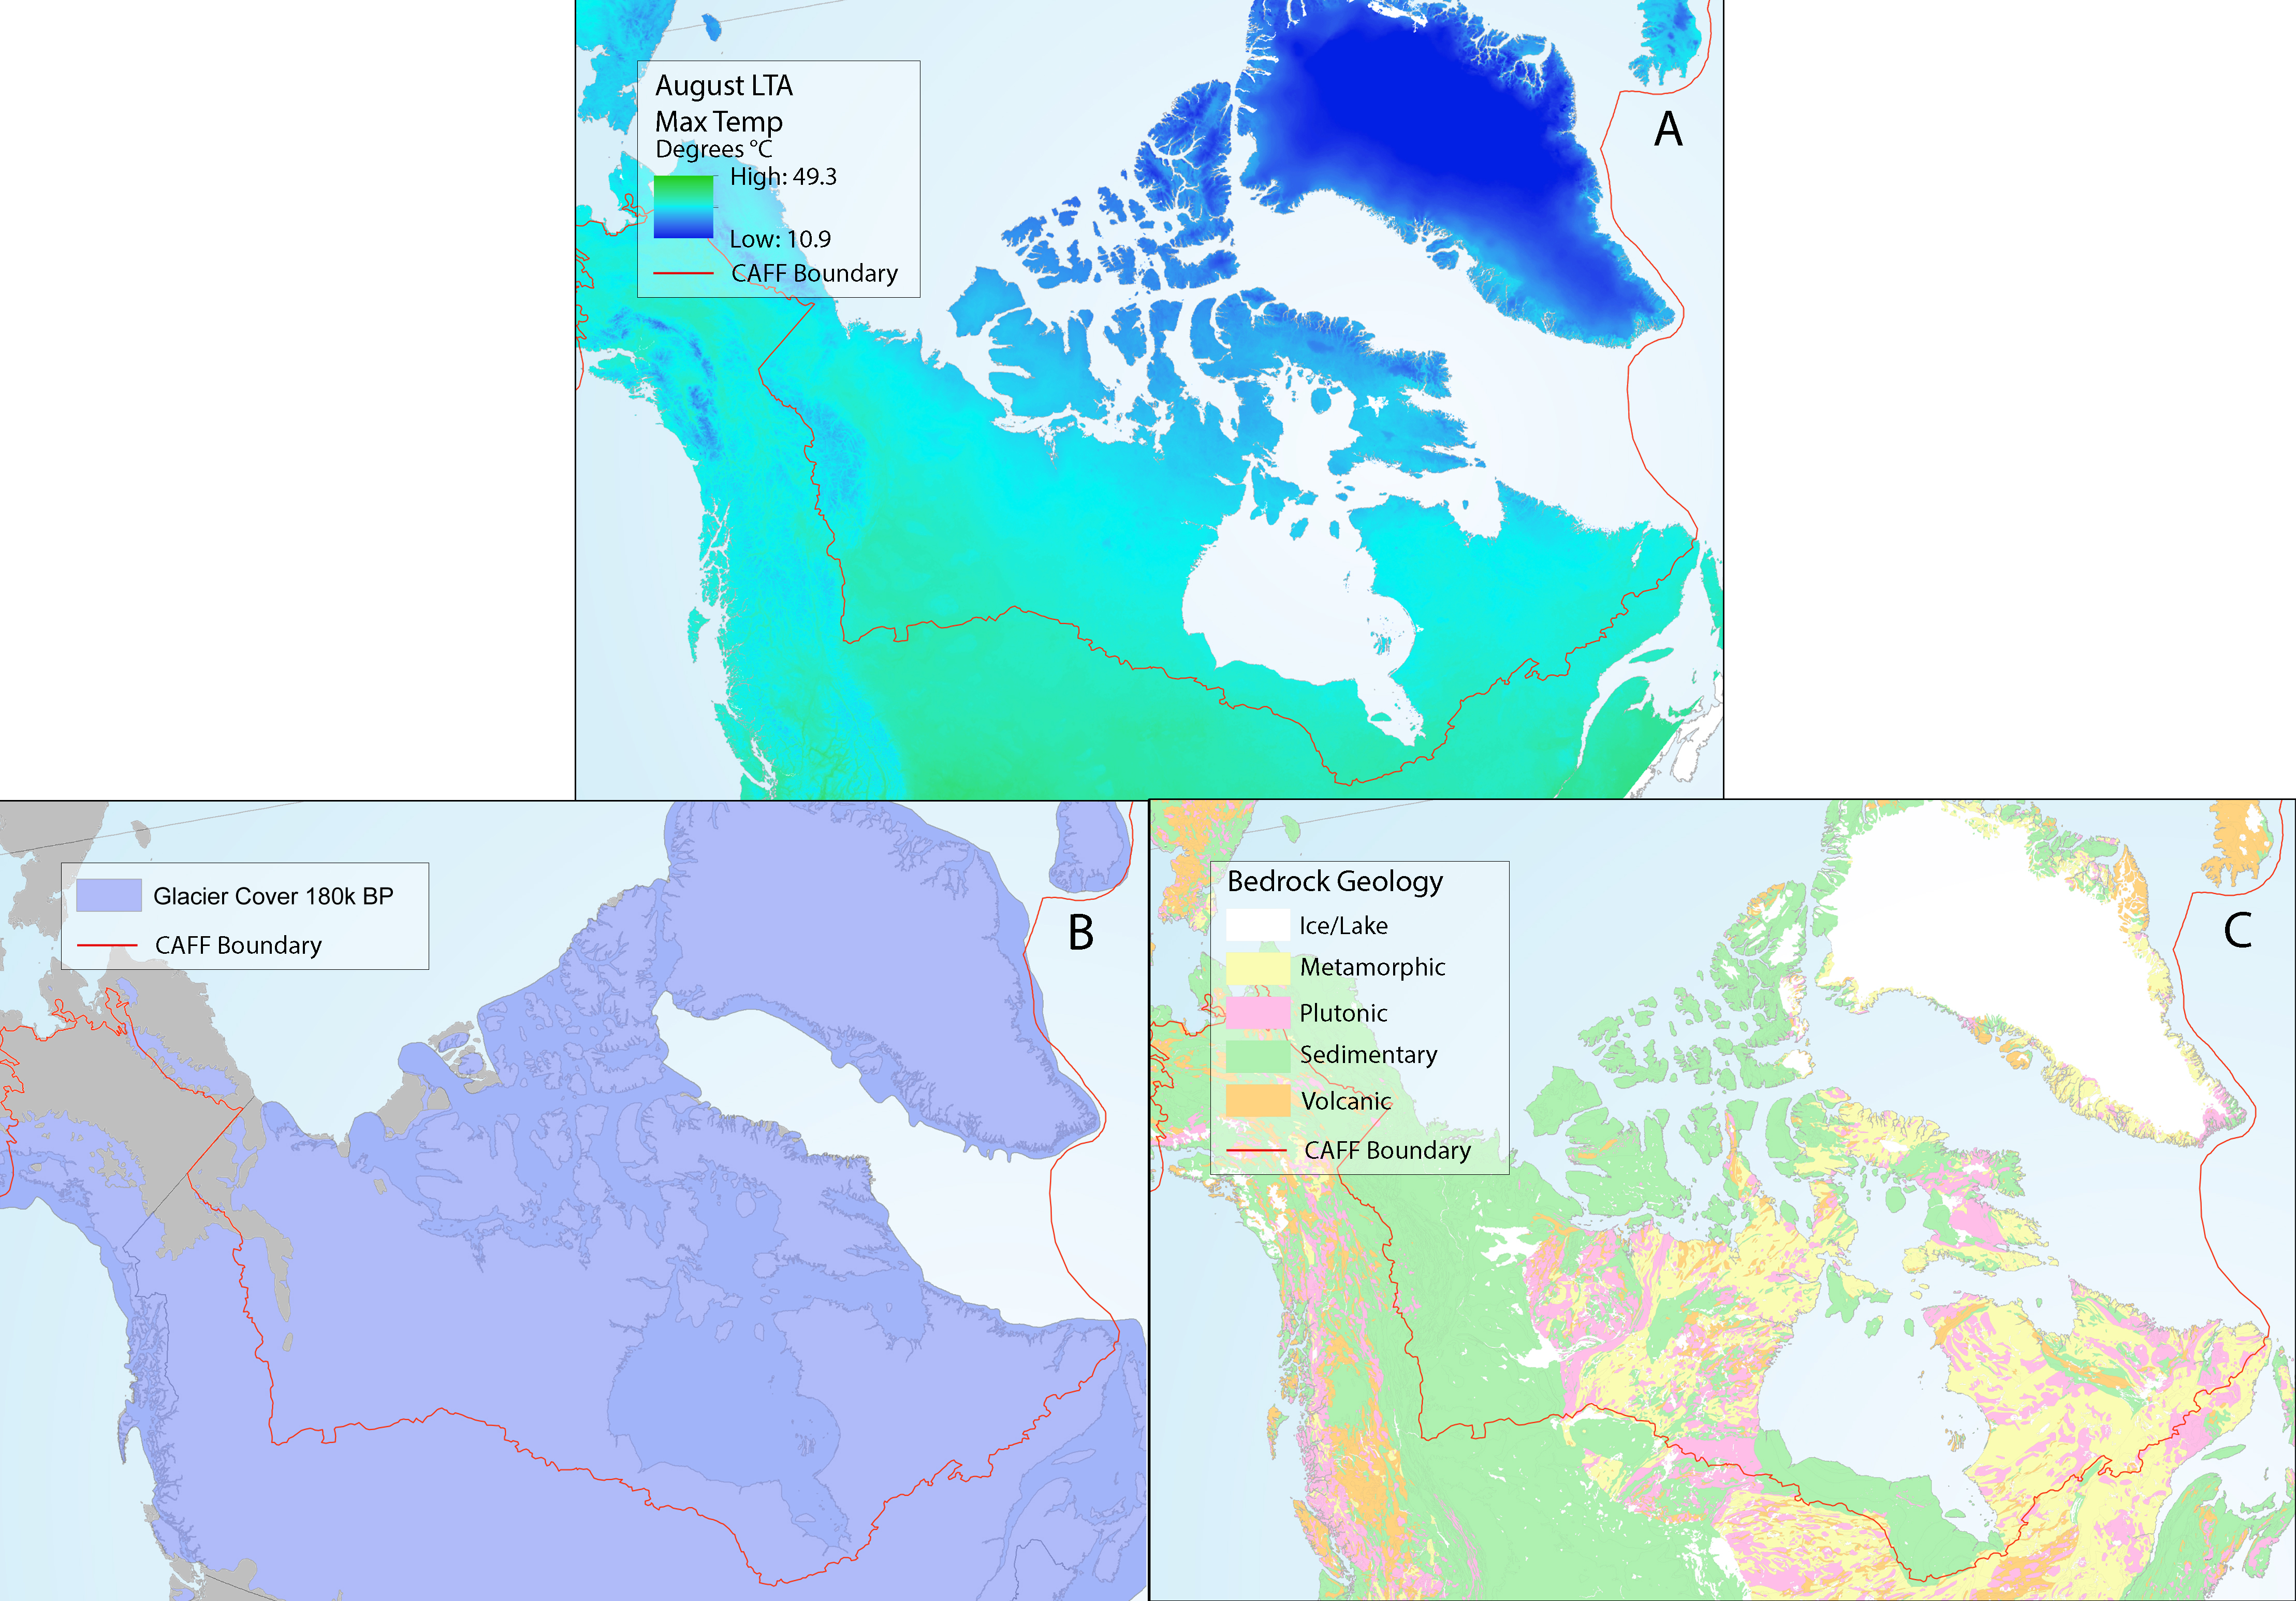
Abiotic drivers in North America, including (a) long-term average maximum August air temperature, (b) spatial distribution of ice sheets in the last glaciation of the North American Arctic region, and (c) geological setting of bedrock geology underlying North America. Panel (a) source Fick and Hijmans (2017). Panel (b) adapted from: Physical Geology by Steve Earle, freely available at http://open.bccampus.ca. Panel (c) source: Geogratis. State of the Arctic Freshwater Biodiversity Report - Chapter 5 - Page 86 - Figure 5-3
-
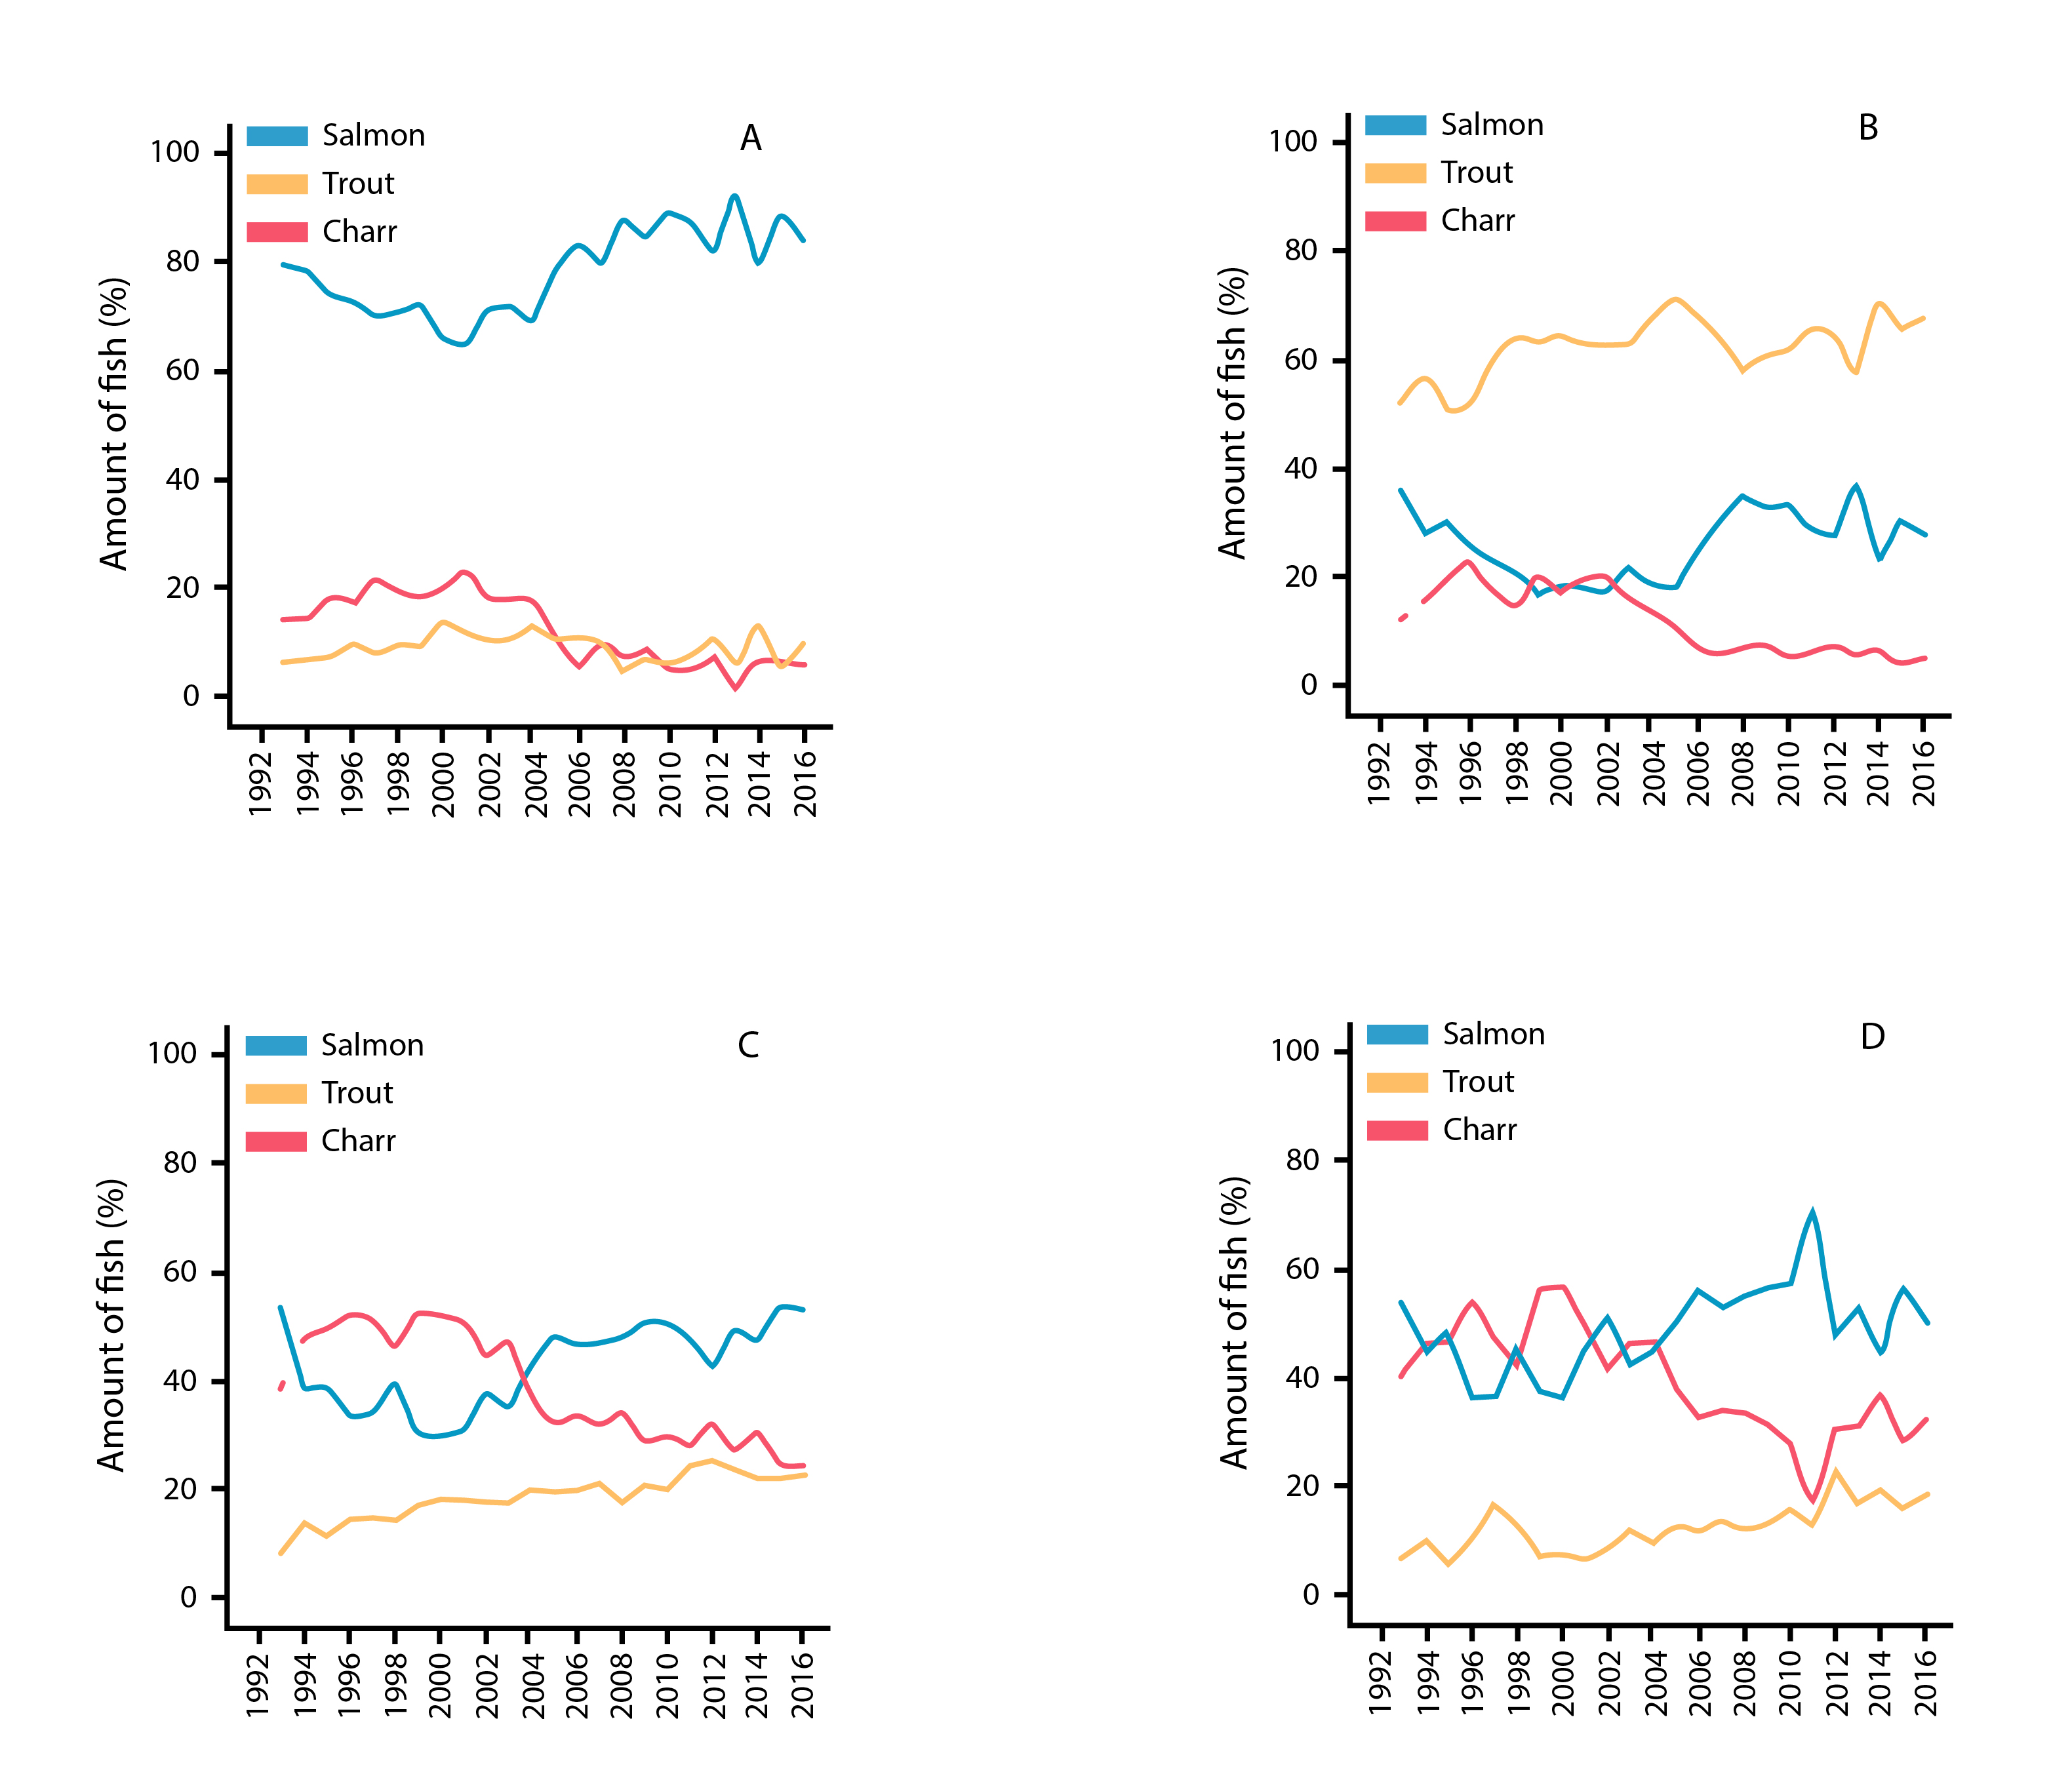
Temporal patterns in % abundance of Atlantic salmon, brown trout, and anadromous Arctic charr from catch statistics in Iceland rivers monitored from 1992 to 2016, showing results from (a) west, (b) south, (c) north, and (d) east Iceland. State of the Arctic Freshwater Biodiversity Report - Chapter 4 - Page 81 - Figure 4-41