 CAFF - Arctic Biodiversity Data Service (ABDS)
Ice algae
Type of resources
Available actions
Topics
Keywords
Contact for the resource
Provided by
Representation types
Update frequencies
status
-
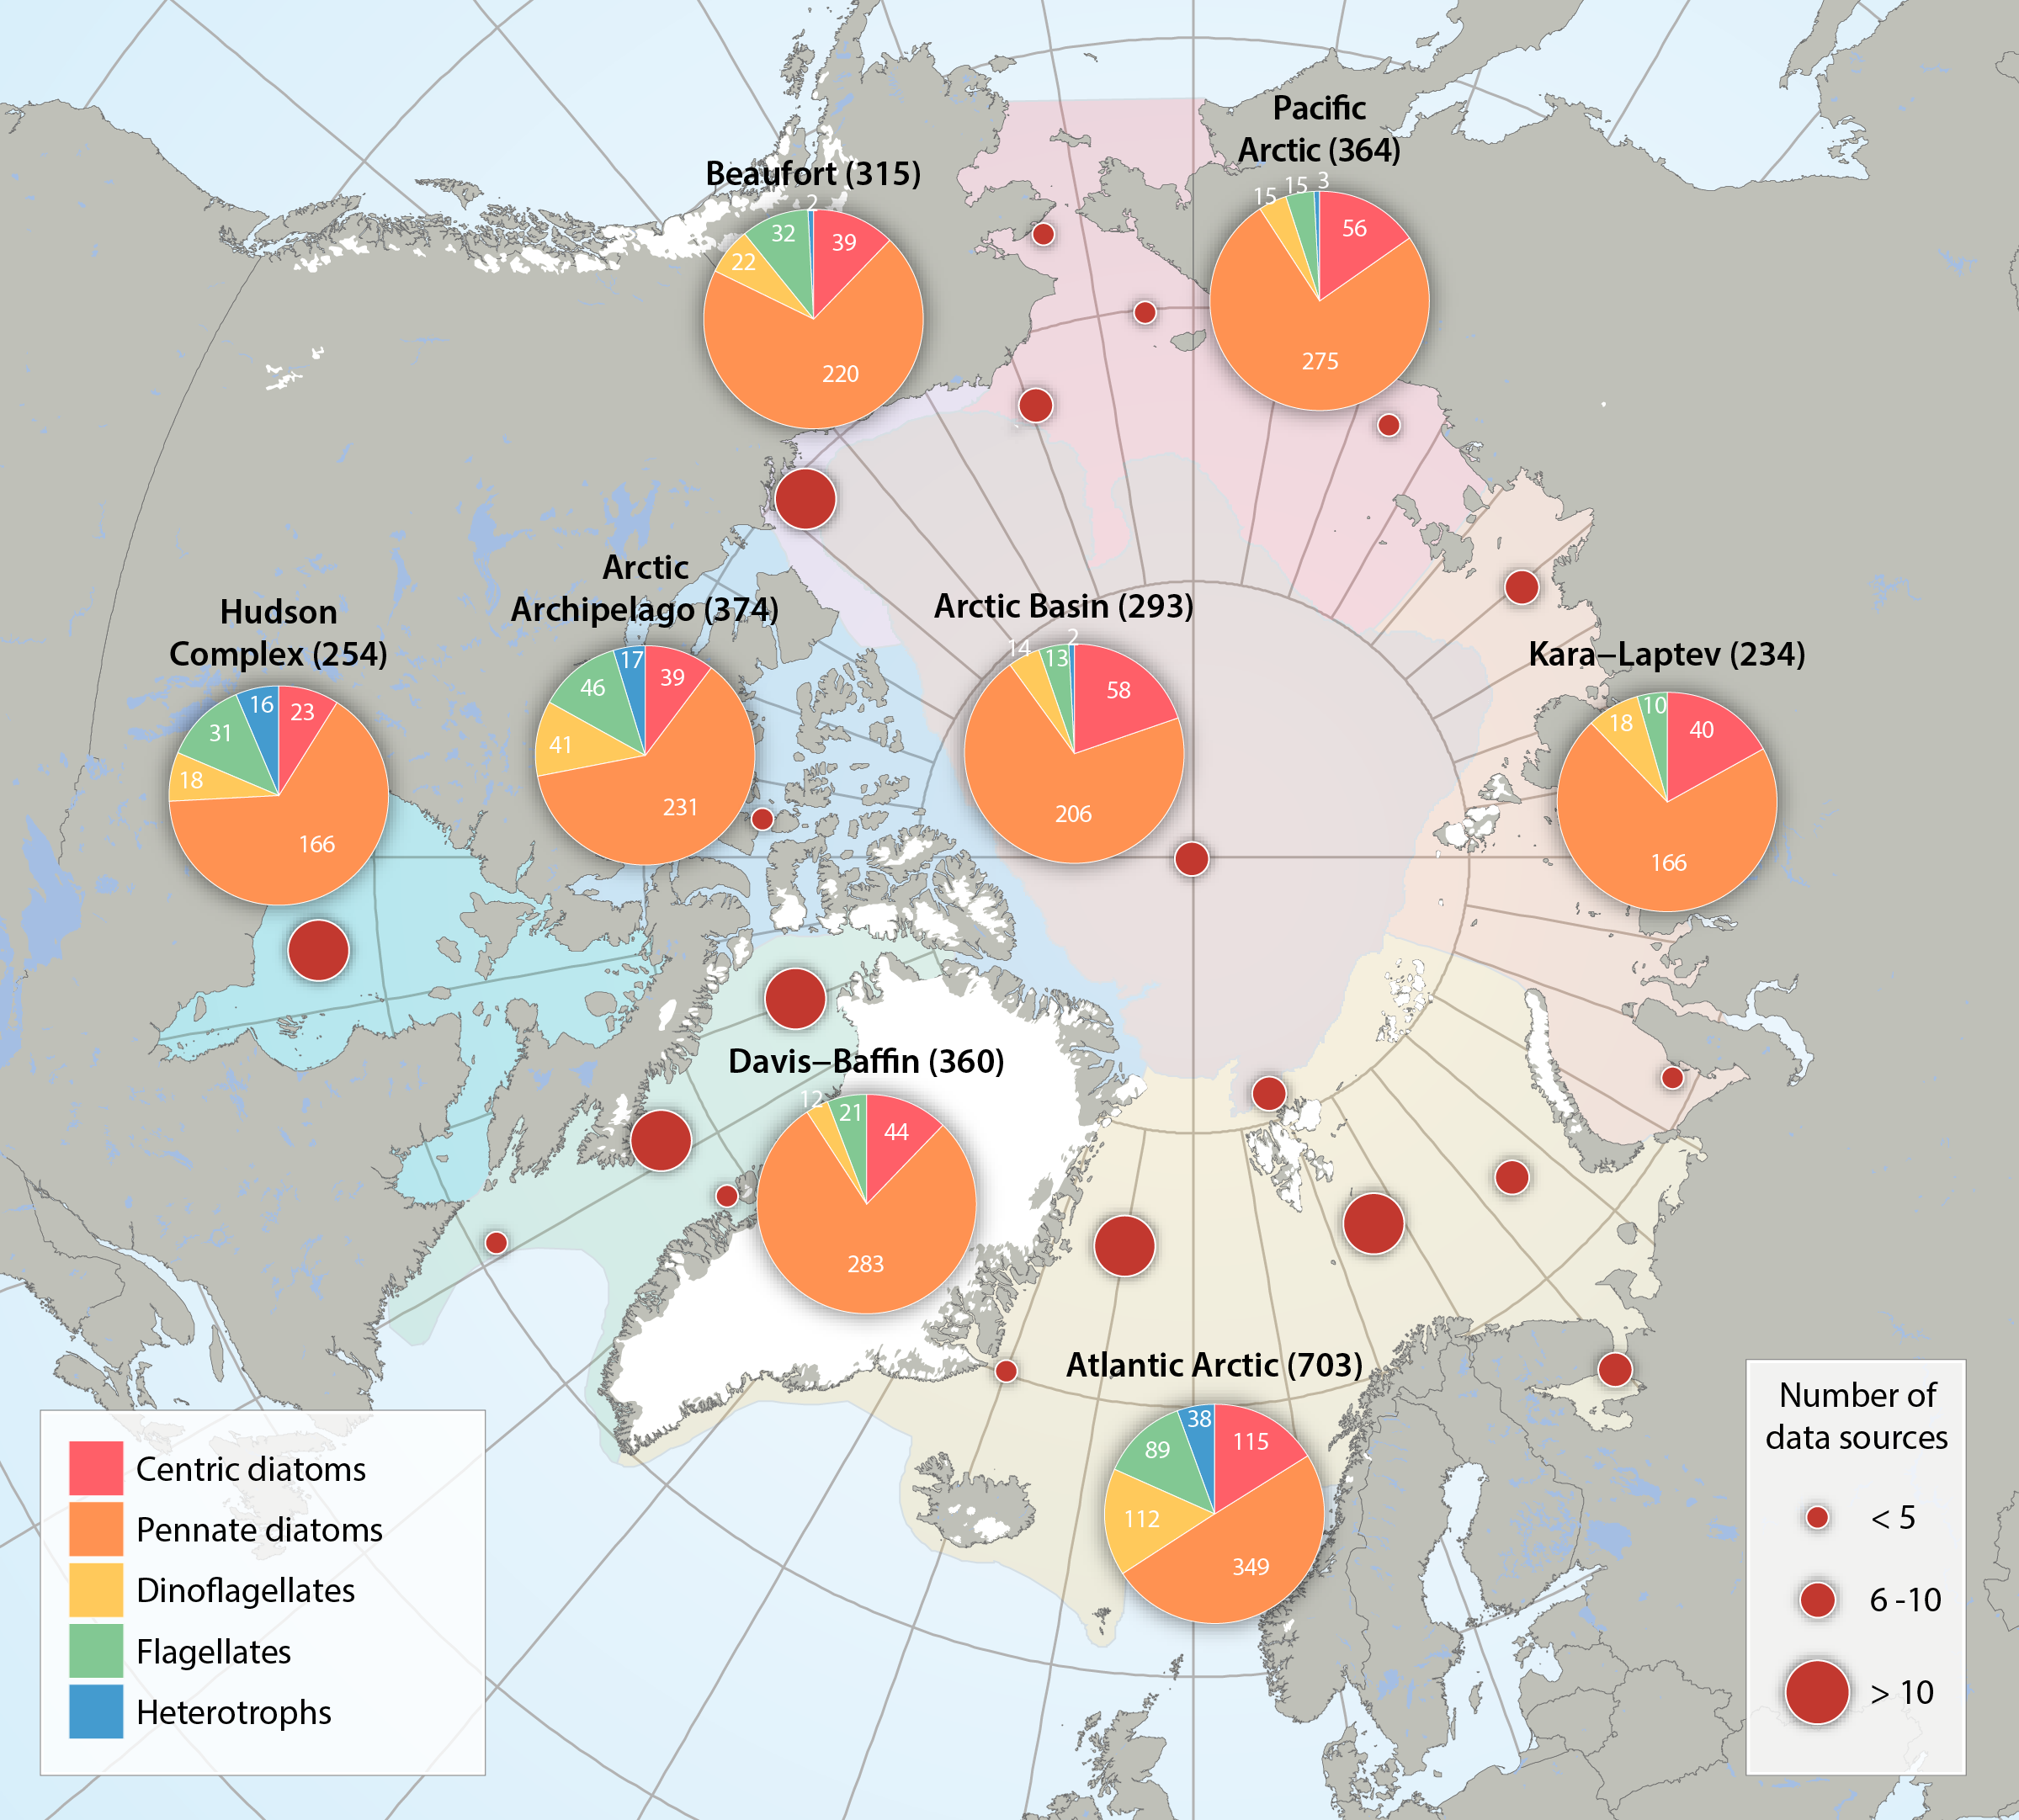
Numbers and taxonomic composition of five single-celled eukaryote groups for the regional divisions of the Arctic Marine Areas (pie charts), as well as the number of data sources reviewed across the Arctic (red circles). Total number of taxa is given in parenthesis after each region. Flagellates include: chlorophytes, chrysophytes, cryptophytes, dictyochophytes, euglenids, prasinophytes, prymnesiophytes, raphidophytes, synurales, and xanthophytes, and- for practical purposes though not flagellates - cyanophytes. Heterotrophs include: choanoflagellates, kinetoplastea, incertae sedis. Updated from Poulin et al. (2011). STATE OF THE ARCTIC MARINE BIODIVERSITY REPORT - <a href="https://arcticbiodiversity.is/findings/sea-ice-biota" target="_blank">Chapter 3</a> - Page 39- Figure 3.1.3 From the report draft: "For a pan-Arctic assessment of diversity (here defined as species richness), the first comprehensive assessments of this FEC from a few years ago (Poulin et al. 2011, Daniëls et al. 2013) have been updated for regions, with taxonomic names standardized according to the World Register of Marine Species (www.marinespecies.org). For the analysis of possible interannual trends in the ice algal community, we used a data set from the Central Arctic, the area most consistently and frequently sampled (Melnikov 2002, I. Melnikov, Shirshov Institute, unpubl. data). Multivariate community structure was analysed based on a presence-absence matrix of cores from 1980 to 2013. The analysis is biased by the varying numbers of analysed cores taken per year ranging widely from 1 to 24, ice thickness between 0.6 and 4.2 m, and including both first-year as well as multiyear sea ice. Locations included were in a bounding box within 74.9 to 90.0 °N and 179.9°W to 176.6°E and varied among years."
-
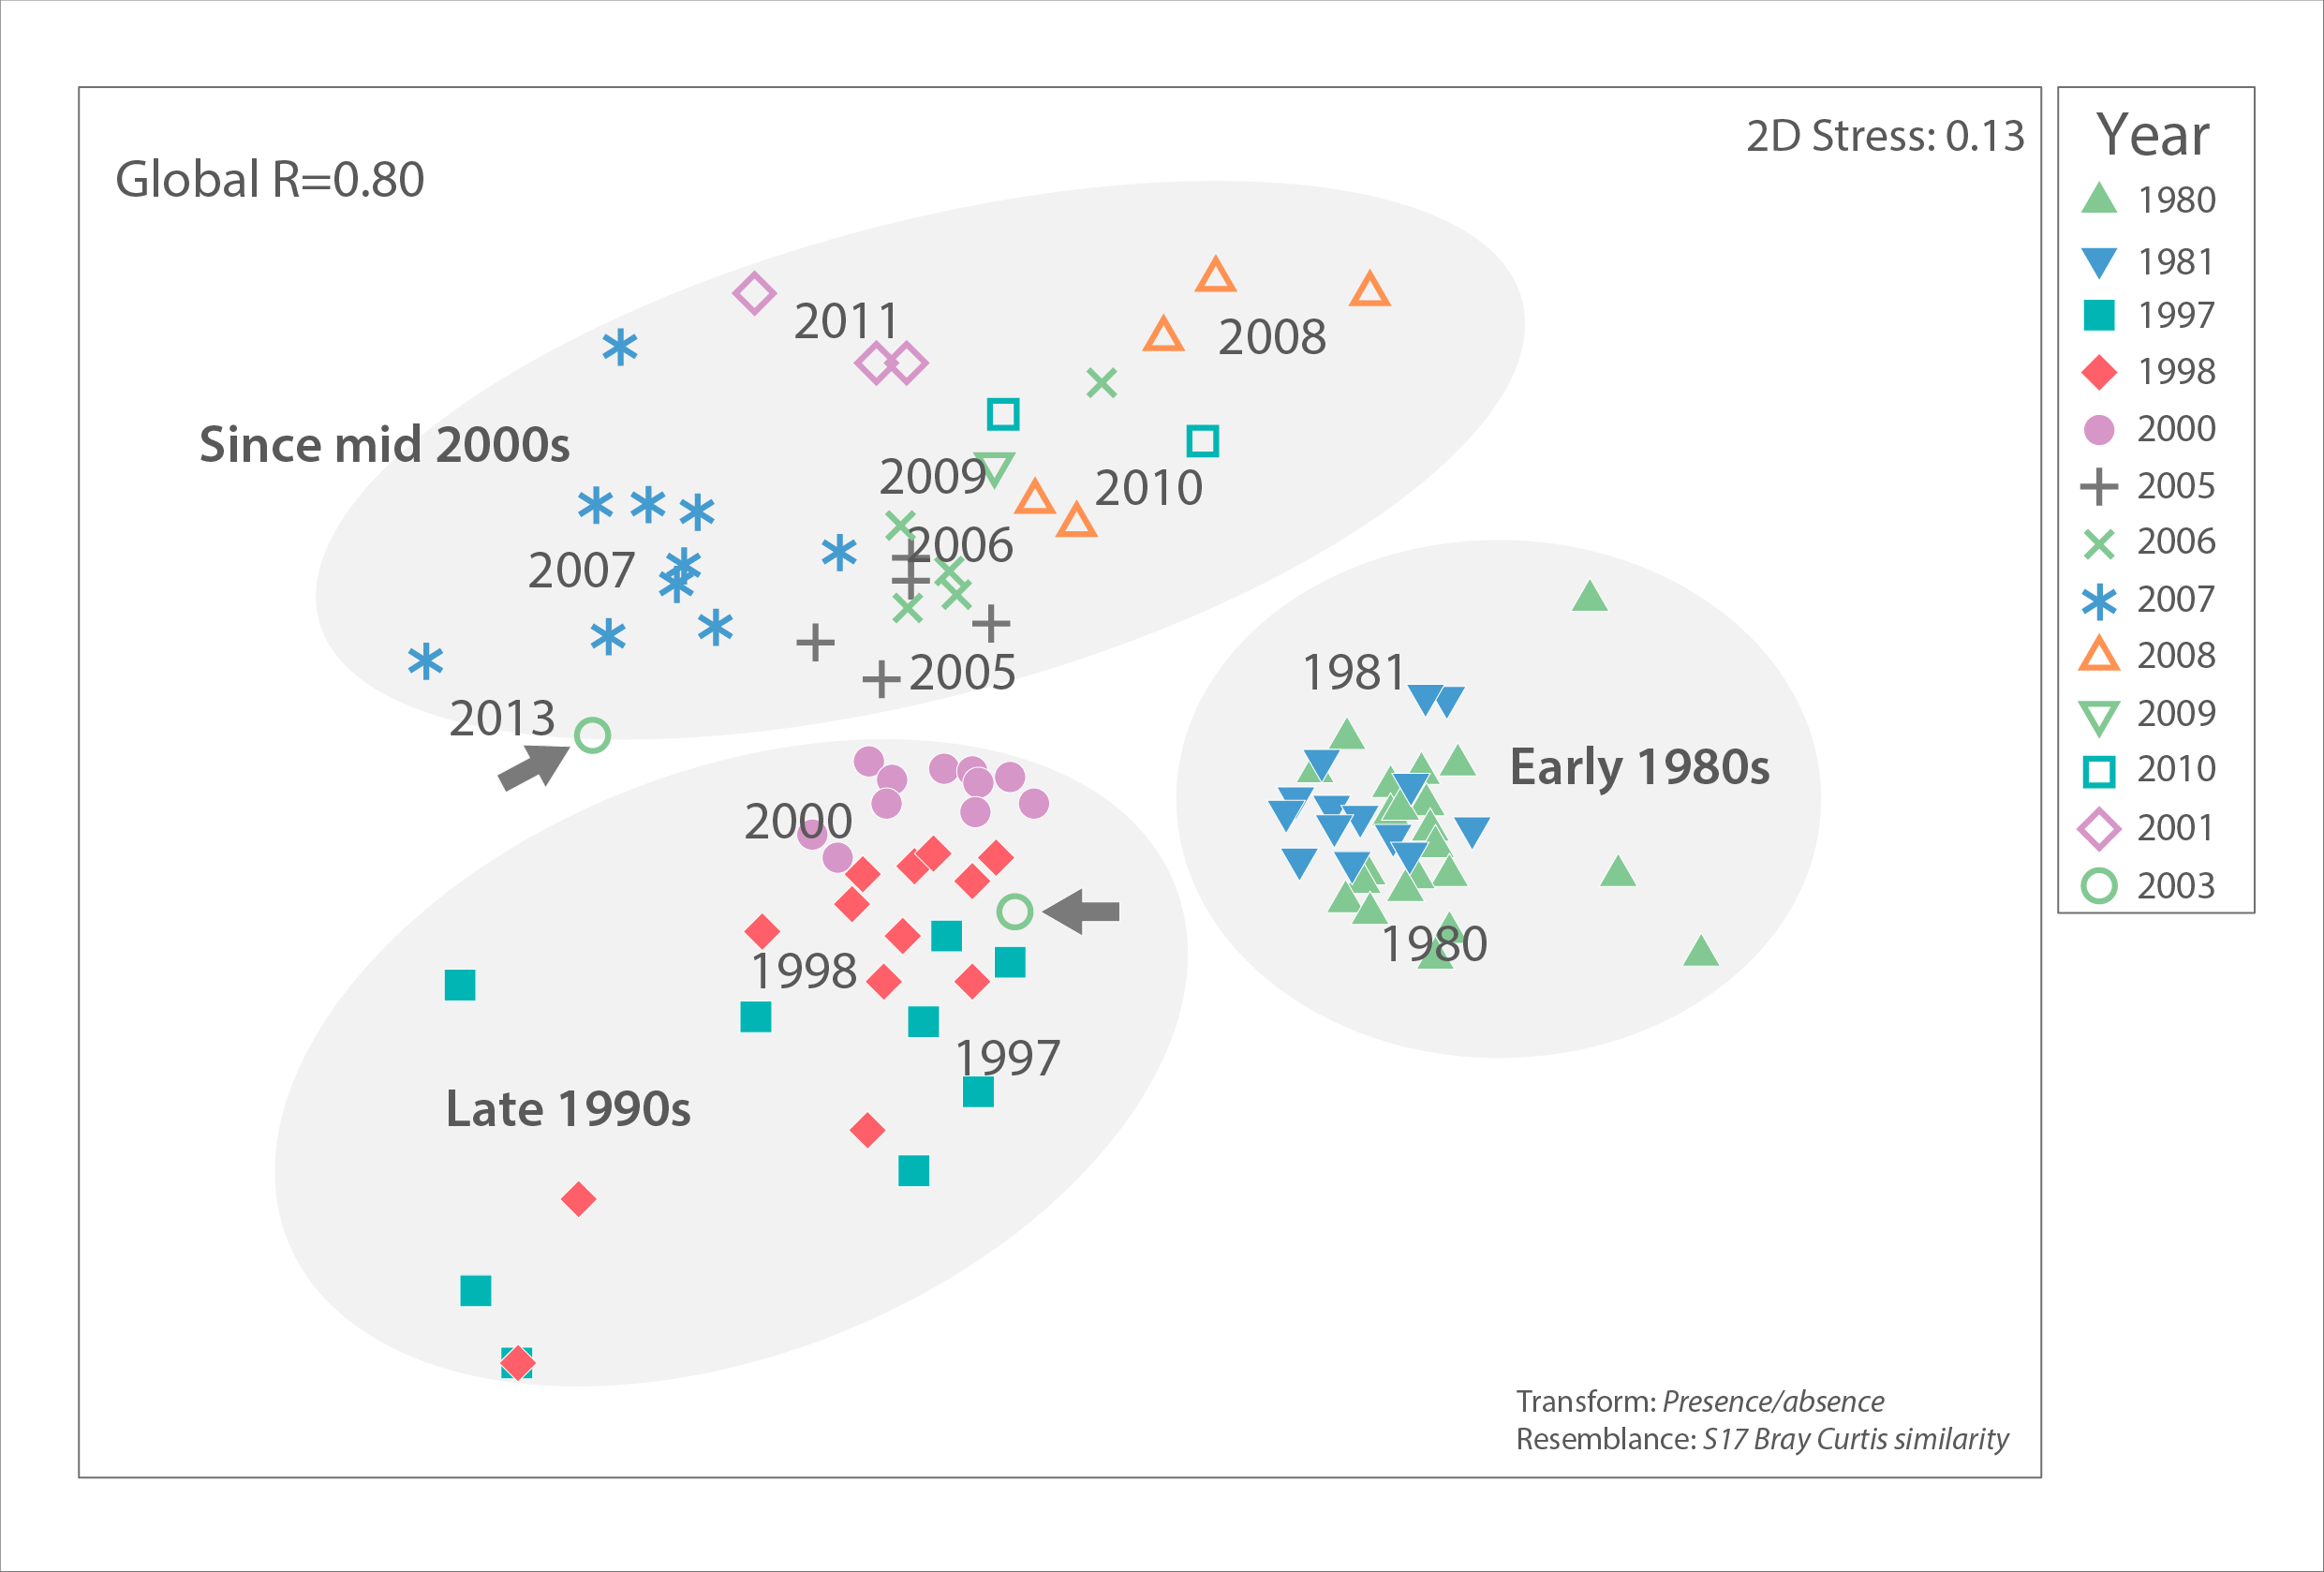
Ice algal community similarity of central Russian Arctic drifting stations from the 1980s to 2010s based on unpublished data by I.A. Melnikov, Shirshov Institute of Oceanology. The closer two samples (symbols) are to each other in this multi-dimensional scaling plot, the more similar their algal communities were, based on presence/absence of algal species. Samples from the same year tend to be similar and group together on the plot, with some exceptions. Dispersion across the plot suggests that community structure has changed over the decades, although sampling locations in the central Arctic have also shifted, thus introducing bias. An analysis of similarity (PRIMER version 6) with a high Global R=0.80 indicates strong community difference among decades (global R=0 indicates no difference, R=1 indicates complete dissimilarity). Regional differences were low (global R=0.26) and difference by ice type moderate (global R=0.38). Grey arrows point to the very different and only two samples from 2013. STATE OF THE ARCTIC MARINE BIODIVERSITY REPORT - <a href="https://arcticbiodiversity.is/findings/sea-ice-biota" target="_blank">Chapter 3</a> - Page 47 - Figure 3.1.8 "For the analysis of possible interannual trends in the ice algal community, we used a data set from the Central Arctic, the area most consistently and frequently sampled (Melnikov 2002, I. Melnikov, Shirshov Institute, unpubl. data). Multivariate community structure was analysed based on a presence-absence matrix of cores from 1980 to 2013. The analysis is biased by the varying numbers of analysed cores taken per year ranging widely from 1 to 24, ice thickness between 0.6 and 4.2 m, and including both first-year as well as multiyear sea ice. Locations included were in a bounding box within 74.9 to 90.0 °N and 179.9°W to 176.6°E and varied among years."