 CAFF - Arctic Biodiversity Data Service (ABDS)
inter-annual
Type of resources
Available actions
Topics
Keywords
Contact for the resource
Provided by
Representation types
Update frequencies
status
-
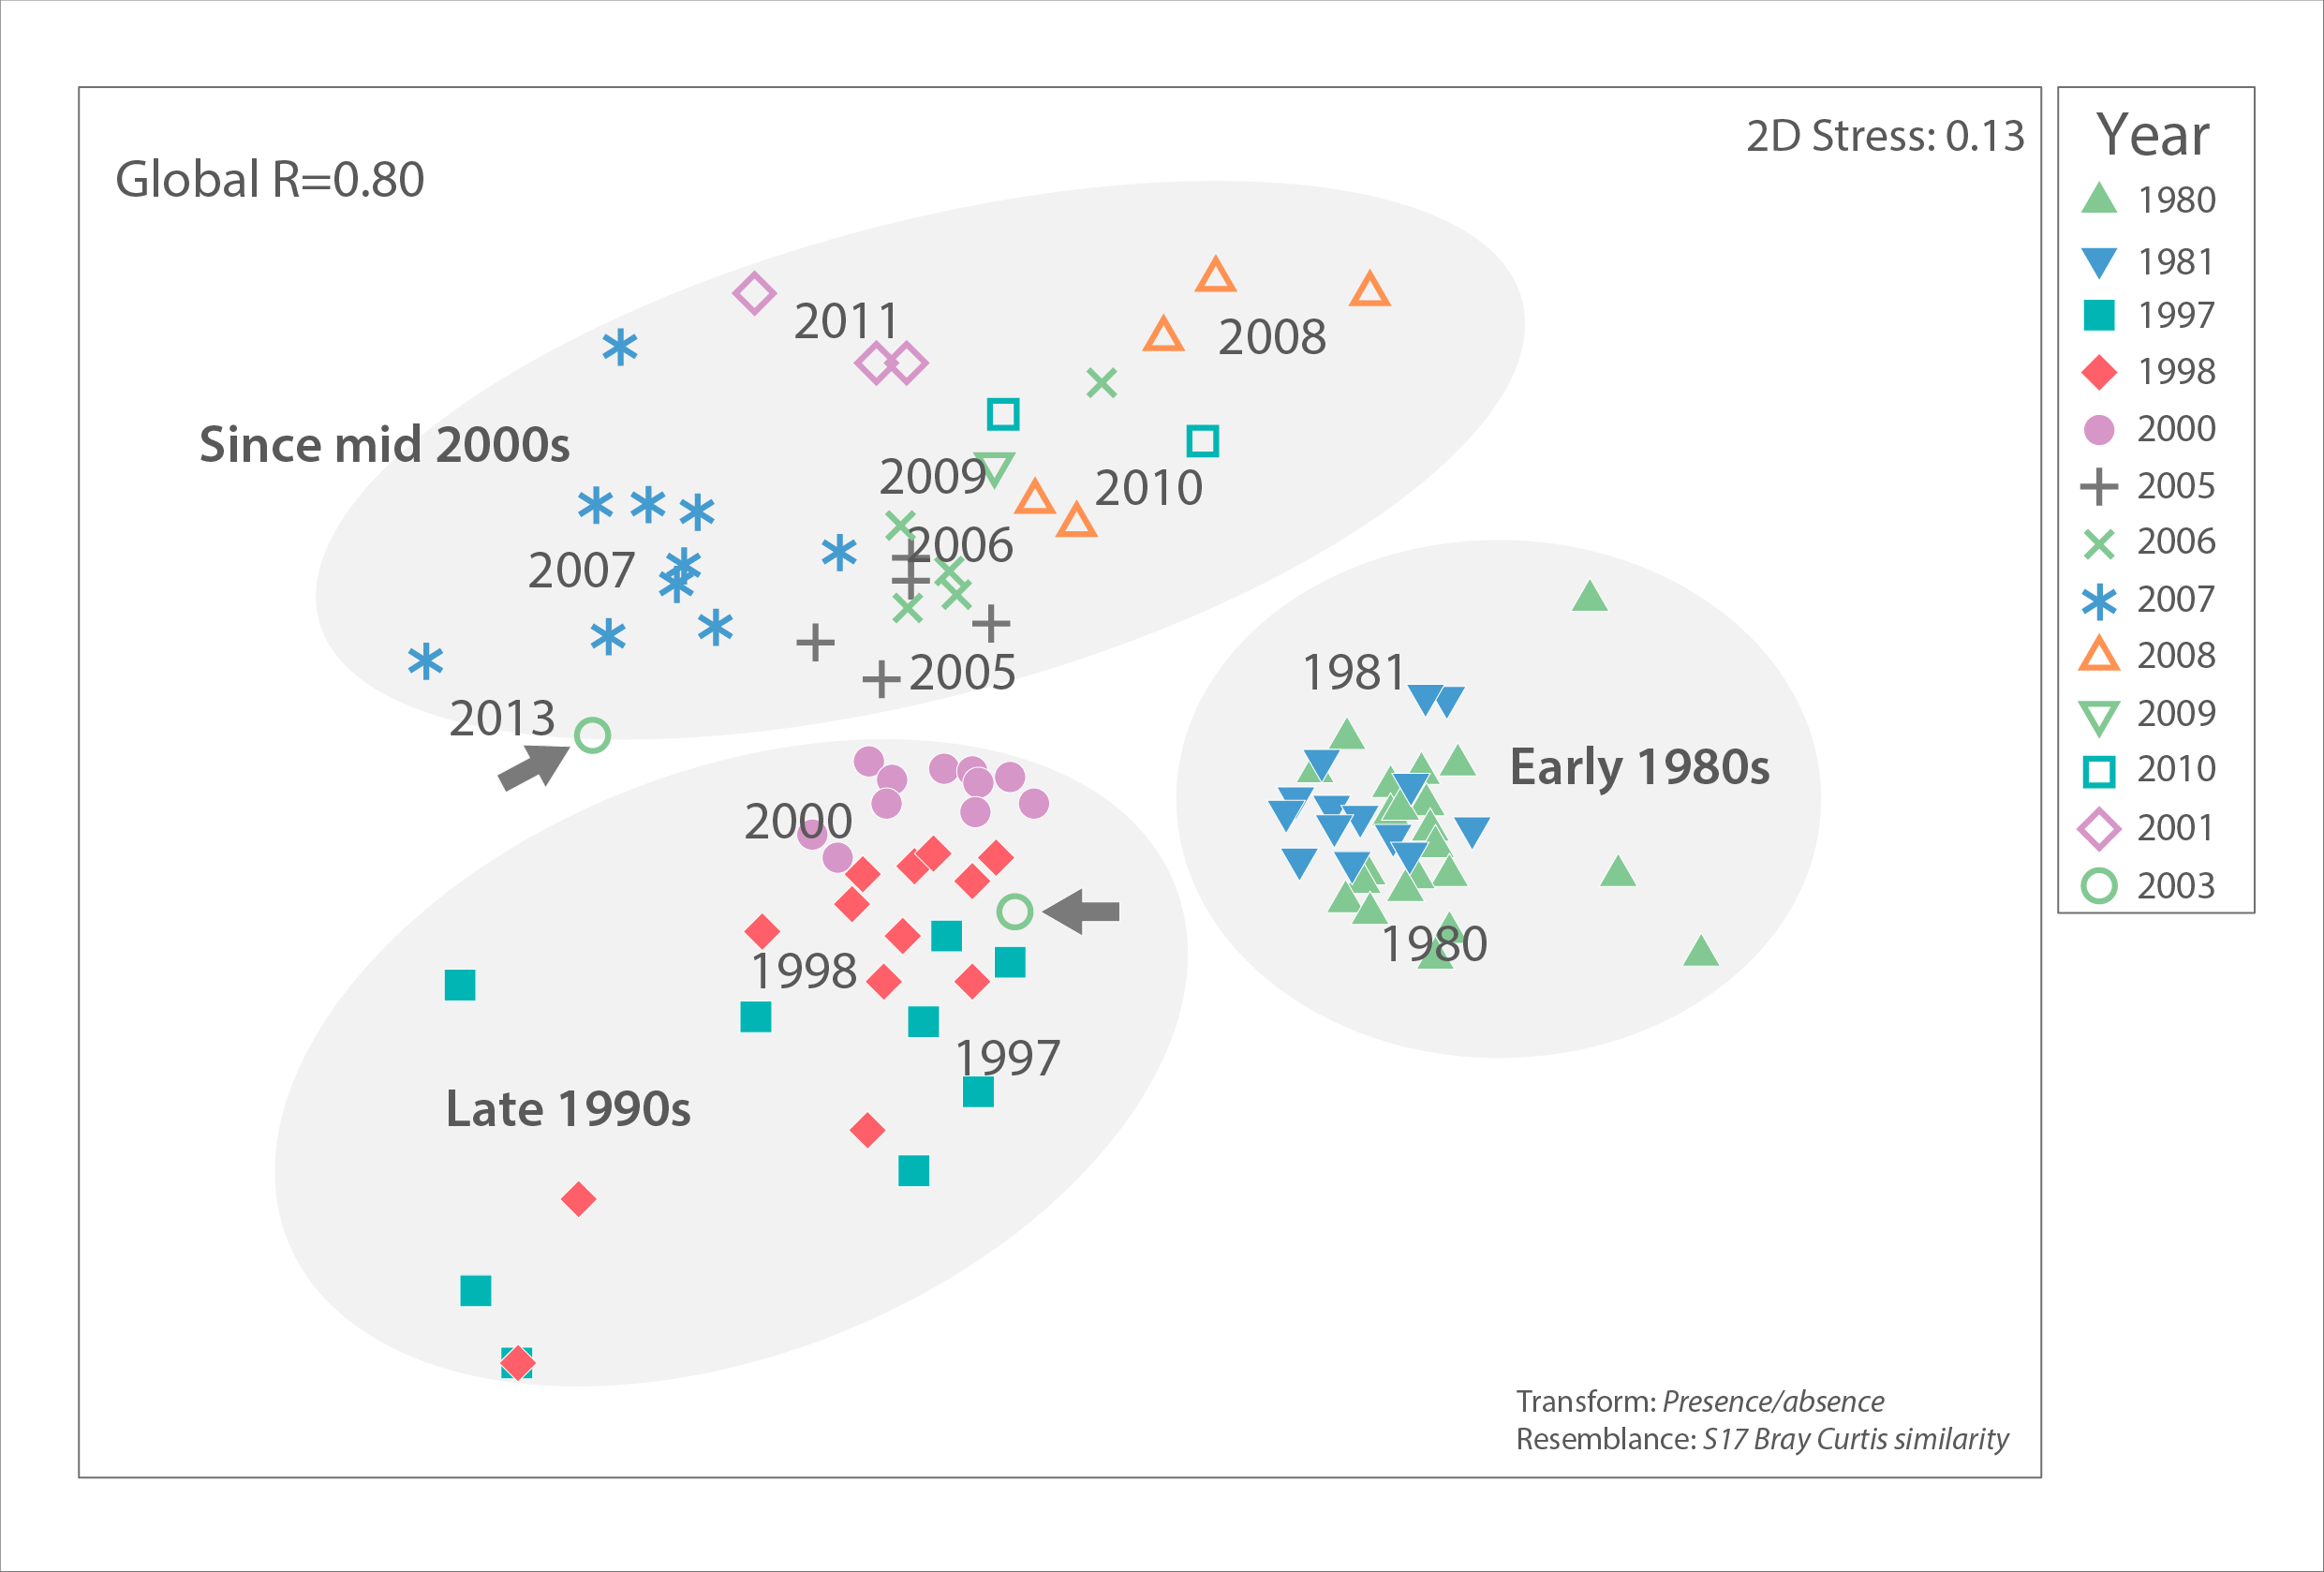
Ice algal community similarity of central Russian Arctic drifting stations from the 1980s to 2010s based on unpublished data by I.A. Melnikov, Shirshov Institute of Oceanology. The closer two samples (symbols) are to each other in this multi-dimensional scaling plot, the more similar their algal communities were, based on presence/absence of algal species. Samples from the same year tend to be similar and group together on the plot, with some exceptions. Dispersion across the plot suggests that community structure has changed over the decades, although sampling locations in the central Arctic have also shifted, thus introducing bias. An analysis of similarity (PRIMER version 6) with a high Global R=0.80 indicates strong community difference among decades (global R=0 indicates no difference, R=1 indicates complete dissimilarity). Regional differences were low (global R=0.26) and difference by ice type moderate (global R=0.38). Grey arrows point to the very different and only two samples from 2013. STATE OF THE ARCTIC MARINE BIODIVERSITY REPORT - <a href="https://arcticbiodiversity.is/findings/sea-ice-biota" target="_blank">Chapter 3</a> - Page 47 - Figure 3.1.8 "For the analysis of possible interannual trends in the ice algal community, we used a data set from the Central Arctic, the area most consistently and frequently sampled (Melnikov 2002, I. Melnikov, Shirshov Institute, unpubl. data). Multivariate community structure was analysed based on a presence-absence matrix of cores from 1980 to 2013. The analysis is biased by the varying numbers of analysed cores taken per year ranging widely from 1 to 24, ice thickness between 0.6 and 4.2 m, and including both first-year as well as multiyear sea ice. Locations included were in a bounding box within 74.9 to 90.0 °N and 179.9°W to 176.6°E and varied among years."
-
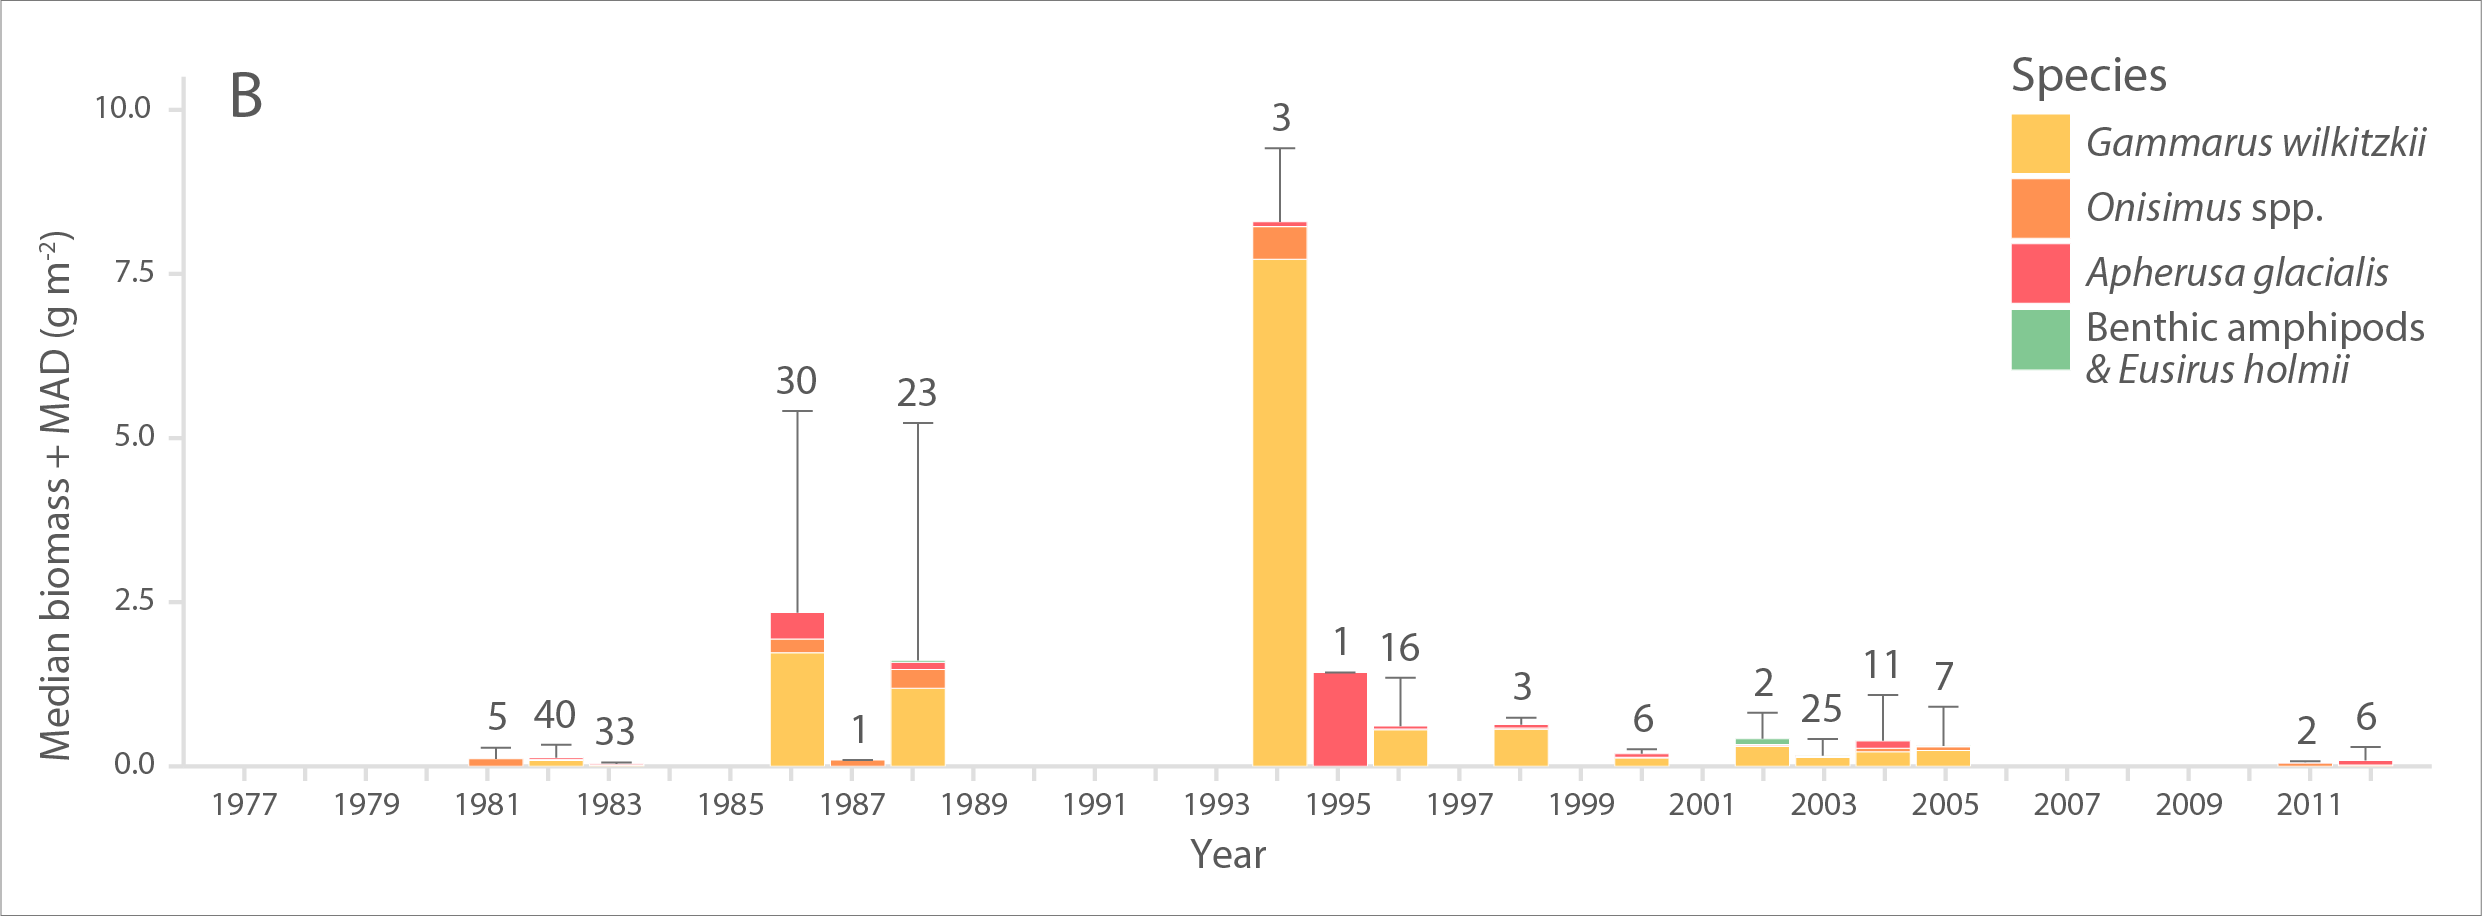
Multi-decadal time series of A) abundance (individuals m-2) and B) biomass (g wet weight m-2) of ice amphipods from 1977 to 2012 across the Arctic. Bars and error bars indicate median and median absolute deviation (MAD) values for each year, respectively. Numbers above bars represent number of sampling efforts (n). Modified from Hop et al. (2013). STATE OF THE ARCTIC MARINE BIODIVERSITY REPORT - <a href="https://arcticbiodiversity.is/findings/sea-ice-biota" target="_blank">Chapter 3</a> - Page 45 - Figure 3.1.7 From the report draft: "The only available time-series of sympagic biota is based on composite data of ice-amphipod abundance and biomass estimates from the 1980s to present across the Arctic, with most observations from the Svalbard and Fram Strait region (Hop et al. 2013). Samples were obtained by SCUBA divers who collected amphipods quantitatively with electrical suction pumps under the sea ice (Lønne & Gulliksen 1991a, b, Hop & Pavlova 2008)."