 CAFF - Arctic Biodiversity Data Service (ABDS)
unknown
Type of resources
Available actions
Topics
Keywords
Contact for the resource
Provided by
Years
Formats
Representation types
Update frequencies
status
Scale
-

The Arctic terrestrial food web includes the exchange of energy and nutrients. Arrows to and from the driver boxes indicate the relative effect and counter effect of different types of drivers on the ecosystem. STATE OF THE ARCTIC TERRESTRIAL BIODIVERSITY REPORT - Chapter 2 - Page 26- Figure 2.4
-
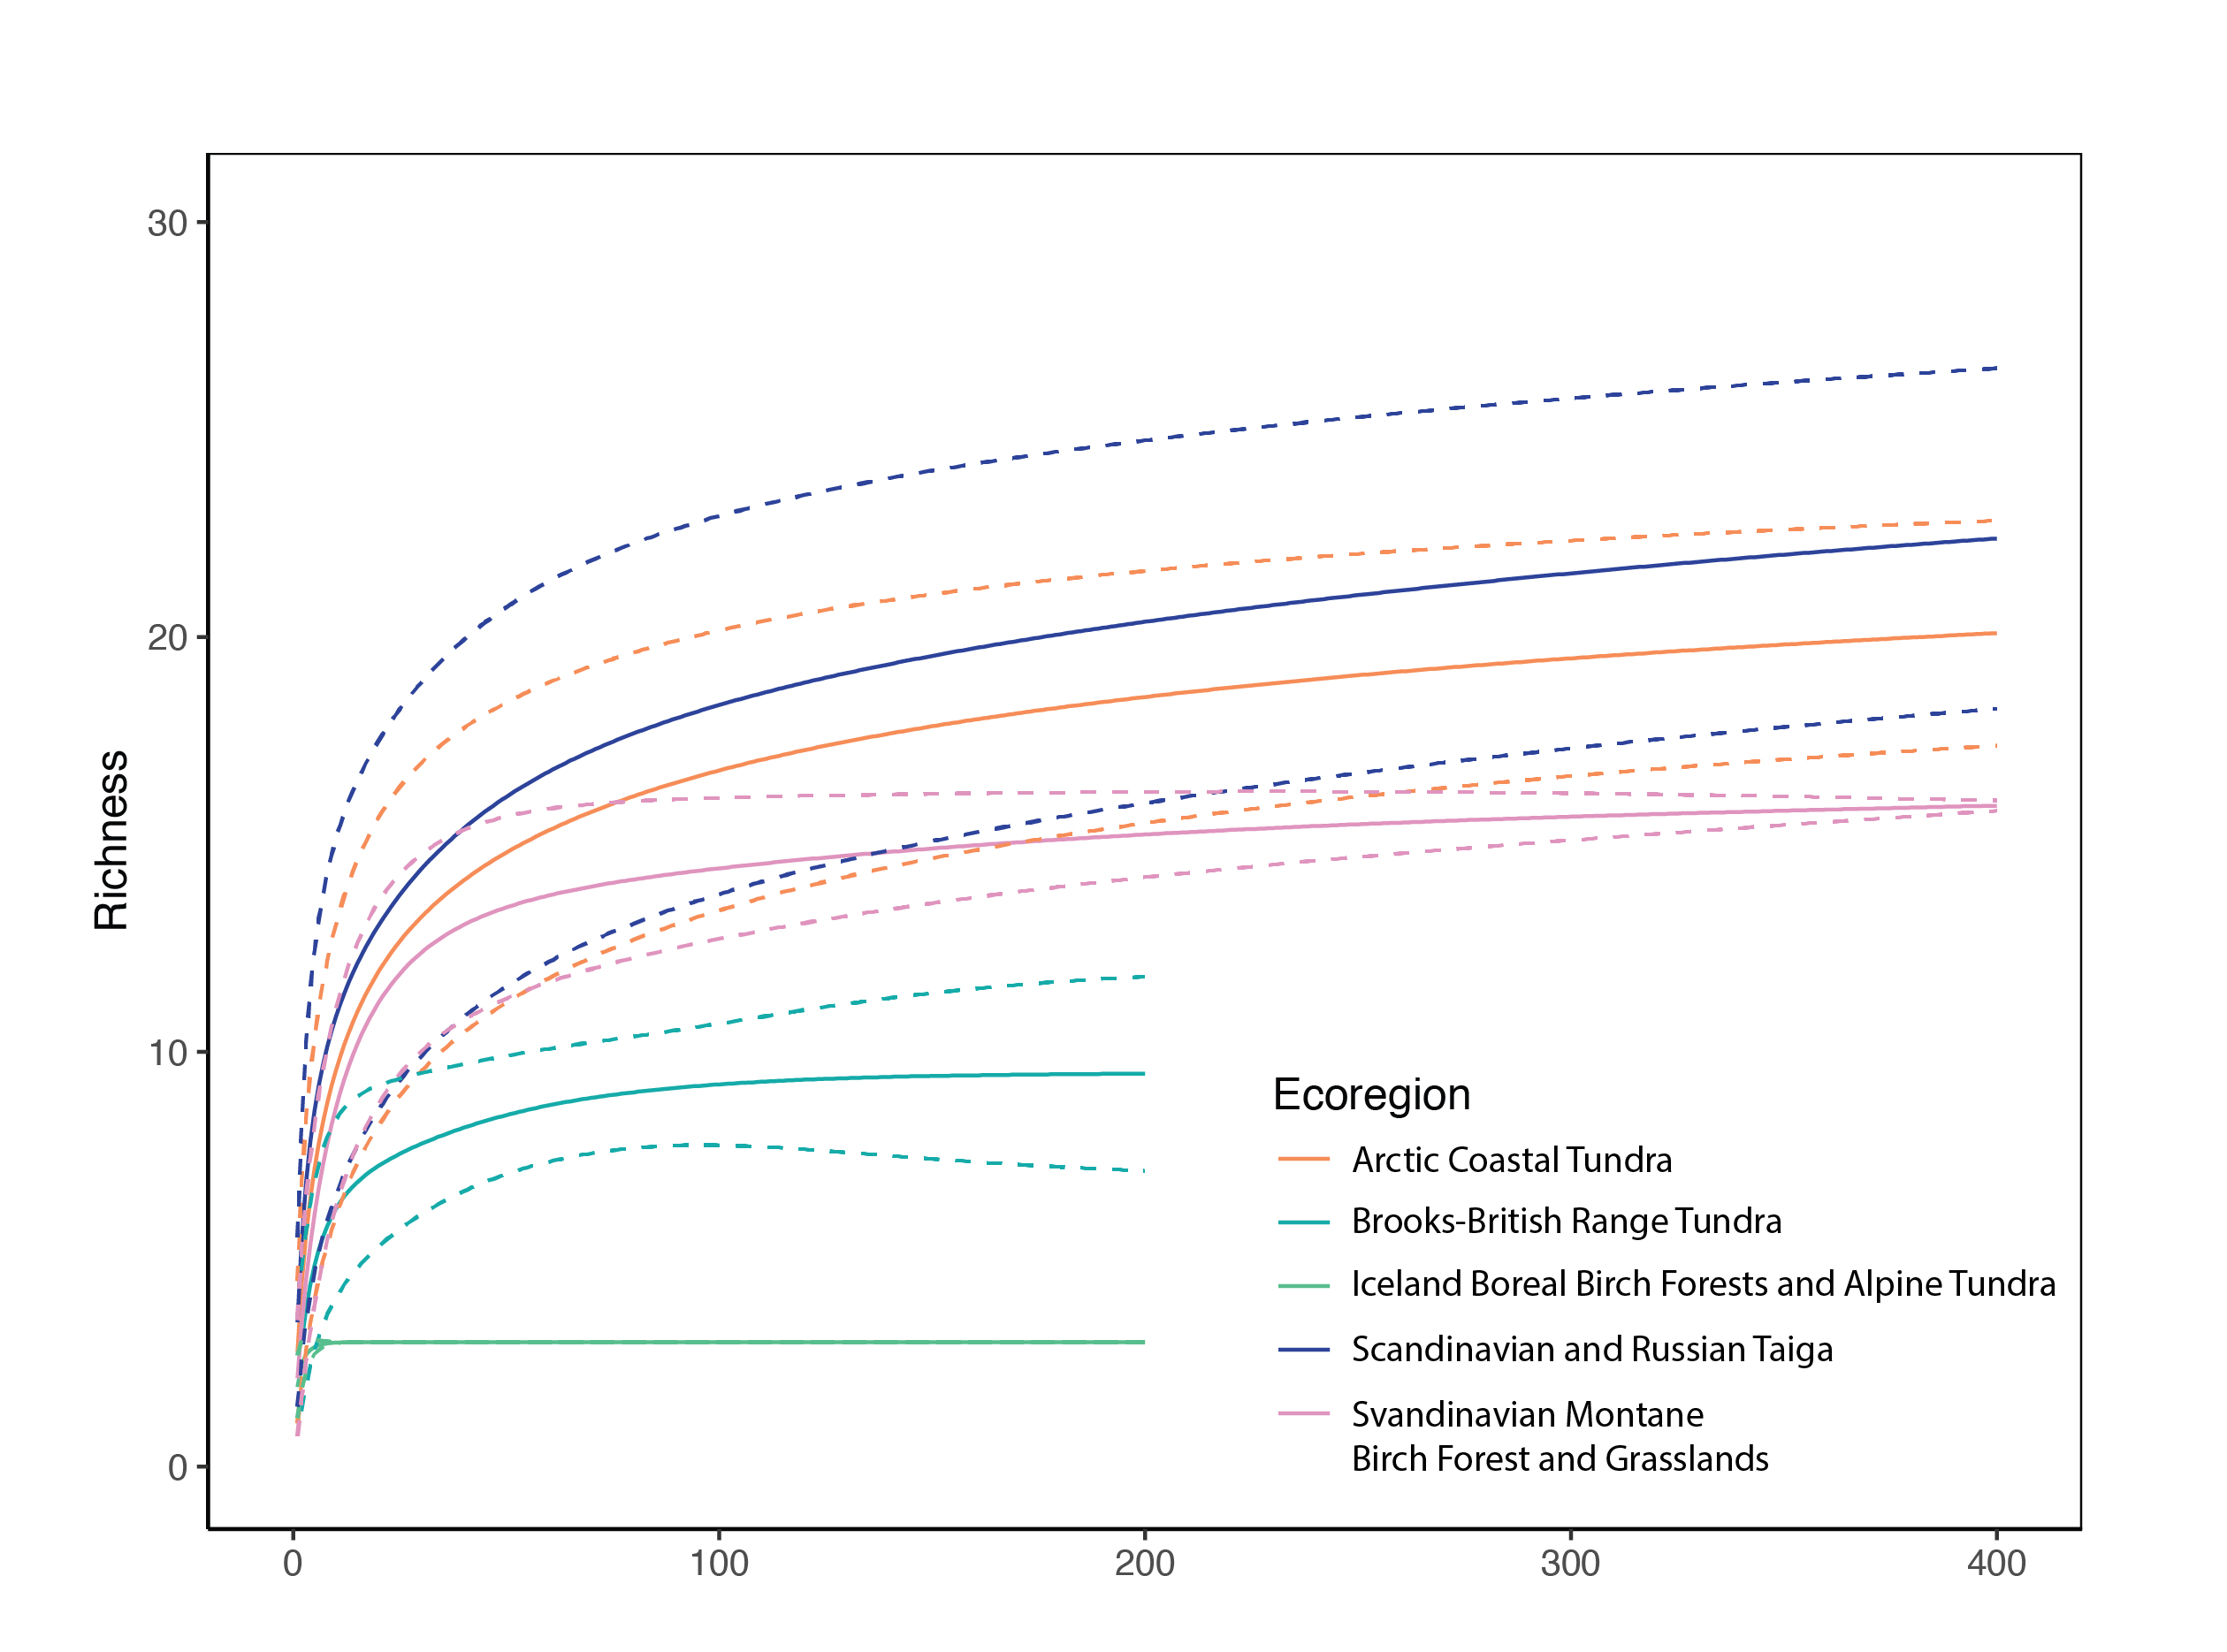
Provides richness estimates and 95% confidence bounds for five ecoregions. State of the Arctic Freshwater Biodiversity Report - Chapter 4 - Page 77 - Figure 4-38
-
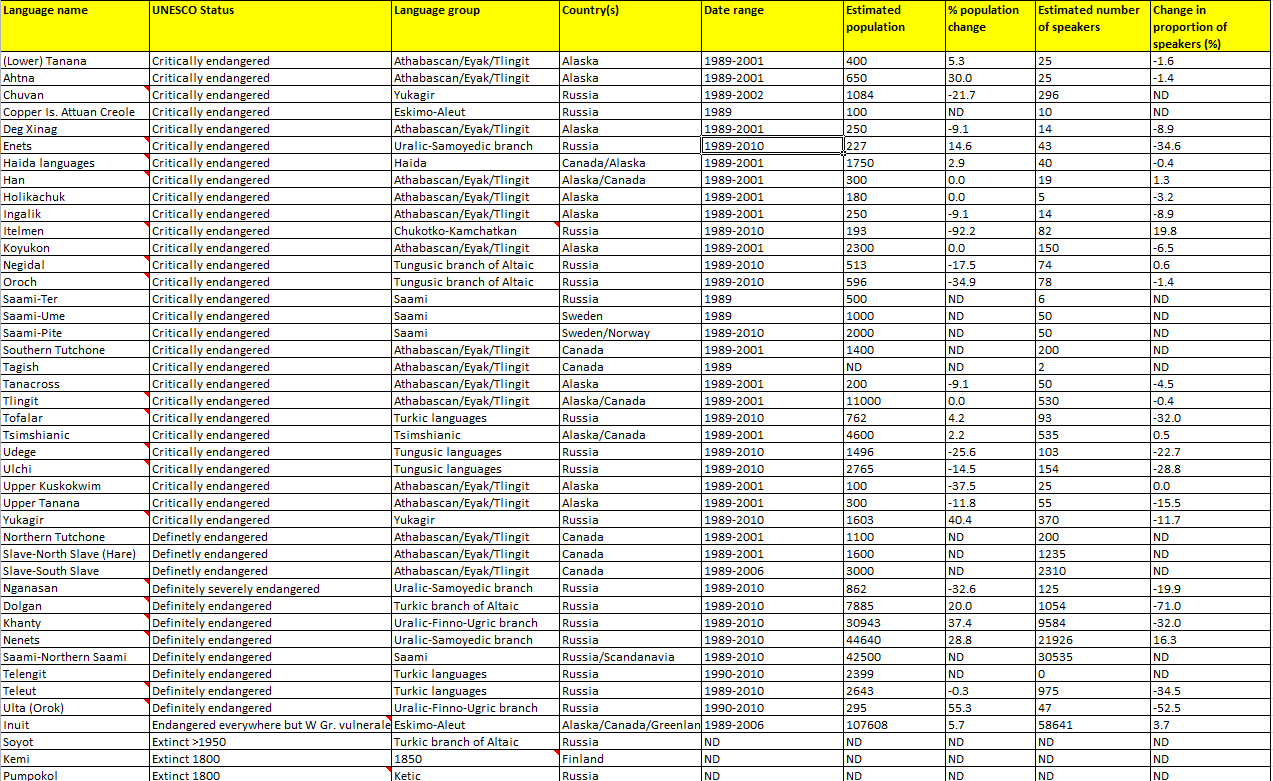
Appendix 20. Arctic indigenous languages status and trends. Data used to compile the information for the table was collected from both census records and academic sources, each of the CAFF countries and indigenous peoples organizations (Permanent Participants to the Arctic Council) where possible also provided statistical information.
-
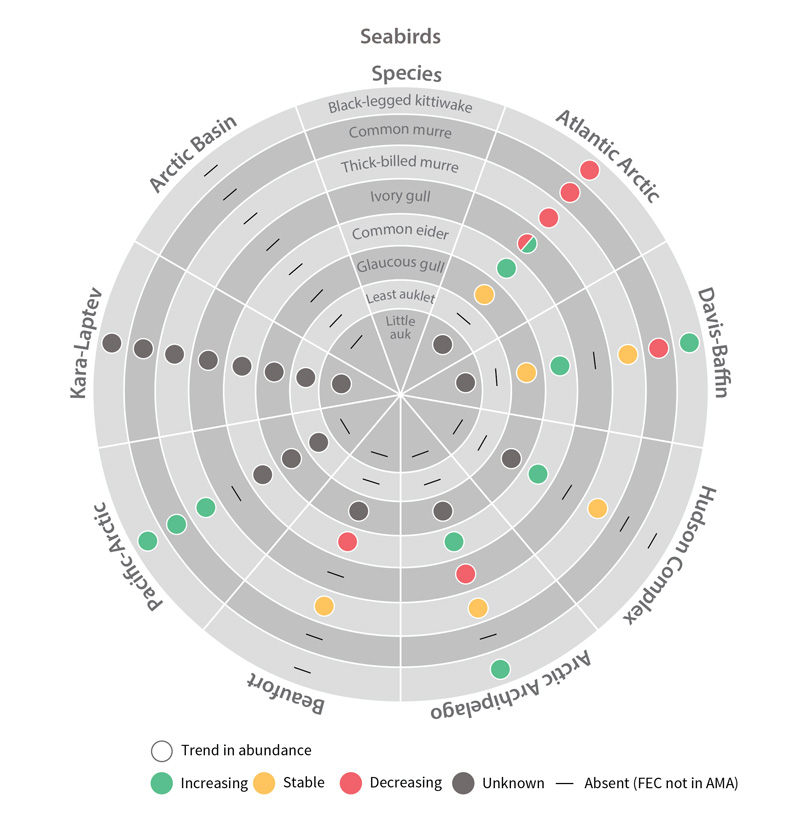
Trends in abundance of seabird Focal Ecosystem Components across each Arctic Marine Area. STATE OF THE ARCTIC MARINE BIODIVERSITY REPORT - Chapter 4 - Page 181 - Figure 4.5
-
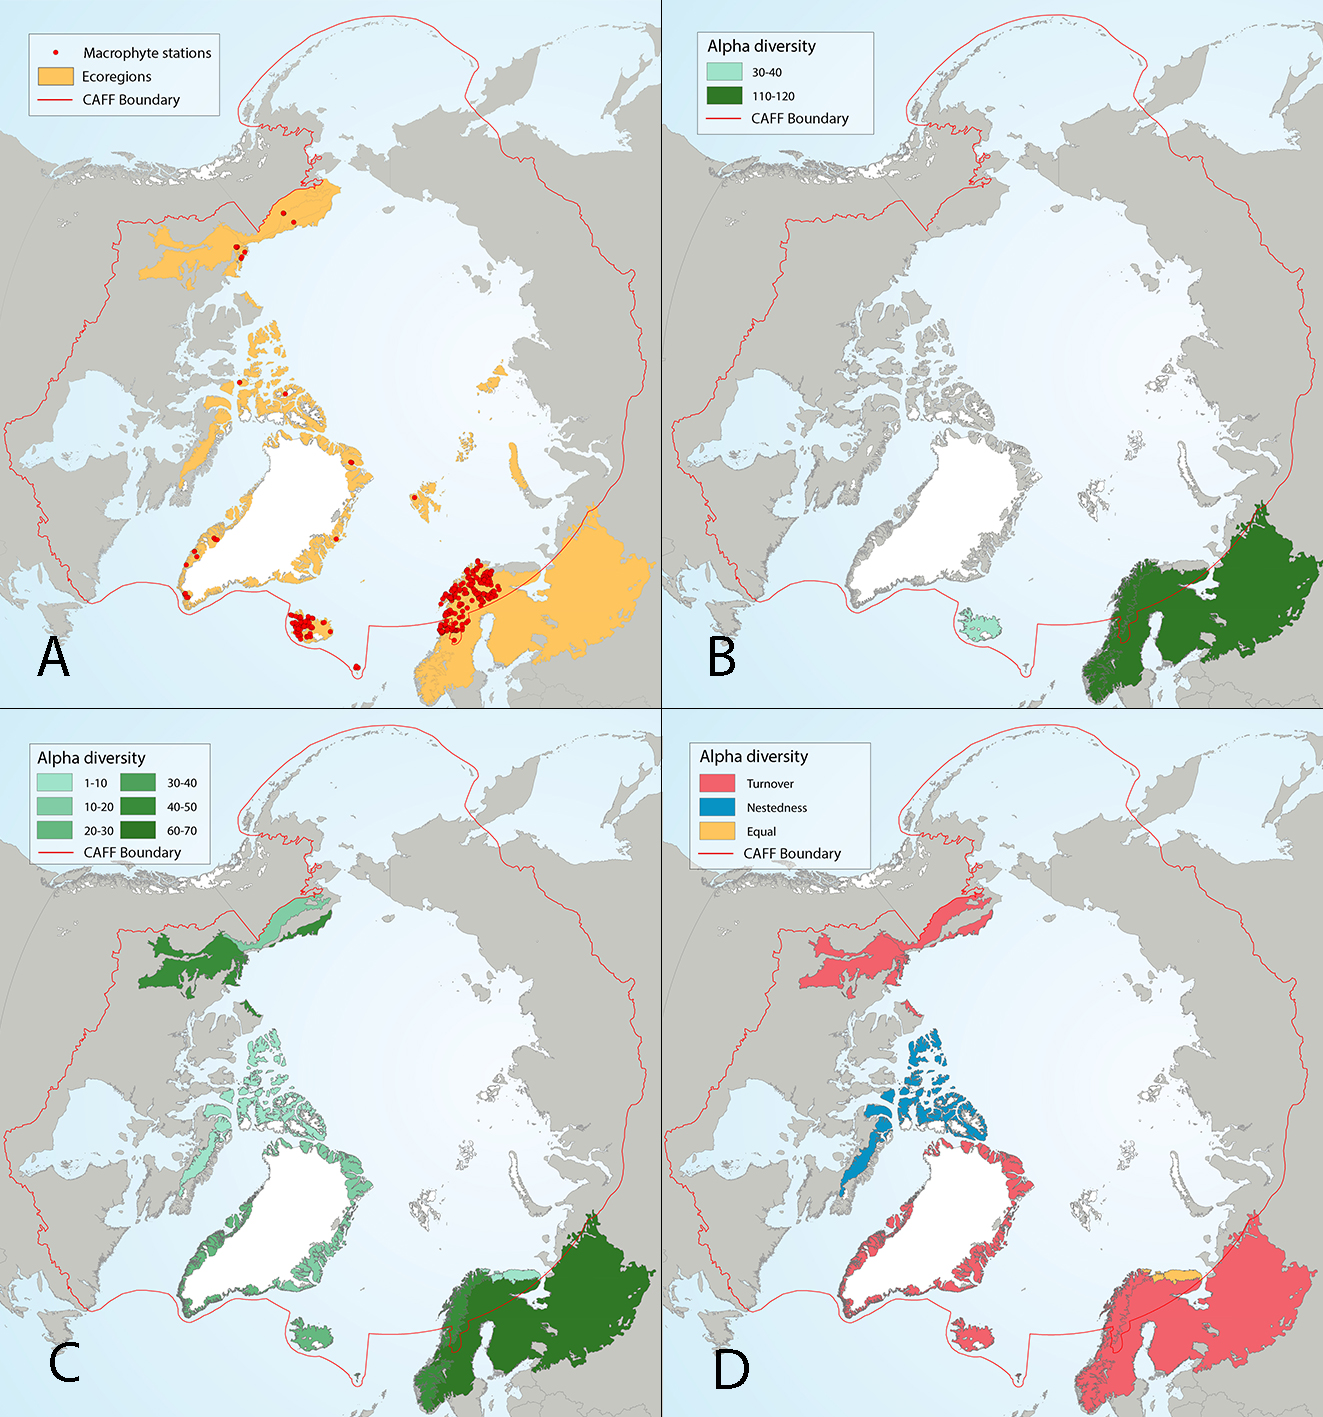
Figure 4 22 Results of circumpolar assessment of lake macrophytes, indicating (a) the location of macrophyte stations, underlain by circumpolar ecoregions; (b) ecoregions with many macrophyte stations, colored on the basis of alpha diversity rarefied to 70 stations; (c) all ecoregions with macrophyte stations, colored on the basis of alpha diversity rarefied to 10 stations; (d) ecoregions with at least two stations in a hydrobasin, colored on the basis of the dominant component of beta diversity (species turnover, nestedness, approximately equal contribution, or no diversity) when averaged across hydrobasins in each ecoregion. State of the Arctic Freshwater Biodiversity Report - Chapter 4 - Page 54 - Figure 4-22
-

Temporal trends of arthropod abundance, 1996–2009. Estimated by the number of individuals caught per trap per day during the season from four different pitfall trap plots, each consisting of eight (1996–2006) or four (2007–2009) traps. Modified from Høye et al. 2013. STATE OF THE ARCTIC TERRESTRIAL BIODIVERSITY REPORT - Chapter 3 - Page 41 - Figure 3.16
-
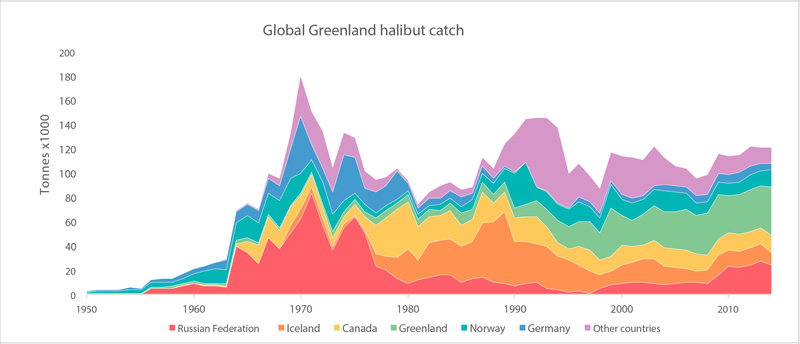
Global catches of Greenland halibut (FAO 2015). STATE OF THE ARCTIC MARINE BIODIVERSITY REPORT - <a href="https://arcticbiodiversity.is/findings/marine-fishes" target="_blank">Chapter 3</a> - Page 121 - Figure 3.4.8
-

Figure 4 17 Results of circumpolar assessment of lake phytoplankton,(a) the location of phytoplankton stations, underlain by circumpolar ecoregions; (b) ecoregions with many phytoplankton stations, colored on the basis of alpha diversity rarefied to 35 stations; (c) all ecoregions with phytoplankton stations, colored on the basis of alpha diversity rarefied to 10 stations; (d) ecoregions with at least two stations in a hydrobasin, colored on the basis of the dominant component of beta diversity (species turnover, nestedness, approximately equal contribution, or no diversity) when averaged across hydrobasins in each ecoregion. State of the Arctic Freshwater Biodiversity Report - Chapter 4 - Page 56 - Figure 4-17
-
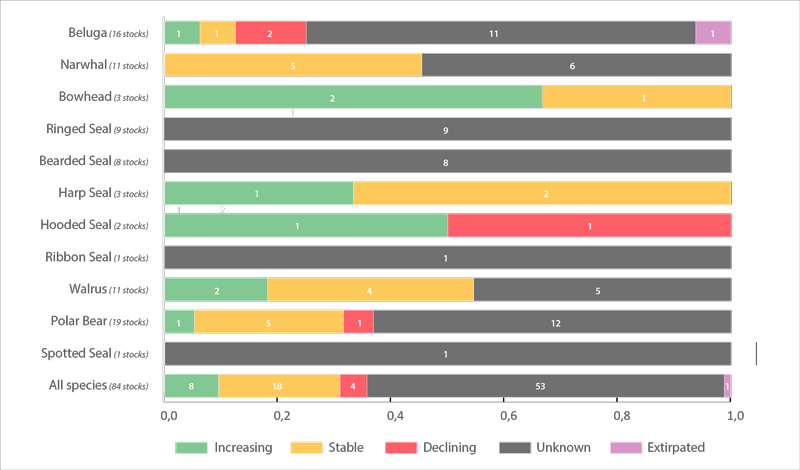
Trends in abundance of Arctic marine mammal Focal Ecosystem Components based on the most recent assessment for each recognized subpopulation of a species (red, declining trend; yellow, stable trend; green, increasing trend; grey, unknown trend). Number of subpopulations is given after species name. Each column is divided into equal segments, the sizes of which are not proportional to the size of the subpopulation. Ringed seal and bearded seal segments represent subspecies. Walrus segments represent subpopulations within subspecies. See Table 3.6.1 for details on abundance. STATE OF THE ARCTIC MARINE BIODIVERSITY REPORT - <a href="https://arcticbiodiversity.is/findings/marine-mammals" target="_blank">Chapter 3</a> - Page 156 - Figure 3.6.2
-
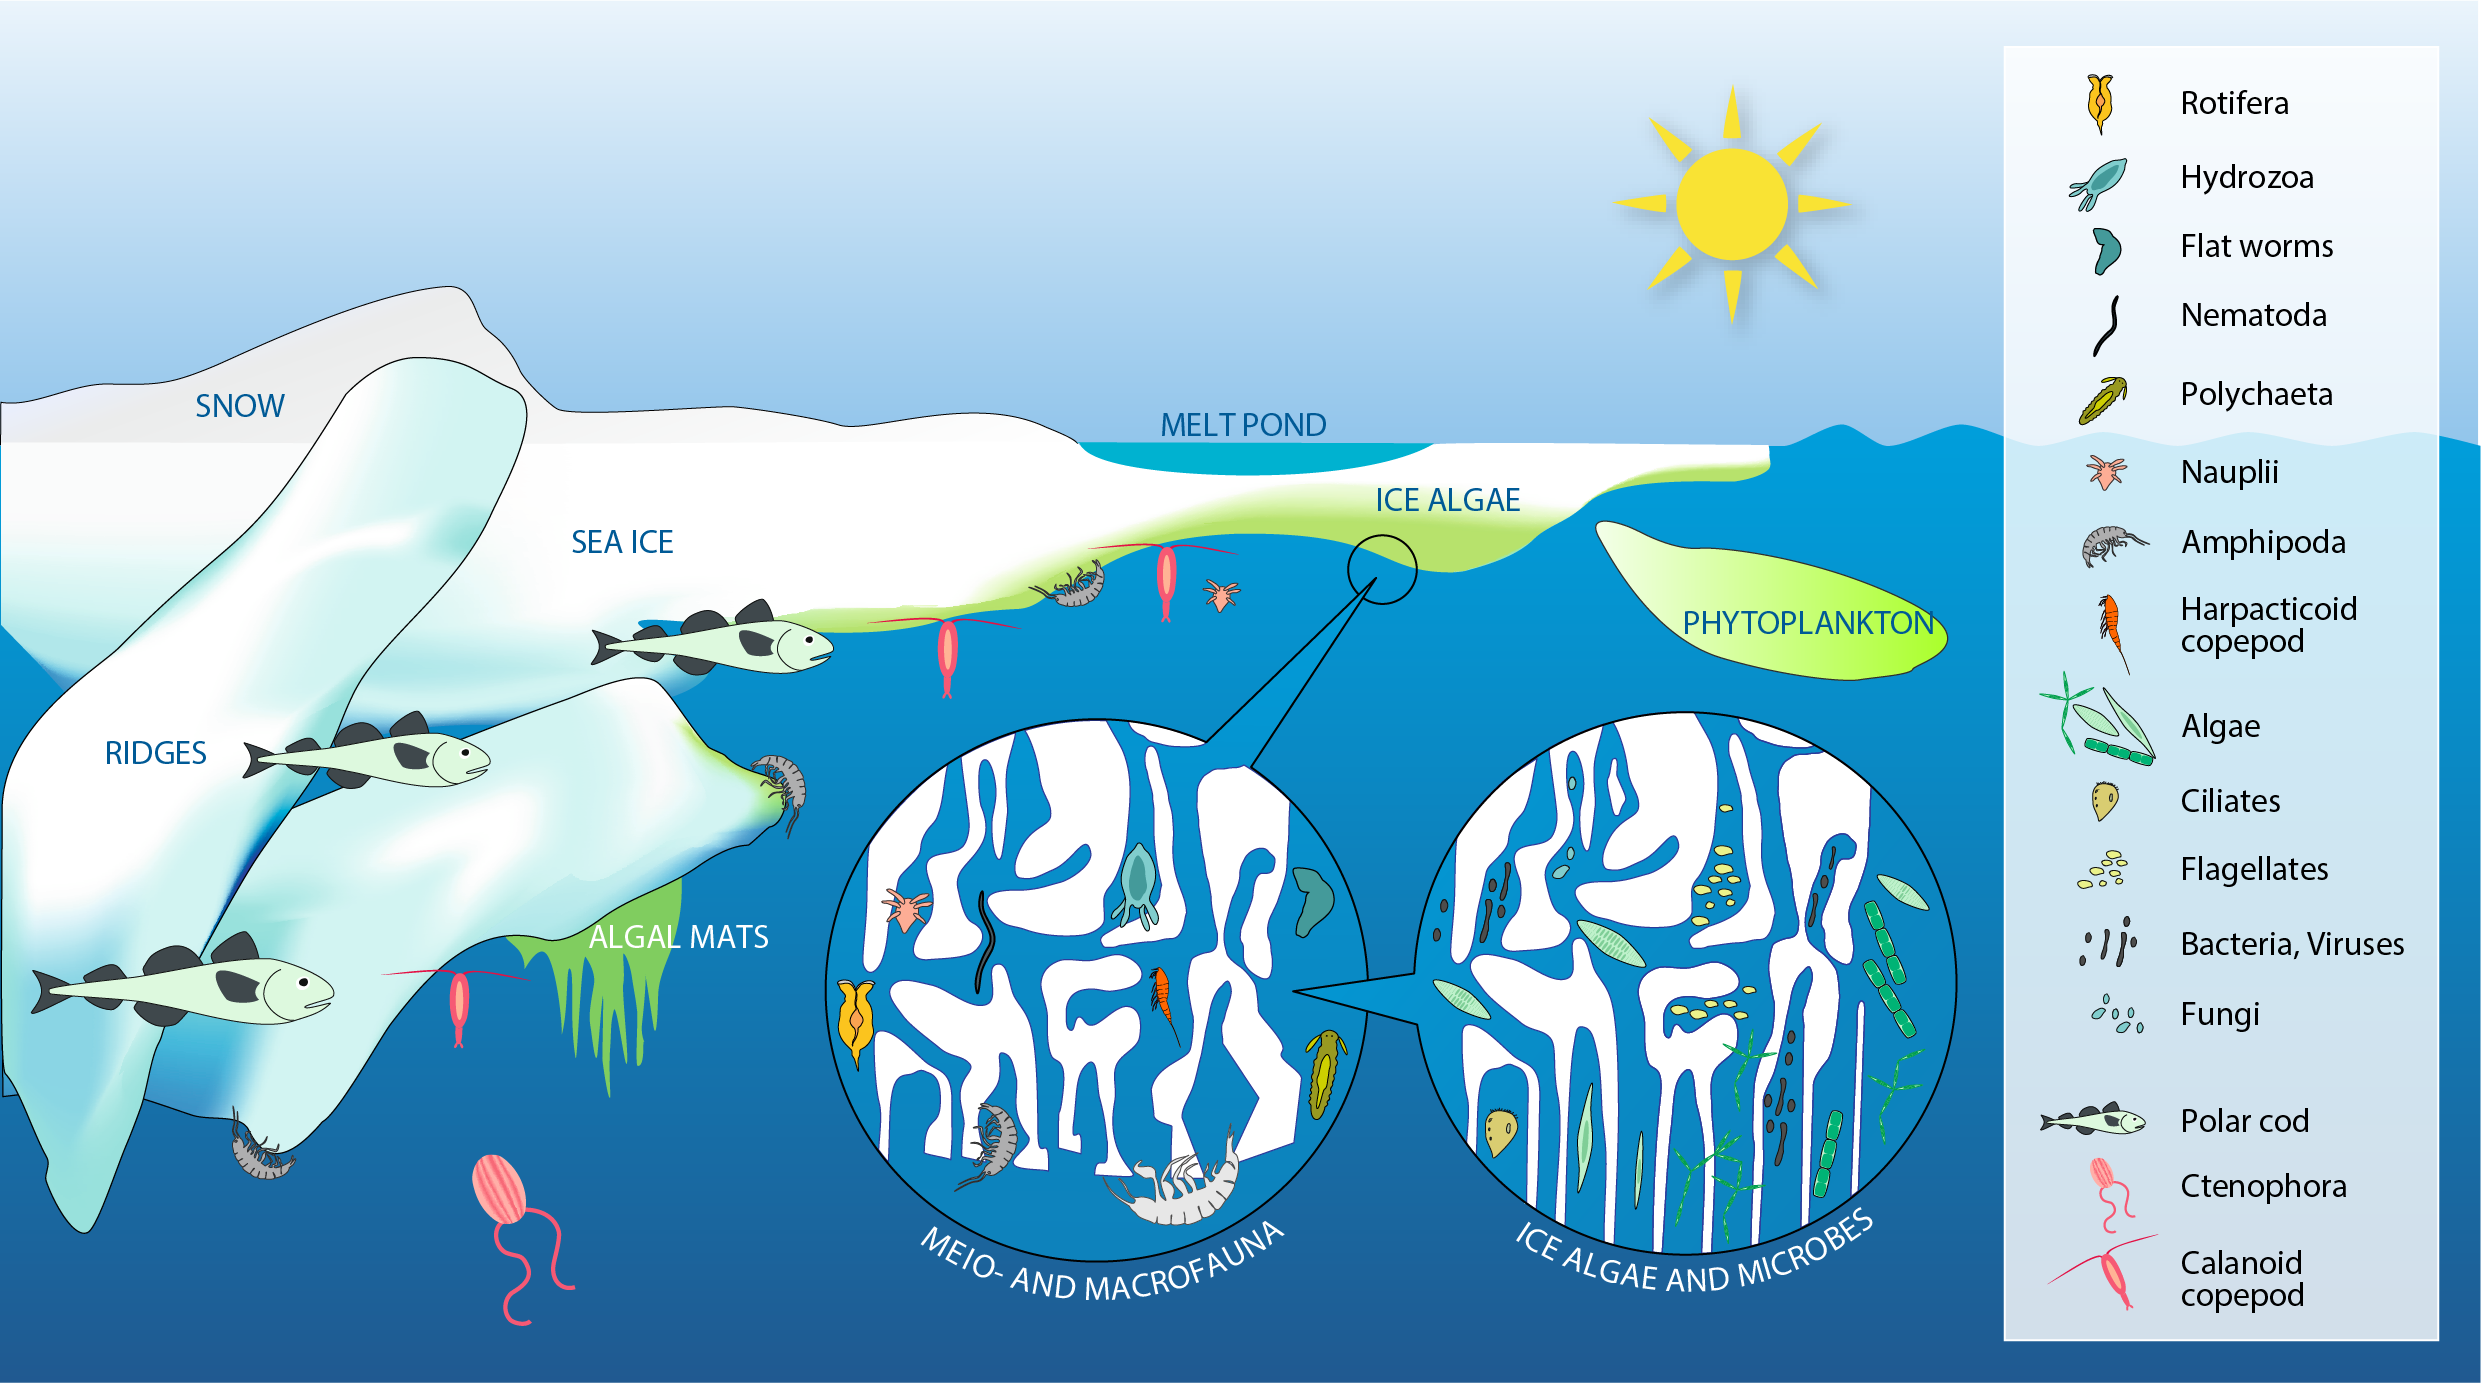
Sea ice provides a wide range of microhabitats for diverse biota including microbes, single-celled eukaryotes (labelled algae), multicellular meiofauna, larger under-ice fauna (represented by amphipods), as well as polar cod (Boreogadus saida). Modified from Bluhm et al. (2017). STATE OF THE ARCTIC MARINE BIODIVERSITY REPORT - <a href="https://arcticbiodiversity.is/findings/sea-ice-biota" target="_blank">Chapter 3</a> - Page 35 - Figure 3.1.1