 CAFF - Arctic Biodiversity Data Service (ABDS)
40000
Type of resources
Available actions
Topics
Keywords
Contact for the resource
Provided by
Representation types
Update frequencies
status
Scale
-
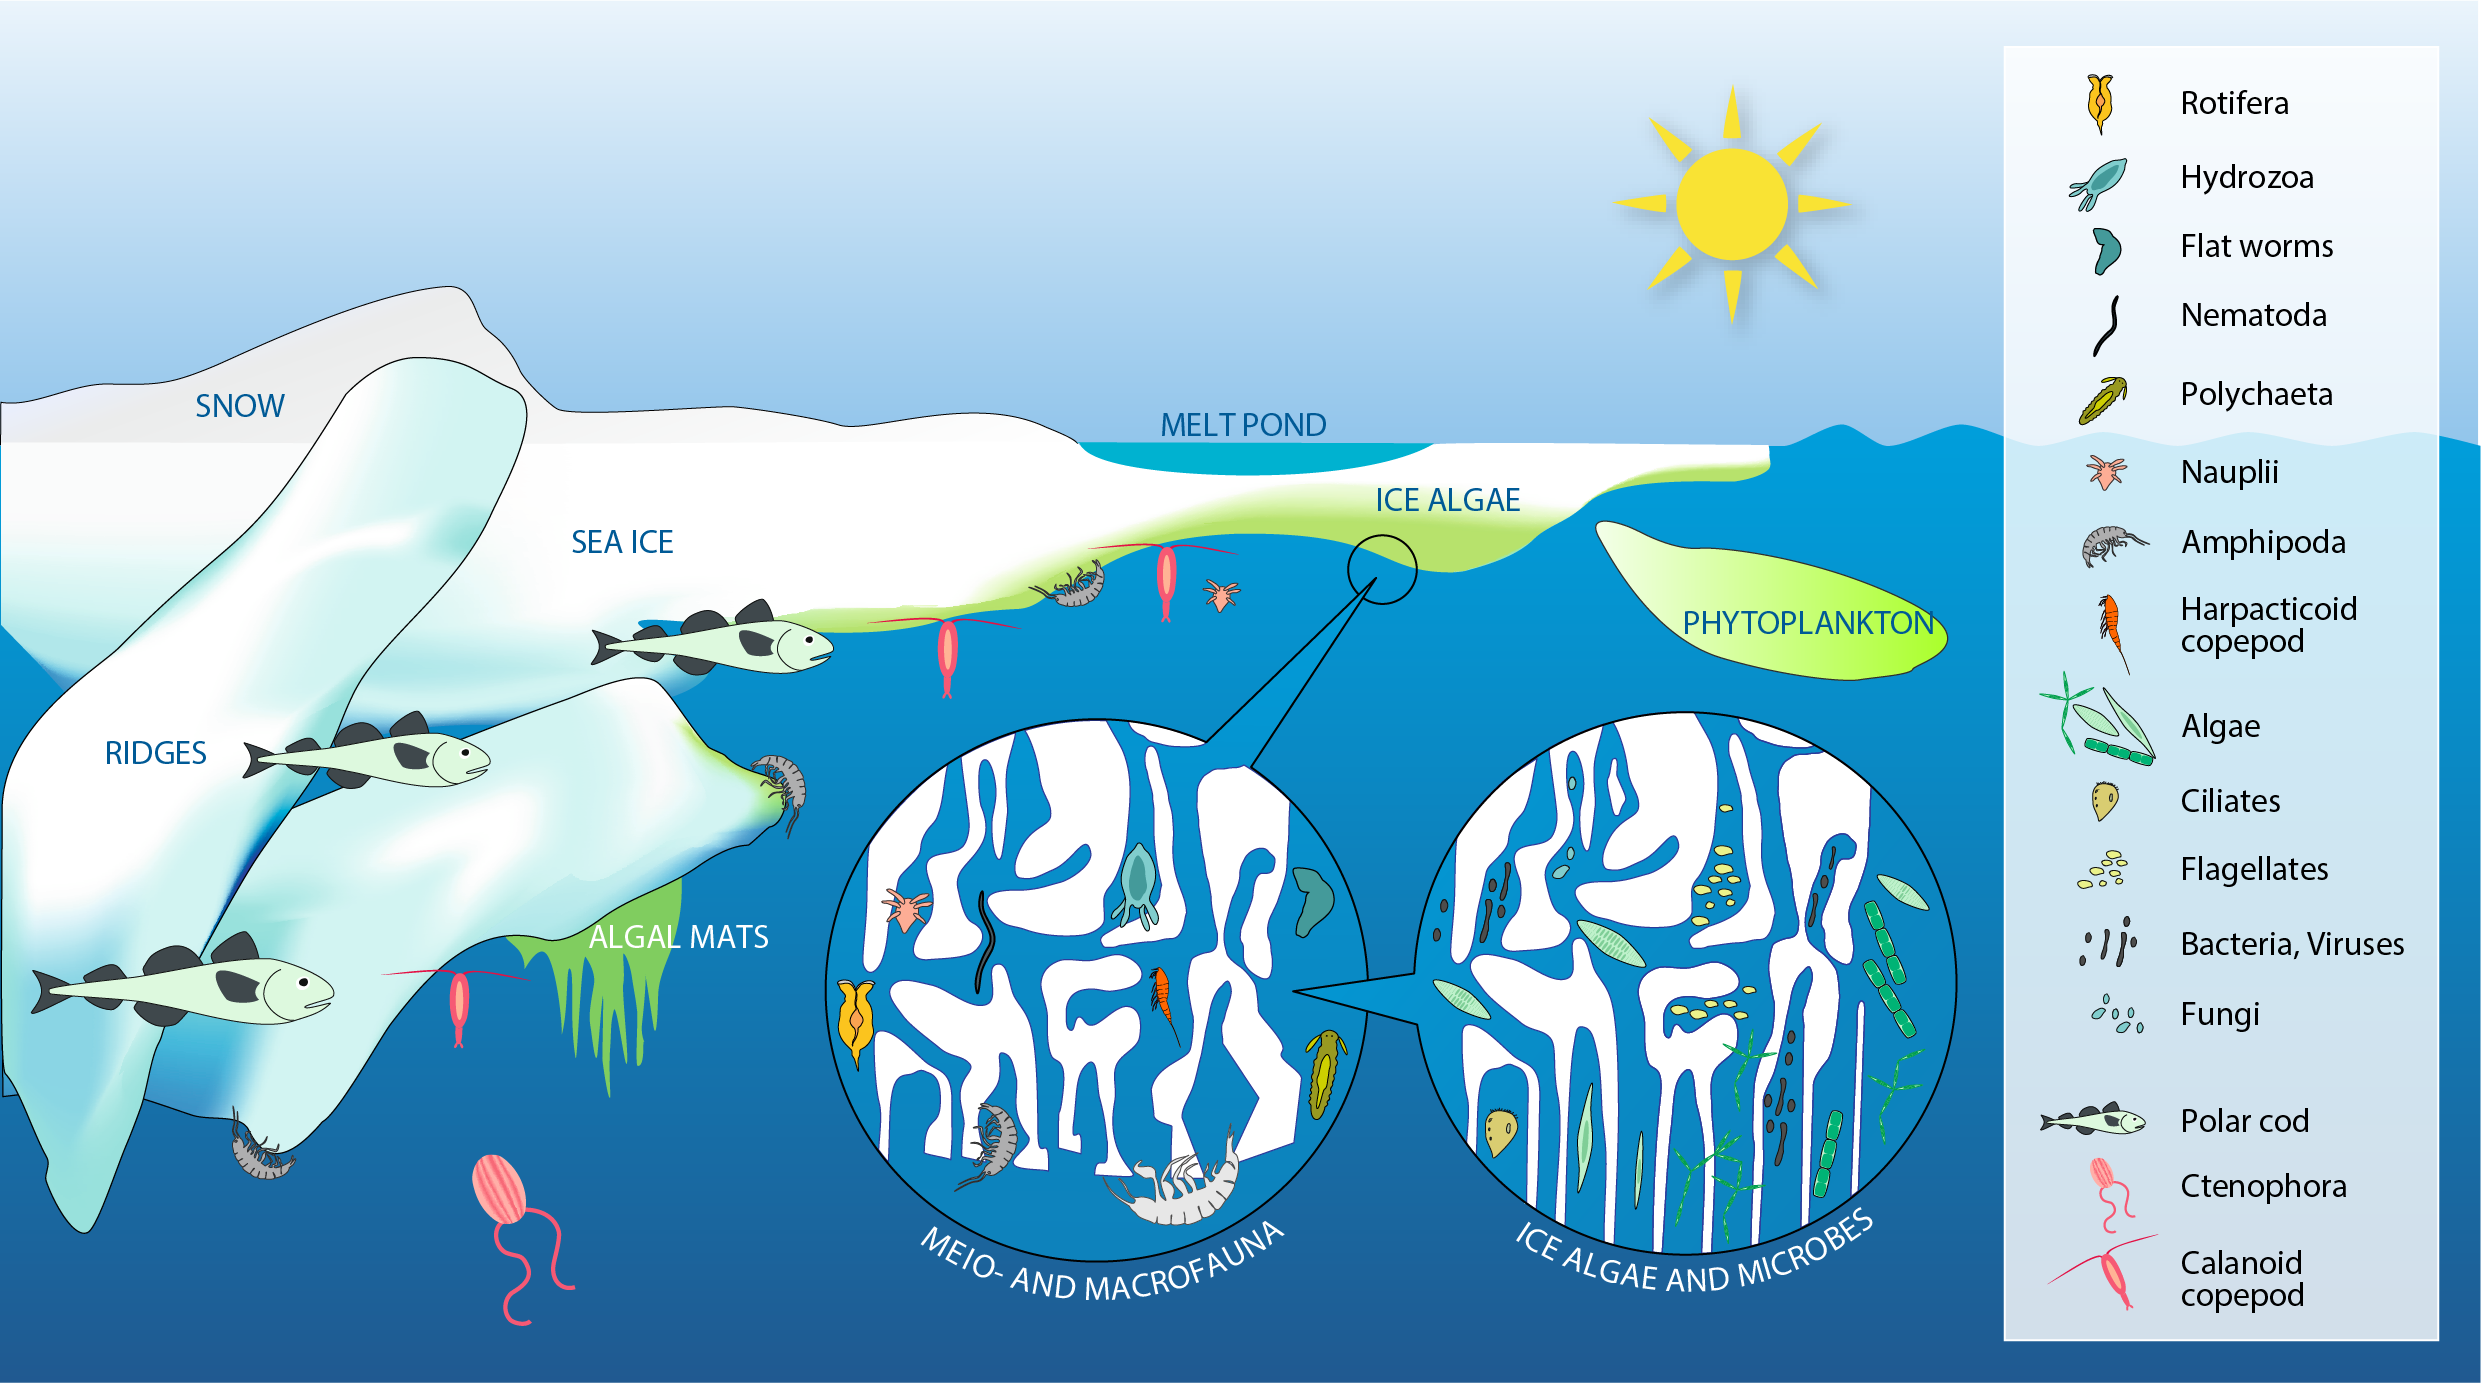
Sea ice provides a wide range of microhabitats for diverse biota including microbes, single-celled eukaryotes (labelled algae), multicellular meiofauna, larger under-ice fauna (represented by amphipods), as well as polar cod (Boreogadus saida). Modified from Bluhm et al. (2017). STATE OF THE ARCTIC MARINE BIODIVERSITY REPORT - <a href="https://arcticbiodiversity.is/findings/sea-ice-biota" target="_blank">Chapter 3</a> - Page 35 - Figure 3.1.1
-
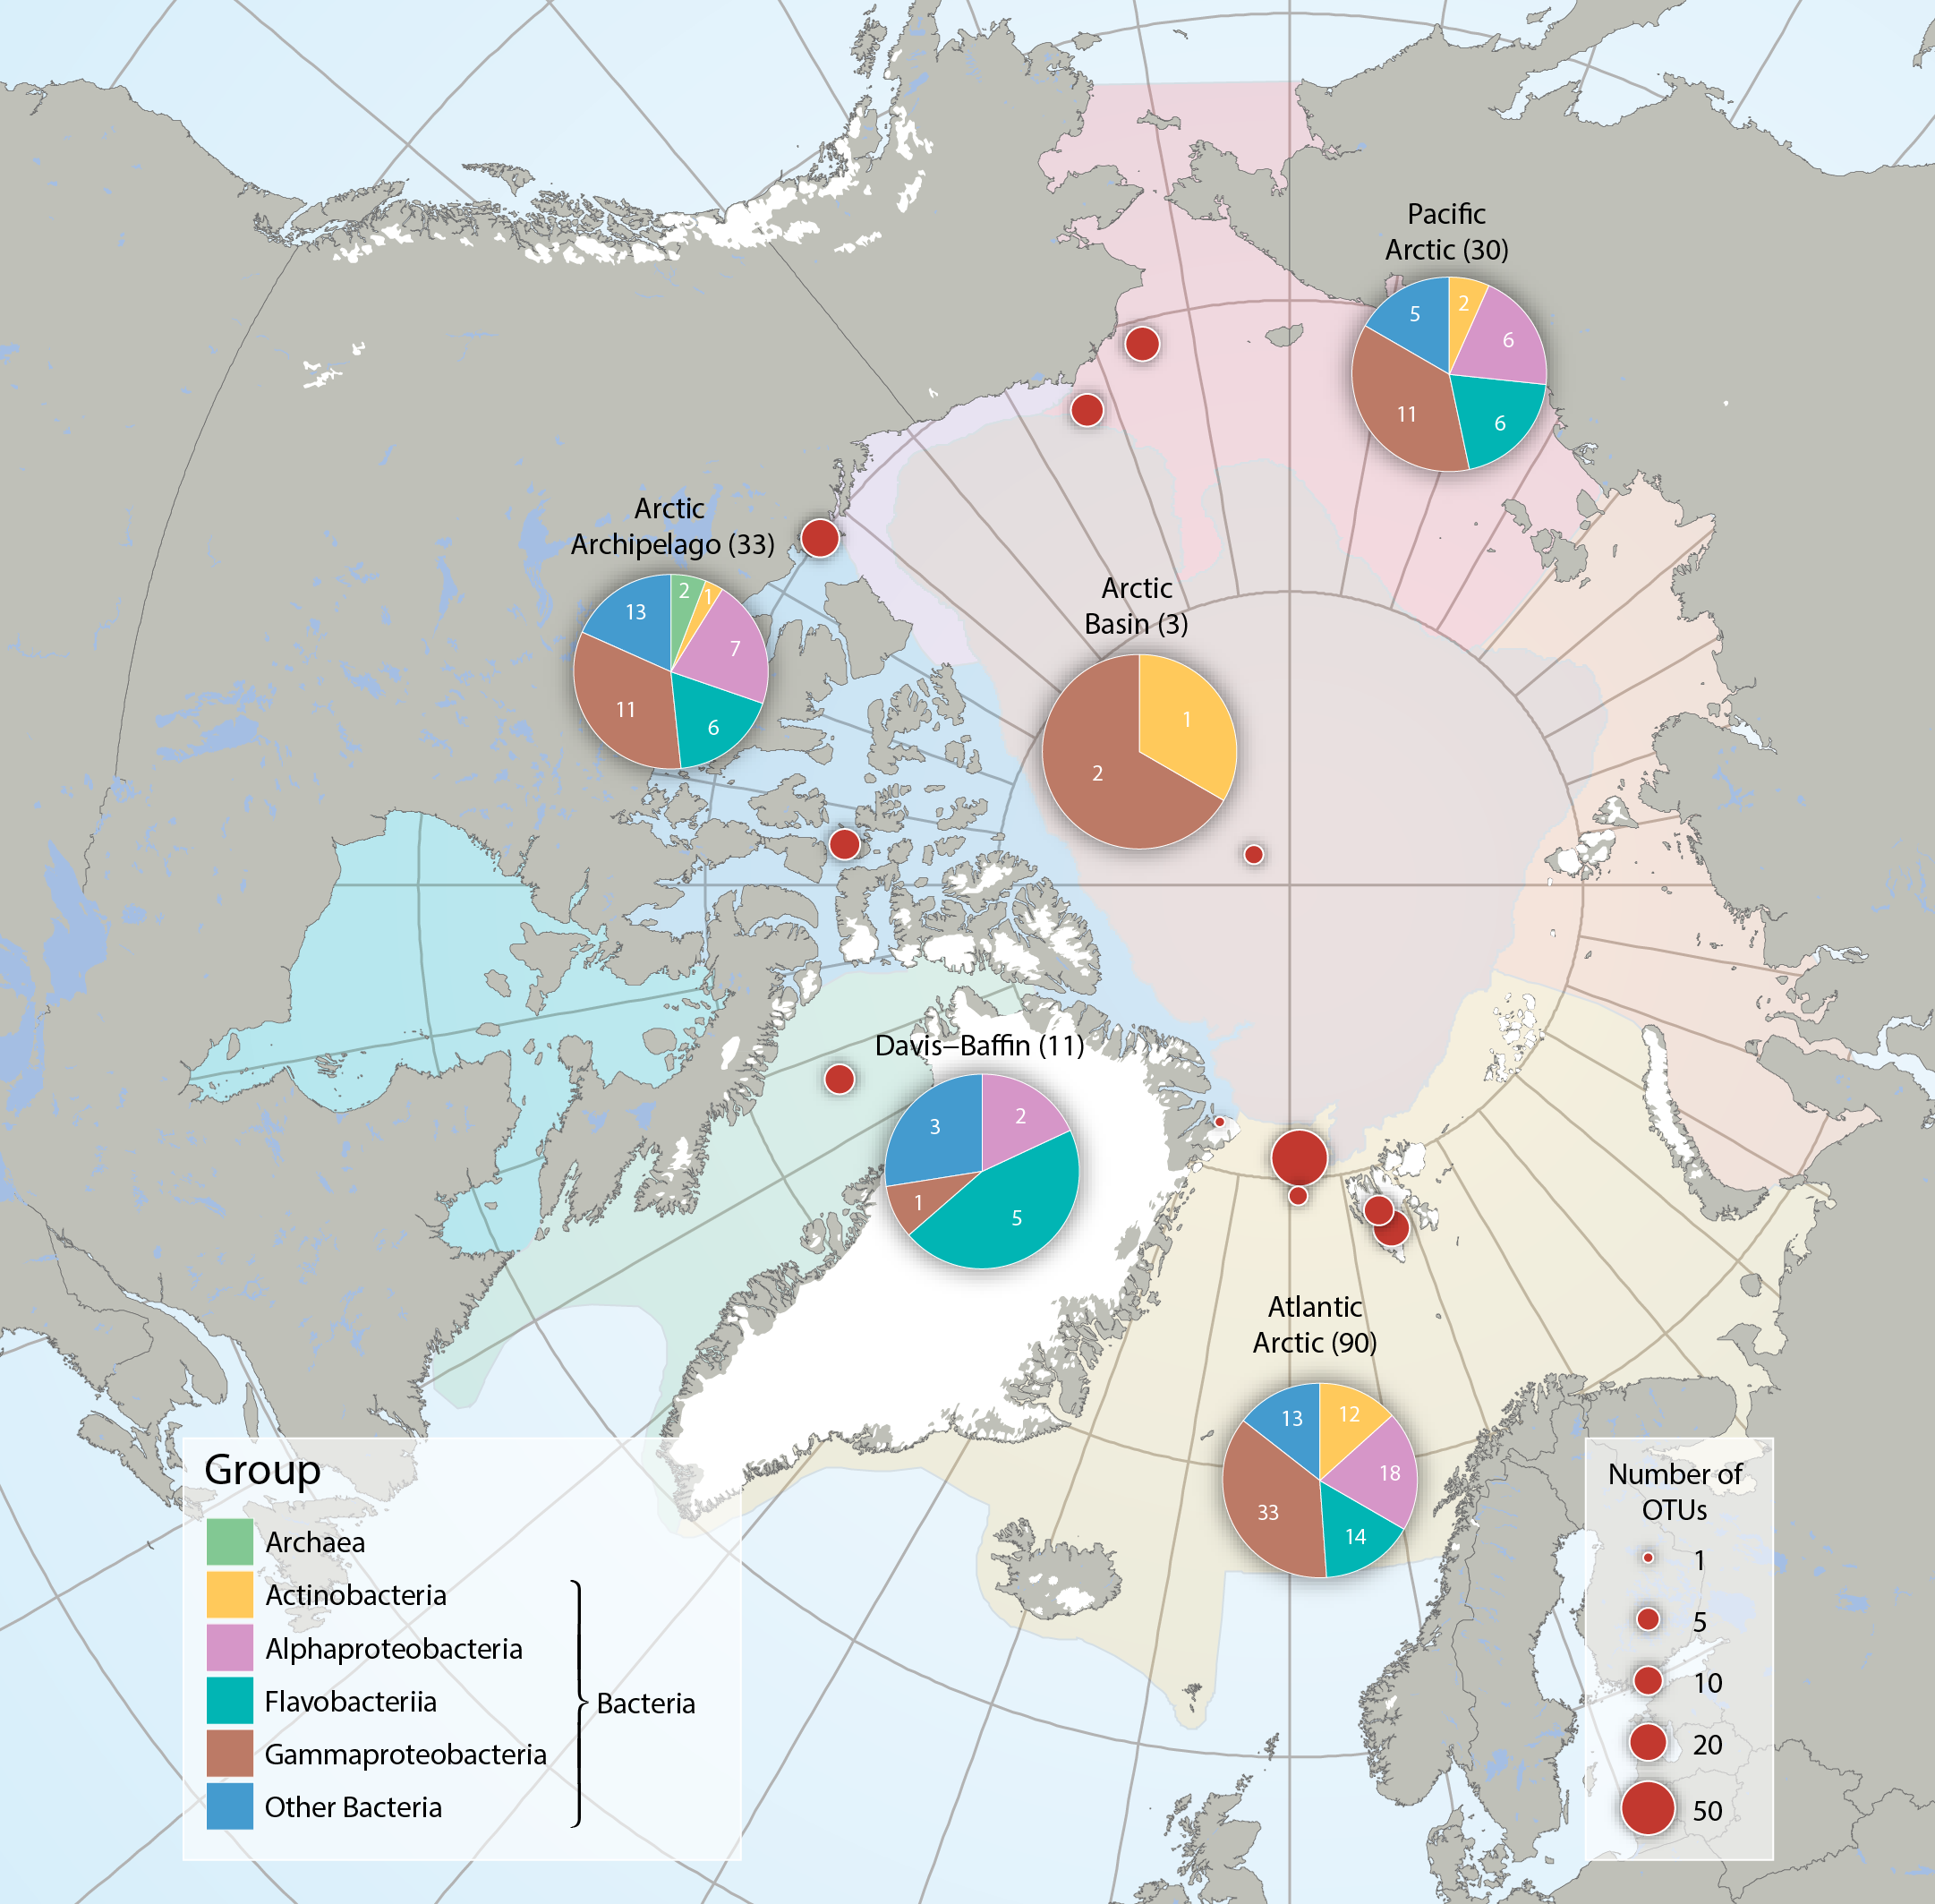
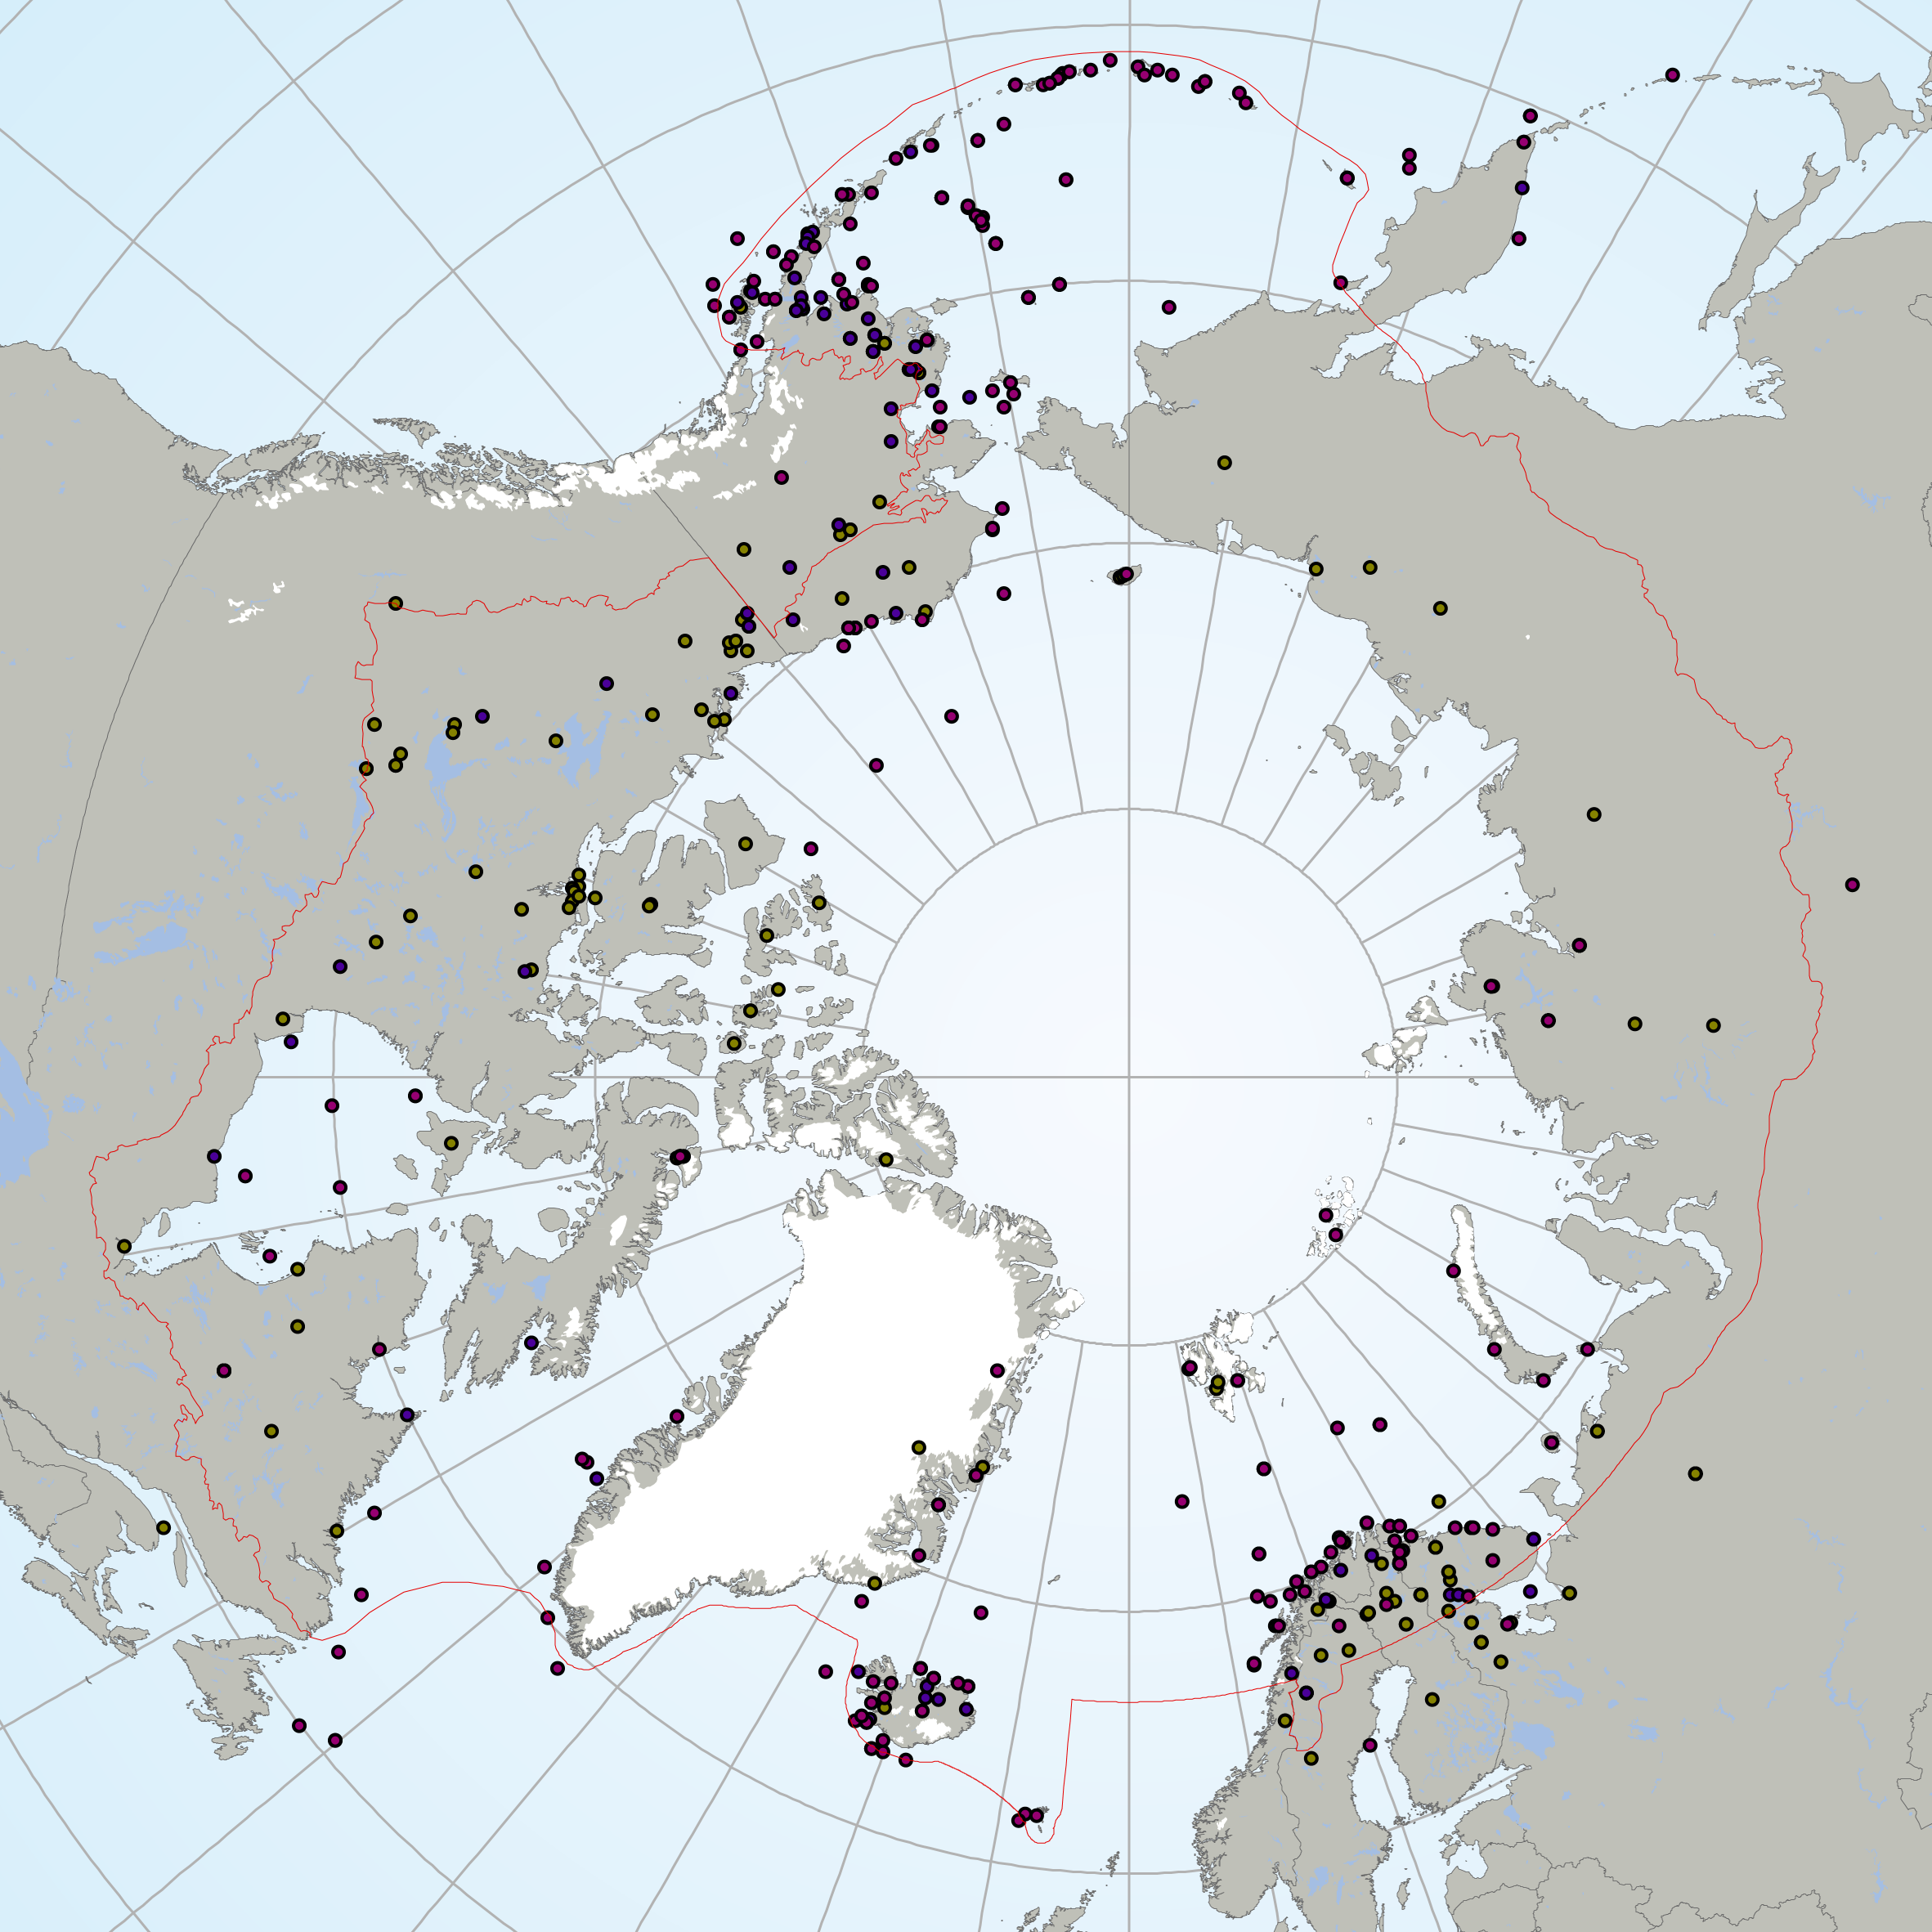
Bacteria and Archaea across five Arctic Marine Areas based on number of operational taxonomic units (OTUs), or molecular species. Composition of microbial groups, with respective numbers of OTUs (pie charts) and number of OTUs at sampling locations (red dots). Data aggregated by the CBMP Sea Ice Biota Expert Network. Data source: National Center for Biotechnology Information’s (NCBI 2017) Nucleotide and PubMed databases. STATE OF THE ARCTIC MARINE BIODIVERSITY REPORT - <a href="https://arcticbiodiversity.is/findings/sea-ice-biota" target="_blank">Chapter 3</a> - Page 38 - Figure 3.1.2 From the report draft: "Synthesis of available data was performed by using searches conducted in the National Center for Biotechnology Information’s “Nucleotide” (http://www.ncbi.nlm.nih.gov/guide/data-software/) and “PubMed” (http://www.ncbi.nlm.nih.gov/pubmed) databases. Aligned DNA sequences were downloaded and clustered into OTUs by maximum likelihood phylogenetic placement."
-
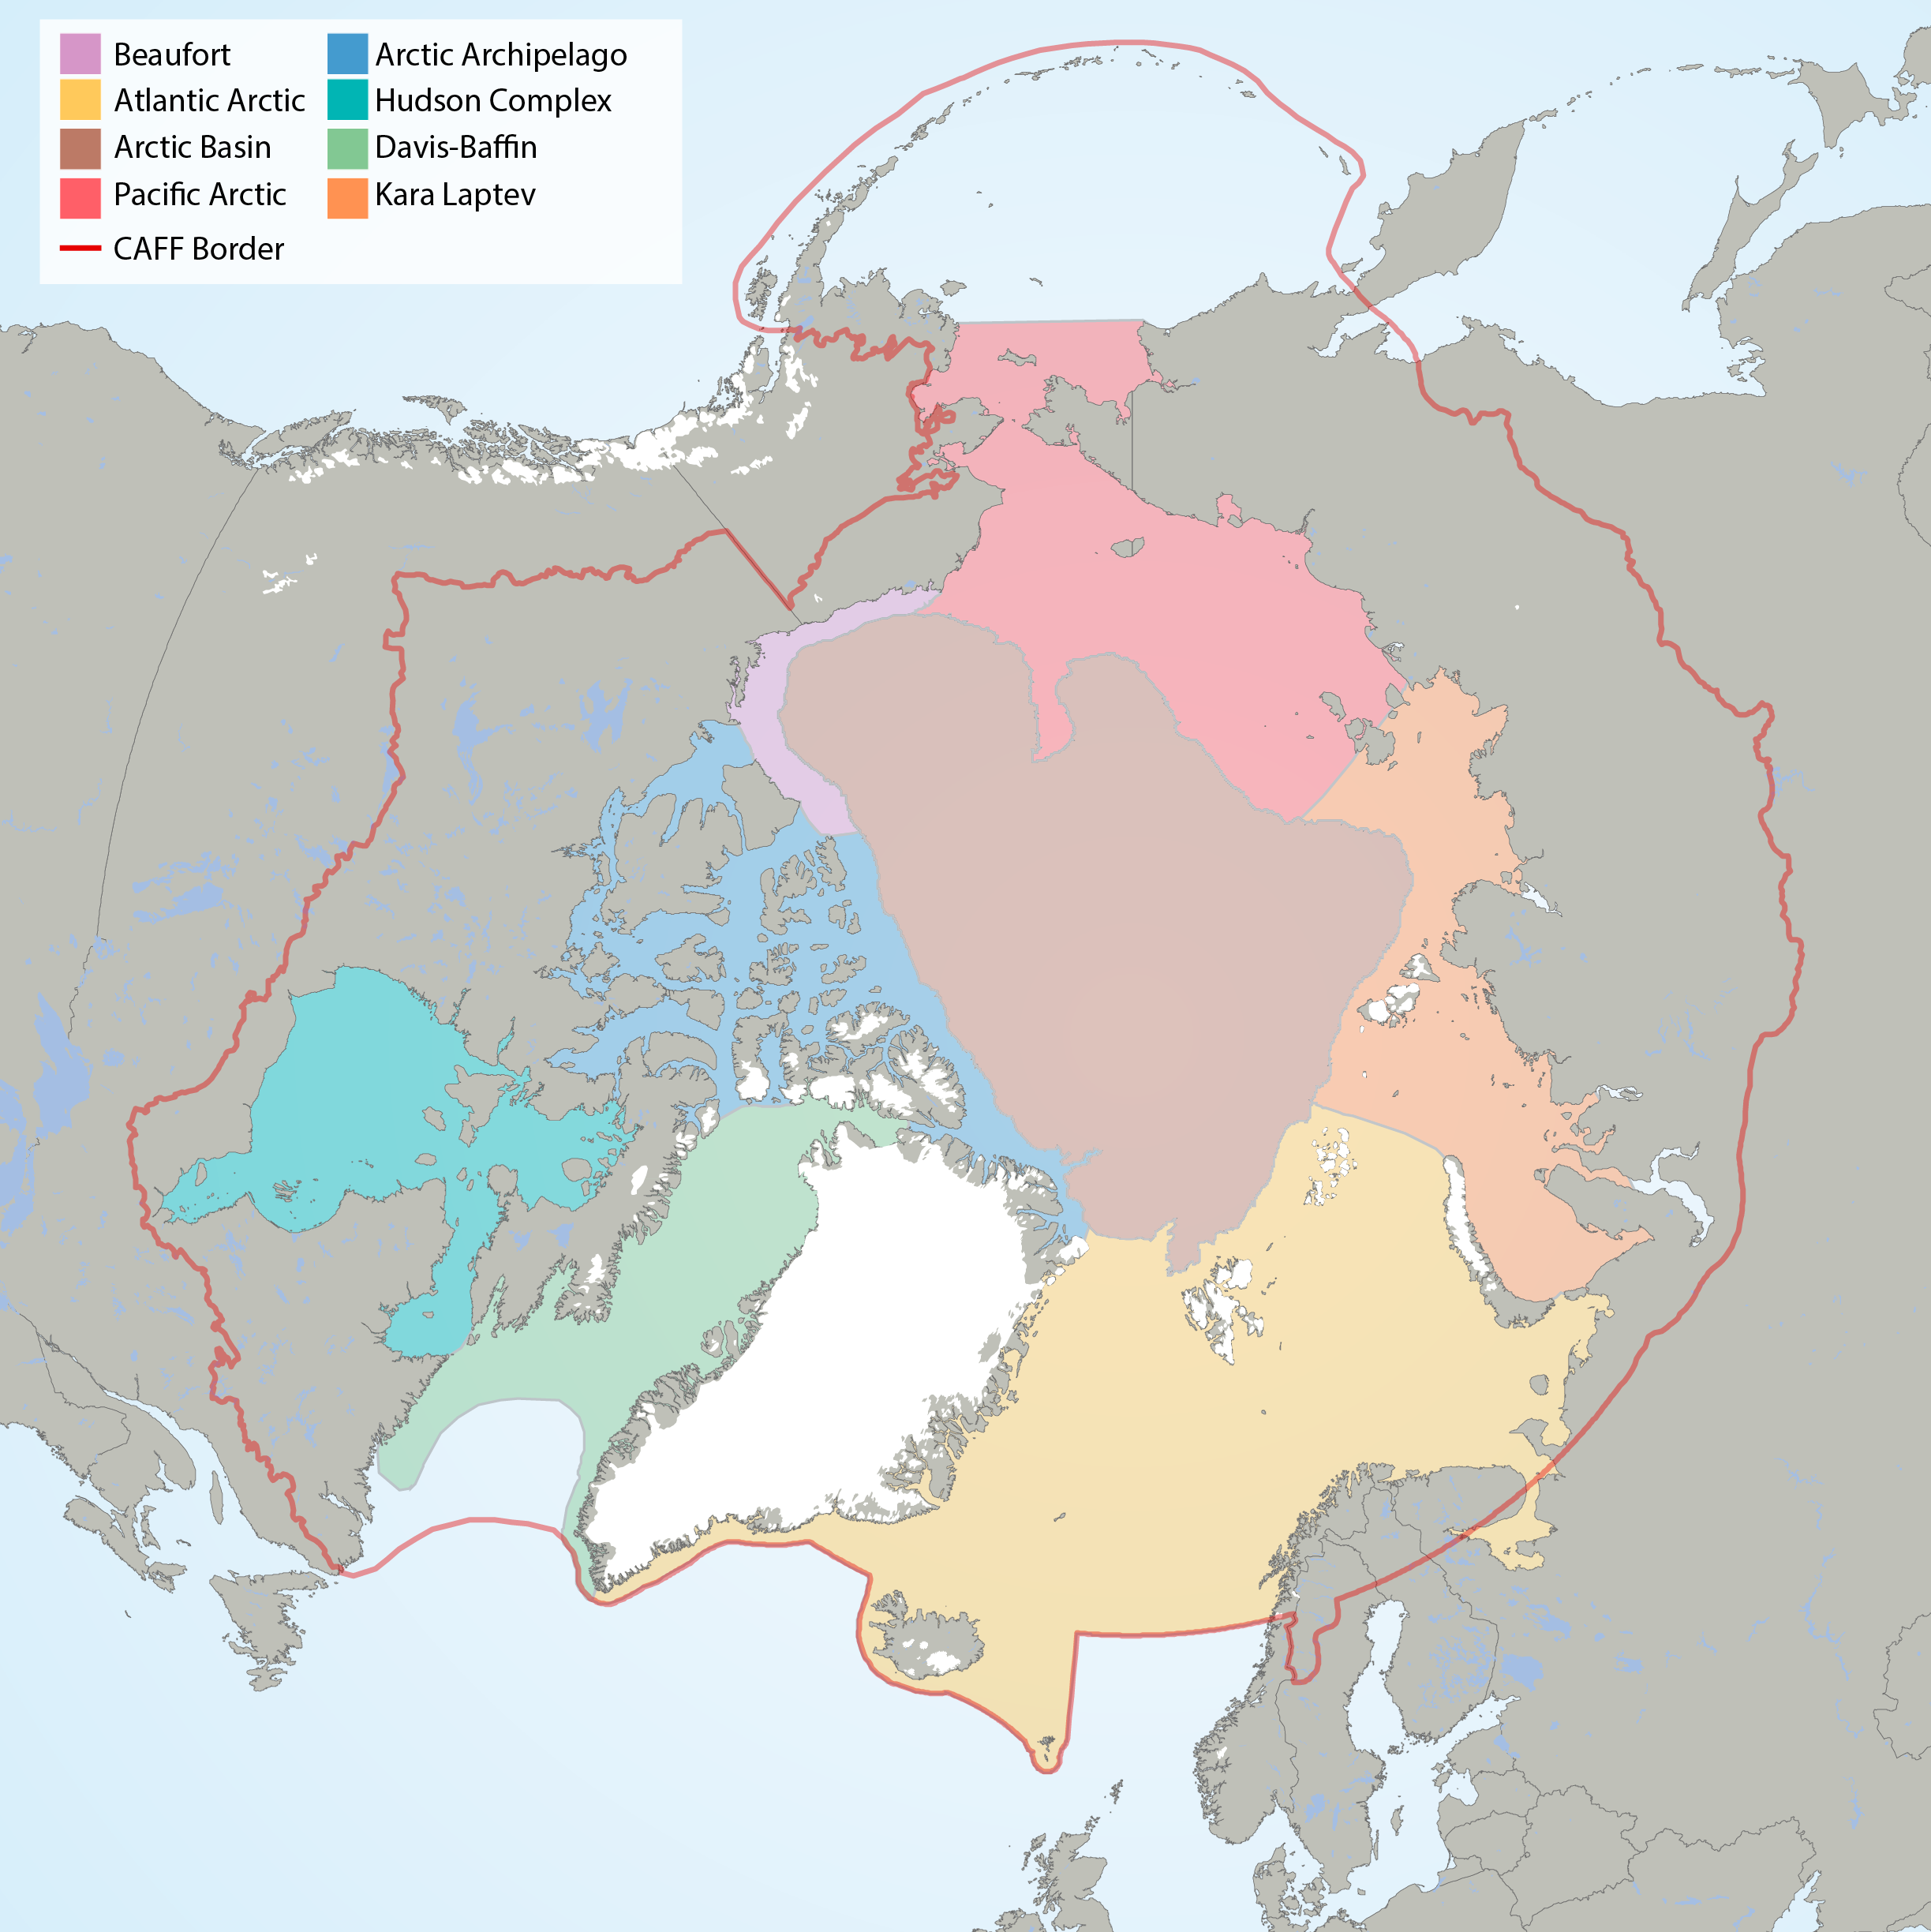
Arctic Marine Areas (AMAs) as defined in the CBMP Marine Plan. STATE OF THE ARCTIC MARINE BIODIVERSITY REPORT - <a href="https://arcticbiodiversity.is/marine" target="_blank">Chapter 1</a> - Page 15 - Figure 1.2
-
Critical to the successful implementation of EBM in the Arctic is the existence of a cohesive circumpolar approach to the collection and management of data and the application of compatible frameworks, standards and protocols that this entails. STATE OF THE ARCTIC MARINE BIODIVERSITY REPORT - <a href="https://arcticbiodiversity.is/marine" target="_blank">Chapter 2</a> - Page 29 - Box Figure 2.2
-
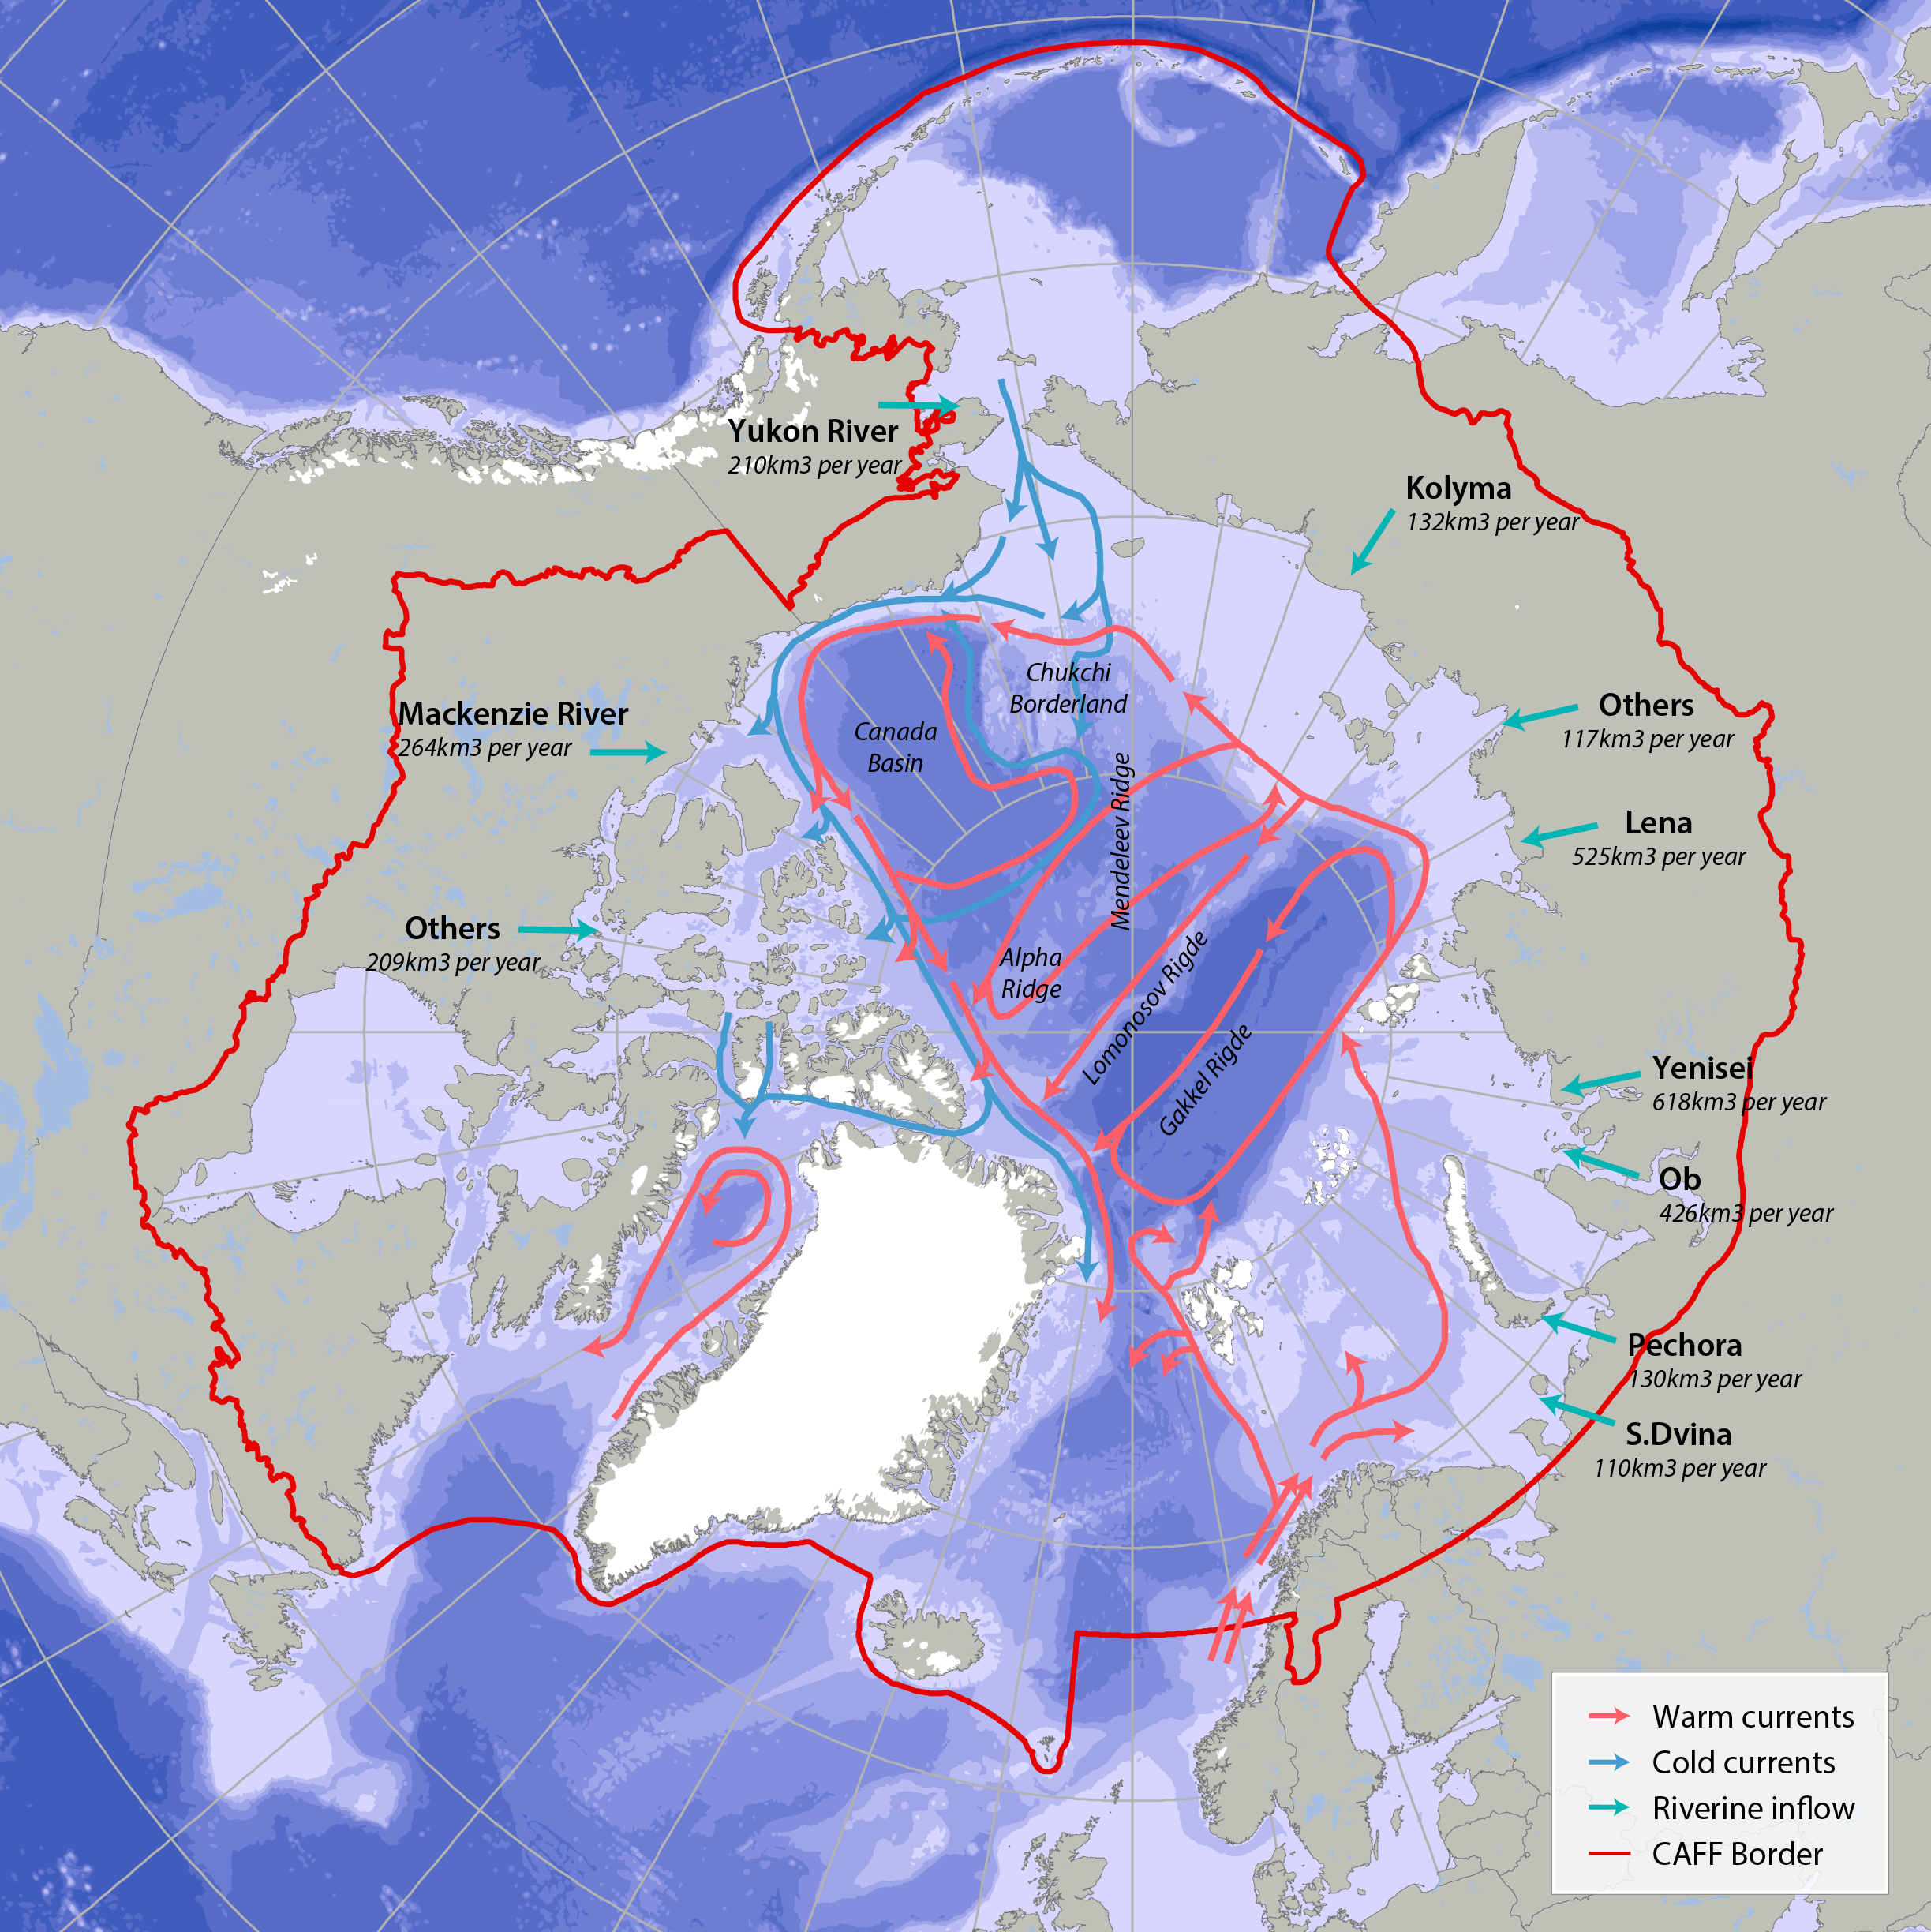
Bathymetric features, warm currents (red arrows), cold currents (blue arrows) and riverine inflow in the Arctic. Adapted from Jakobsen et al. (2012). Simplified Arctic Ocean currents (Fig. 2.1) show that the main circulation patterns follow the continental shelf breaks and margins of the basins in the Arctic Ocean. Different global models predict different types of changes, which can cause changes to Arctic ecosystems (AMAP 2013, Meltofte 2013). STATE OF THE ARCTIC MARINE BIODIVERSITY REPORT - <a href="https://arcticbiodiversity.is/marine" target="_blank">Chapter 2</a> - Page 22 - Figure 2.1
-
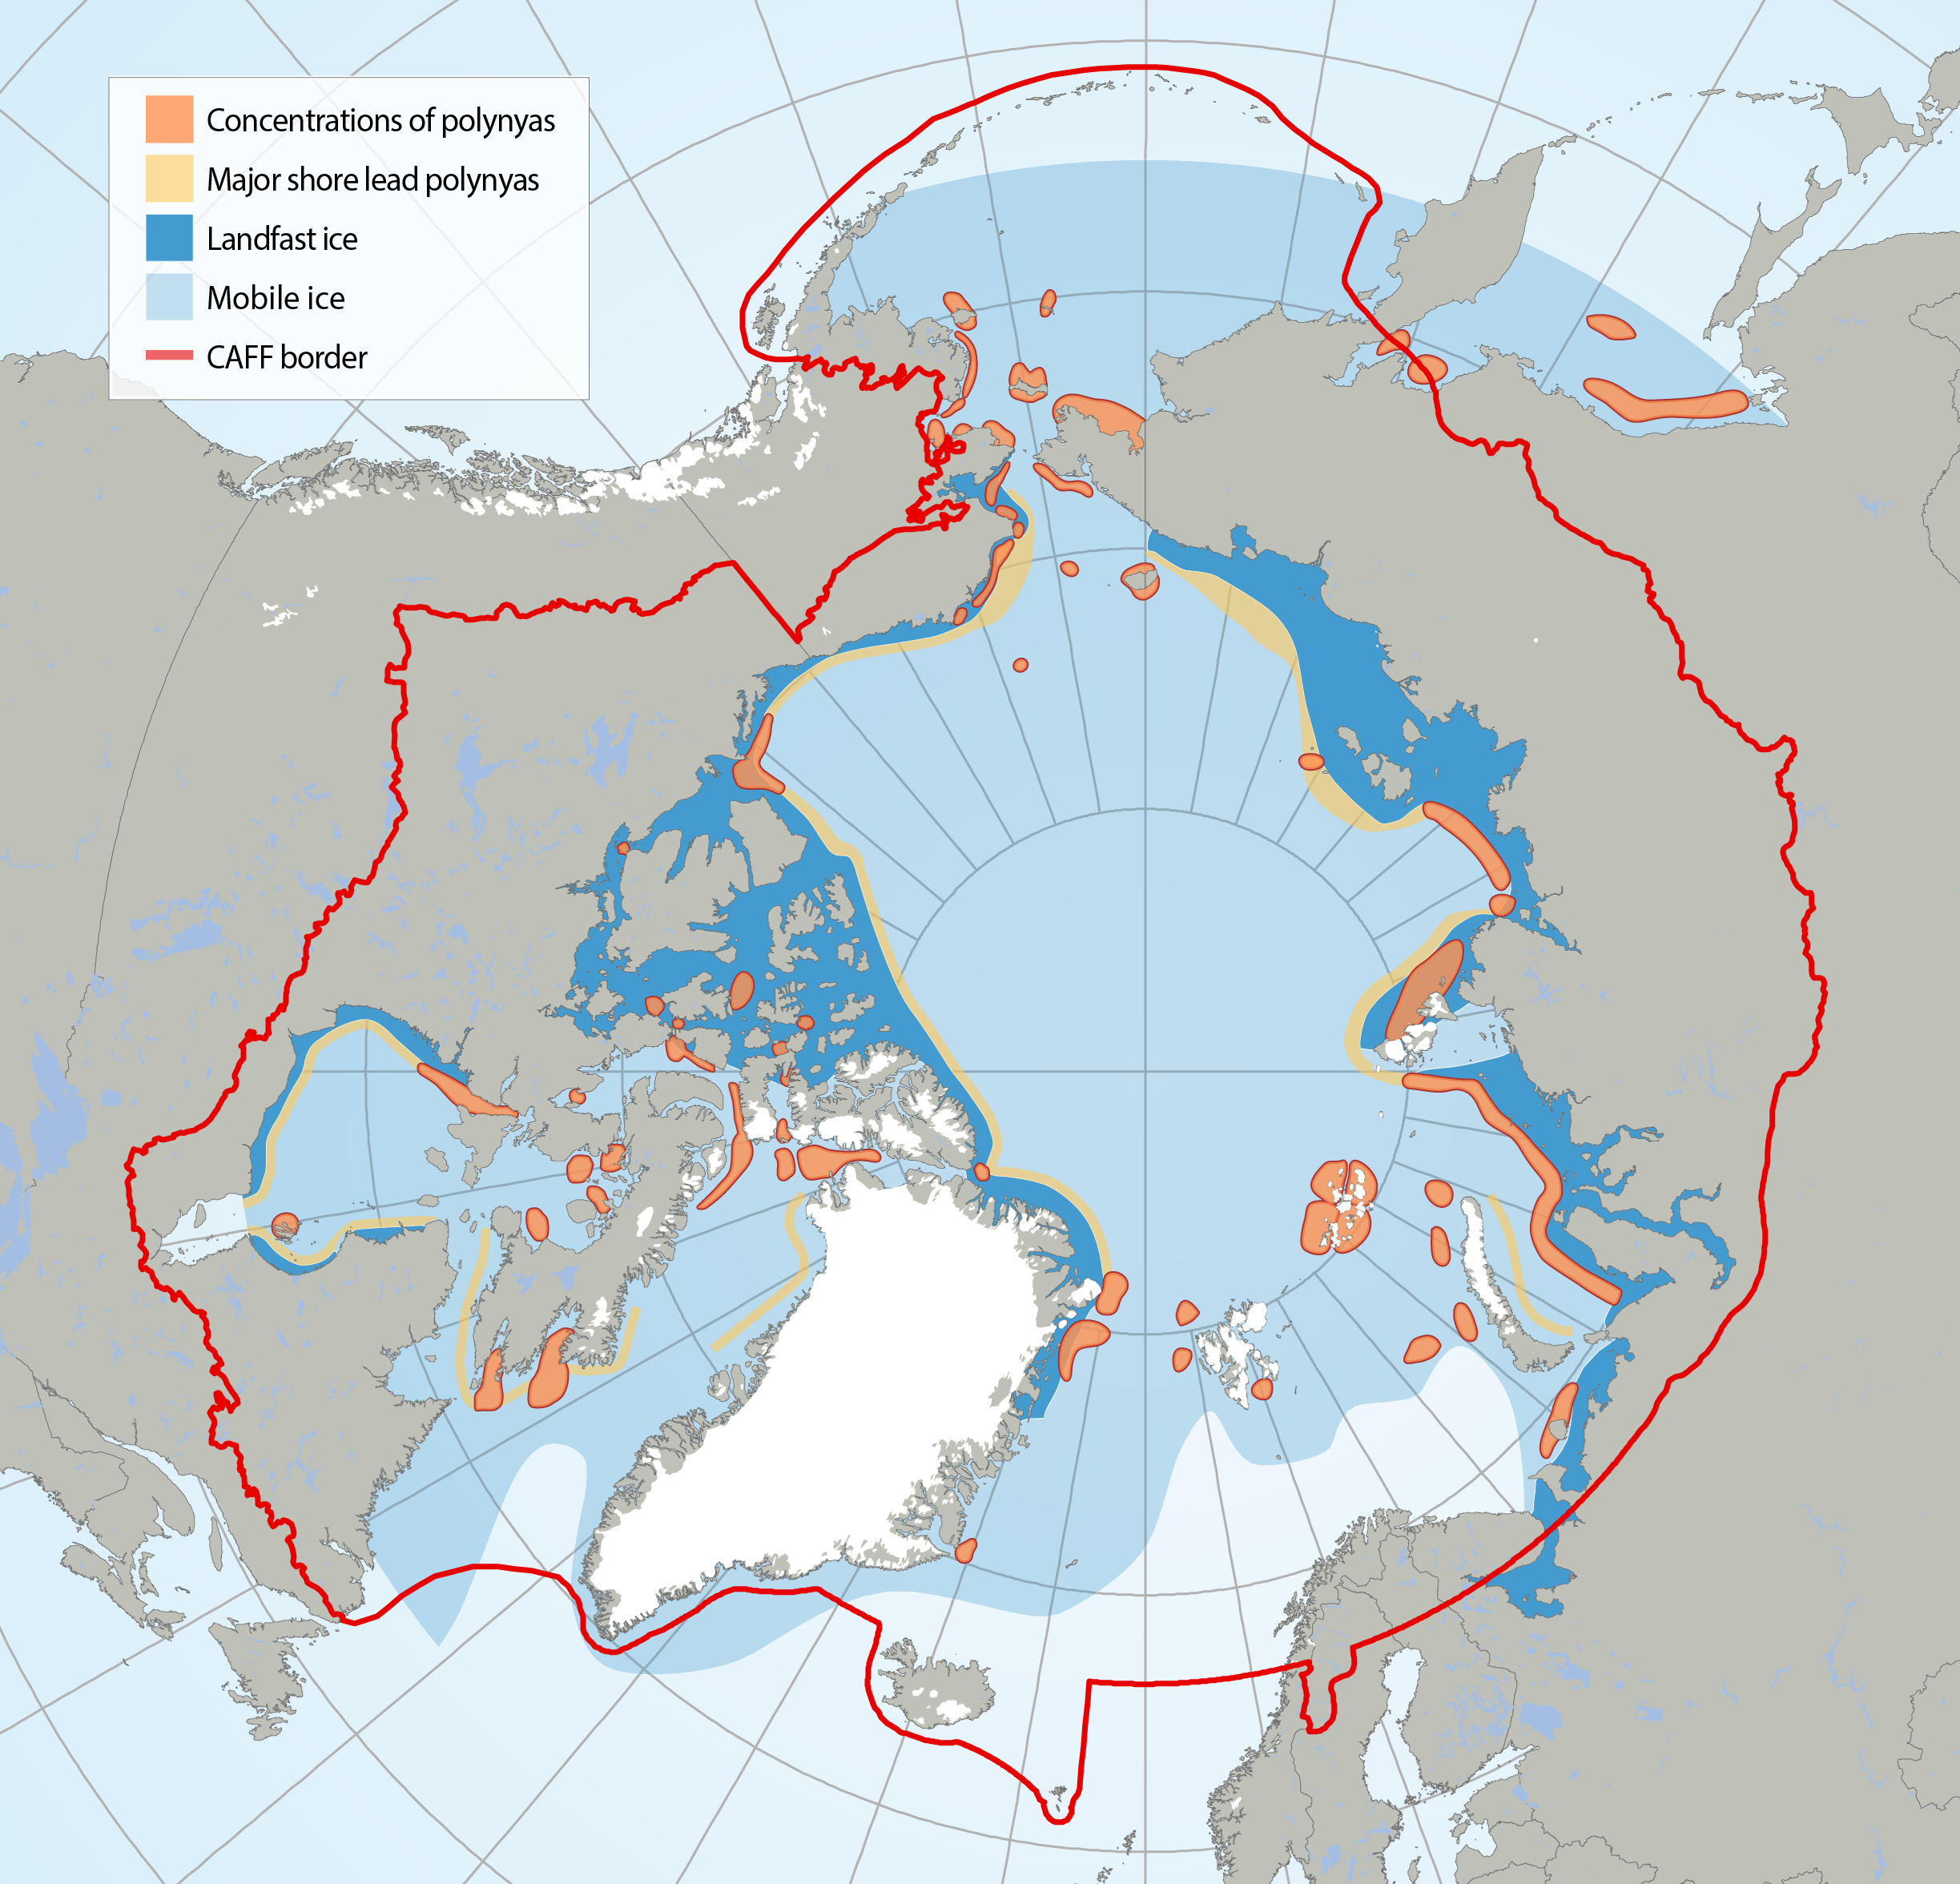
Circumpolar map of known polynyas. Note that polynyas are dynamic systems and some may no longer exist in the form known from their recent history. Adapted from Meltofte (2013) and based on Barber and Massom (2007). STATE OF THE ARCTIC MARINE BIODIVERSITY REPORT - <a href="https://arcticbiodiversity.is/marine" target="_blank">Chapter 2</a> - Page 28 - Figure 2.5
-
The Circumpolar Biodiversity Monitoring Program, a cornerstone programme of the Conservation of Arctic Flora and Fauna (CAFF), Arctic Council working Group is an international network of scientists, government agencies, Indigenous organizations and conservation groups working together to harmonize and integrate efforts to monitor the Arctic's living resources.CBMP experts are developing four coordinated and integrated Arctic Biodiversity Monitoring Plans to help guide circumpolar monitoring efforts. Results will be channeled into effective conservation, mitigation and adaptation policies supporting the Arctic. These plans represent the Arctic's major ecosystems(Marine, Freshwater, Coastal, Terrestrial). It is important that monitoring programs develop the most effective reporting strategies if they are to inform decision making. To facilitate effective and consistent reporting, the CBMP has chosen a suite of indices and indicators that provide a comprehensive picture of the state of Arctic biodiversity – from species to habitats to ecosystem processes to ecological services. These indices and indicators are developed in a hierarchical manner, allowing users to drill down into the data from the higher-order indices to more detailed indicators. These are being developed through an expert consultation process. The Arctic Species Trend Index (ASTI) is part of this suite of indicators and indices developed by CAFFs CBMP. It tracks trends in over 300 Arctic vertebrate species and comprises the Arctic component of the Living Planet Index. It is important to identify how wildlife and ecosystems are changing in order to develop effective conservation and adaptation strategies in the Arctic, an environment undergoing dramatic changes. The ASTI describes overall trends across species, taxonomy, ecosystems, regions and other categories.
-
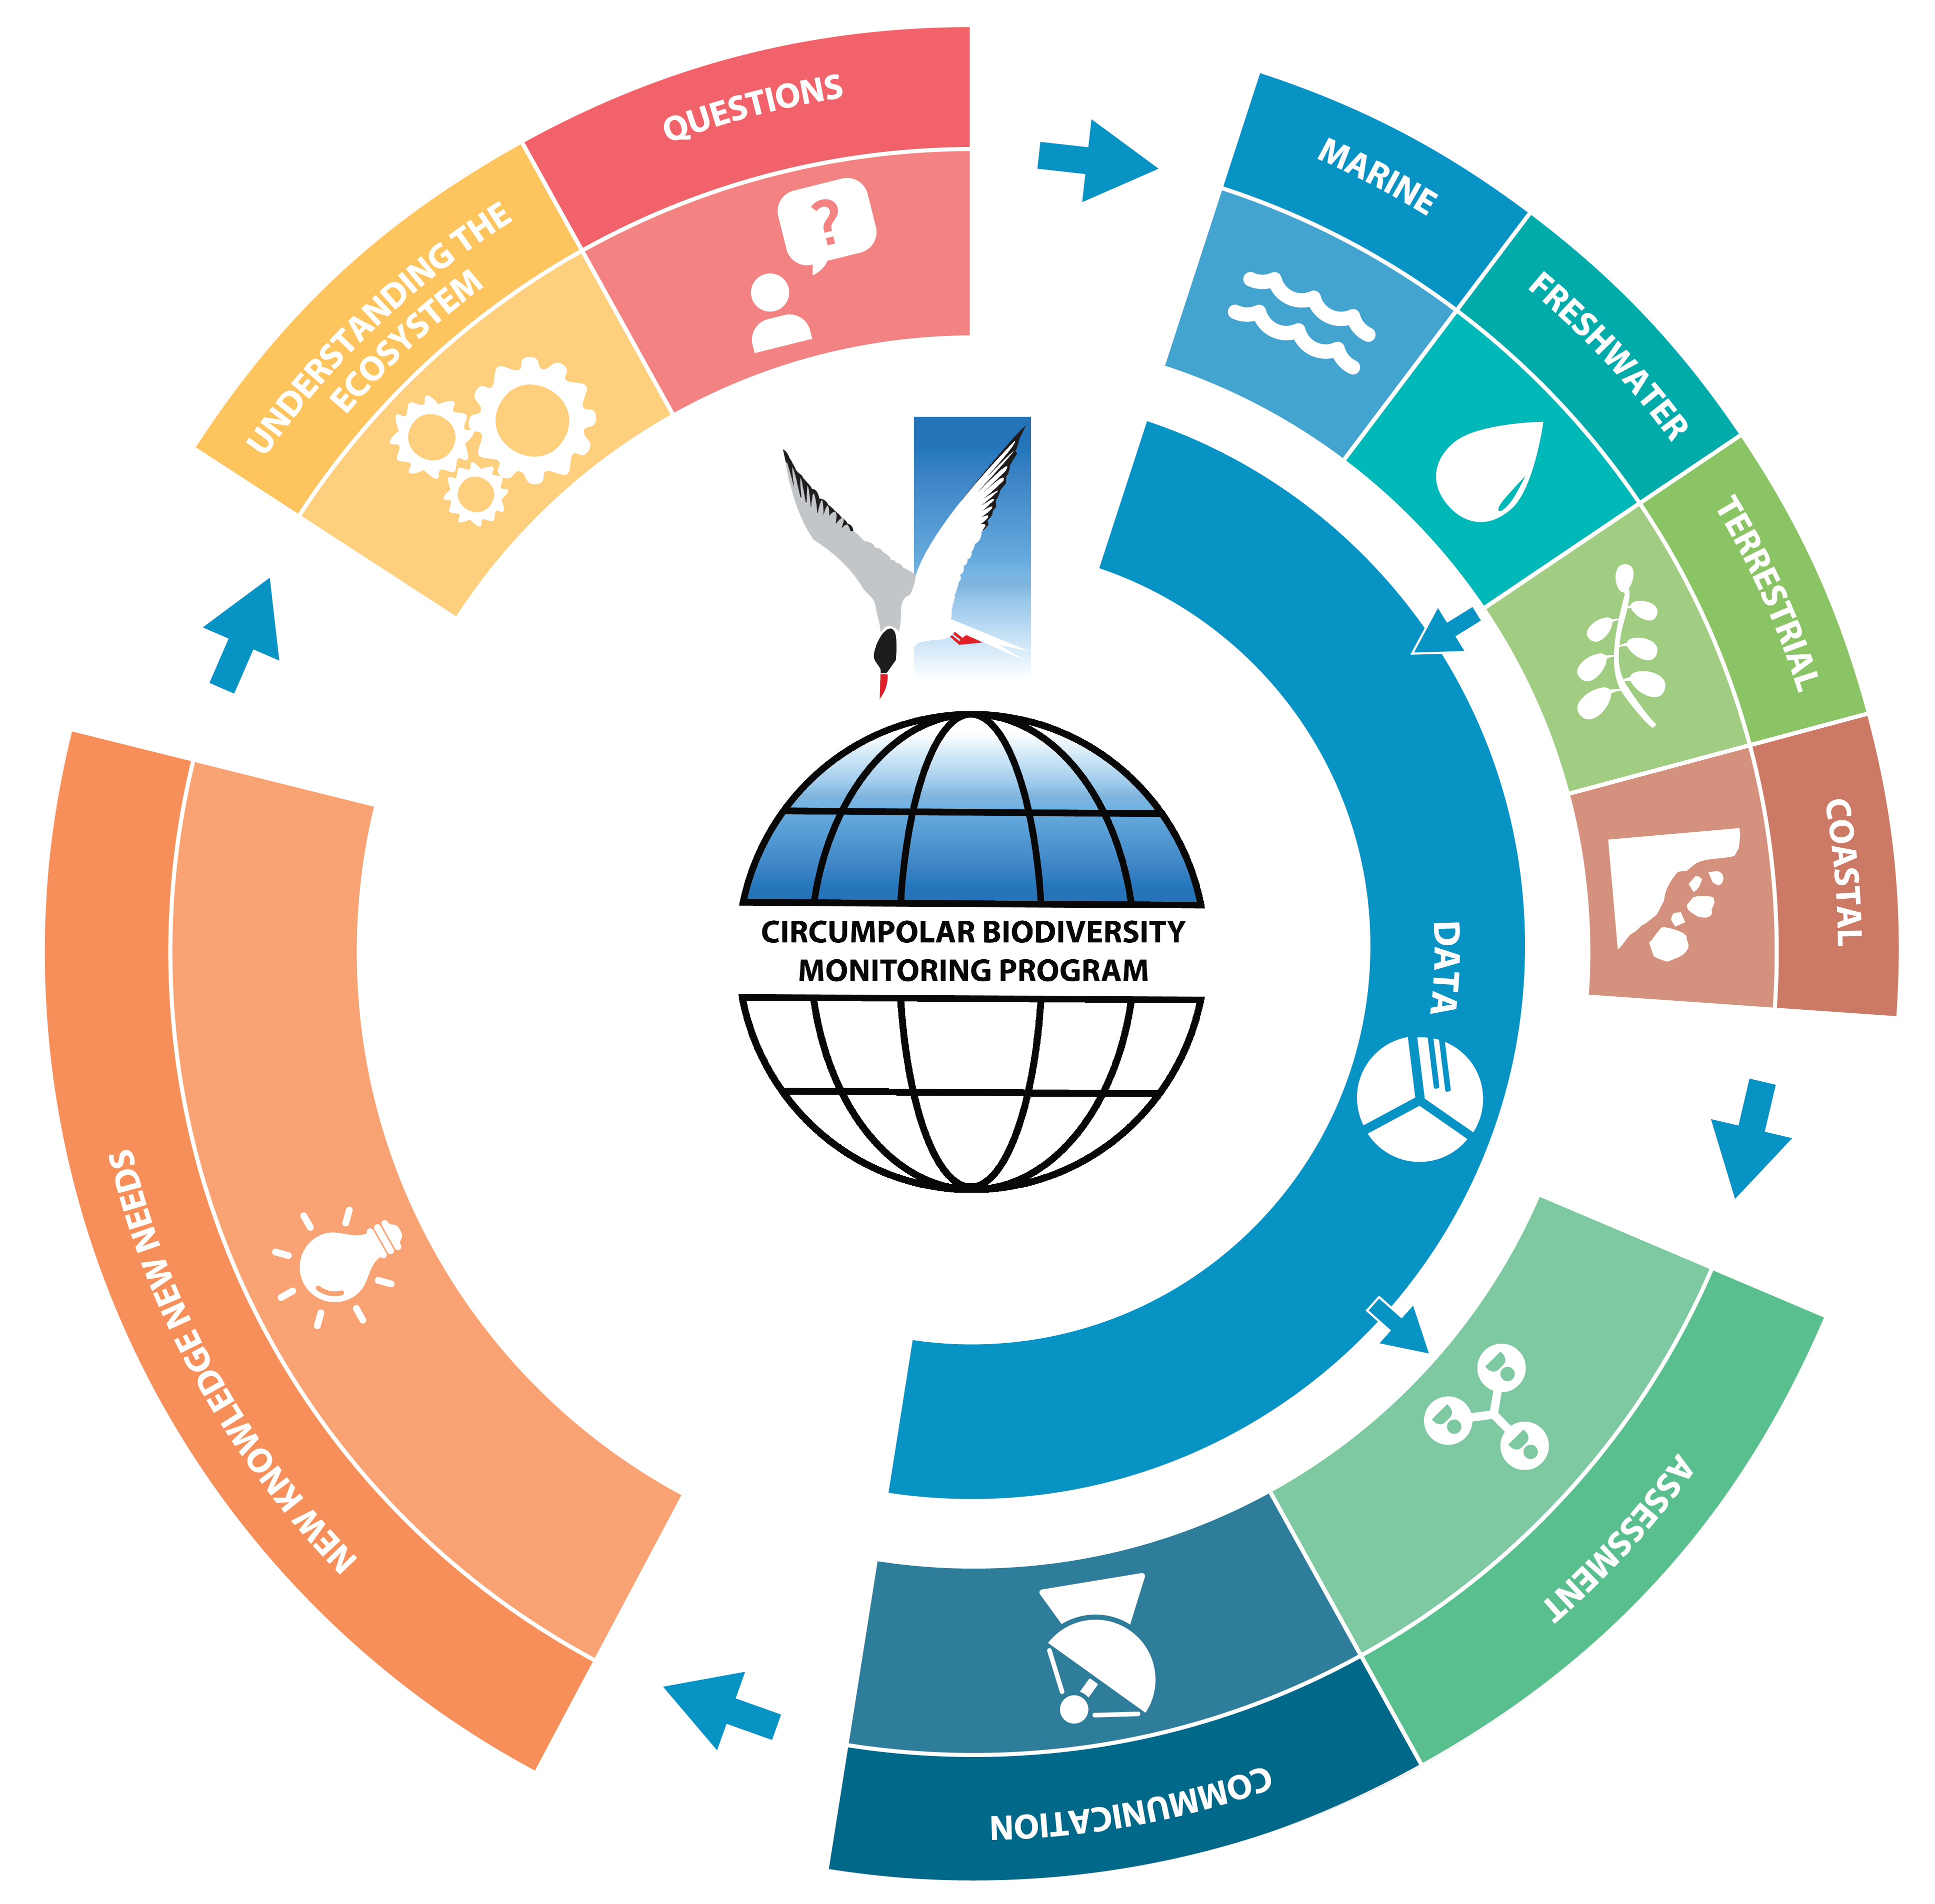
Workflow of the Circumpolar Biodiversity Monitoring Program (CBMP). STATE OF THE ARCTIC MARINE BIODIVERSITY REPORT - <a href="https://arcticbiodiversity.is/marine" target="_blank">Chapter 1</a> - Page 13 - Figure 1.1
-
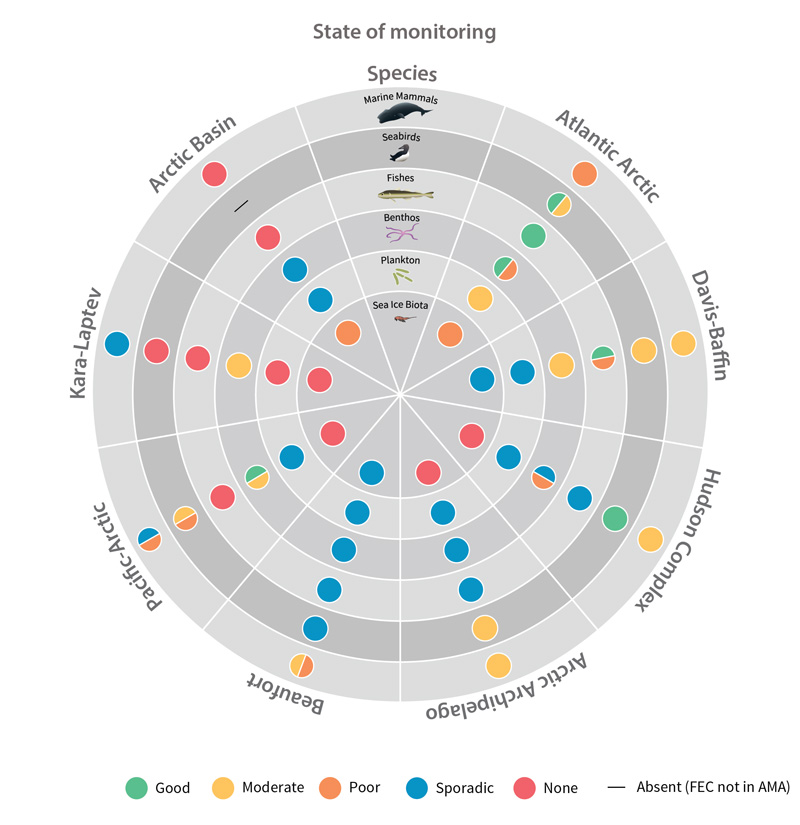
Status of monitoring activities for each Focal Ecosystem Component (i.e., selected species groups) across each Arctic Marine Area as included in this report. STATE OF THE ARCTIC MARINE BIODIVERSITY REPORT - <a href="https://arcticbiodiversity.is/monitoring-status-and-advice" target="_blank">Key Findings</a> - Page 5 - Figure 1
-
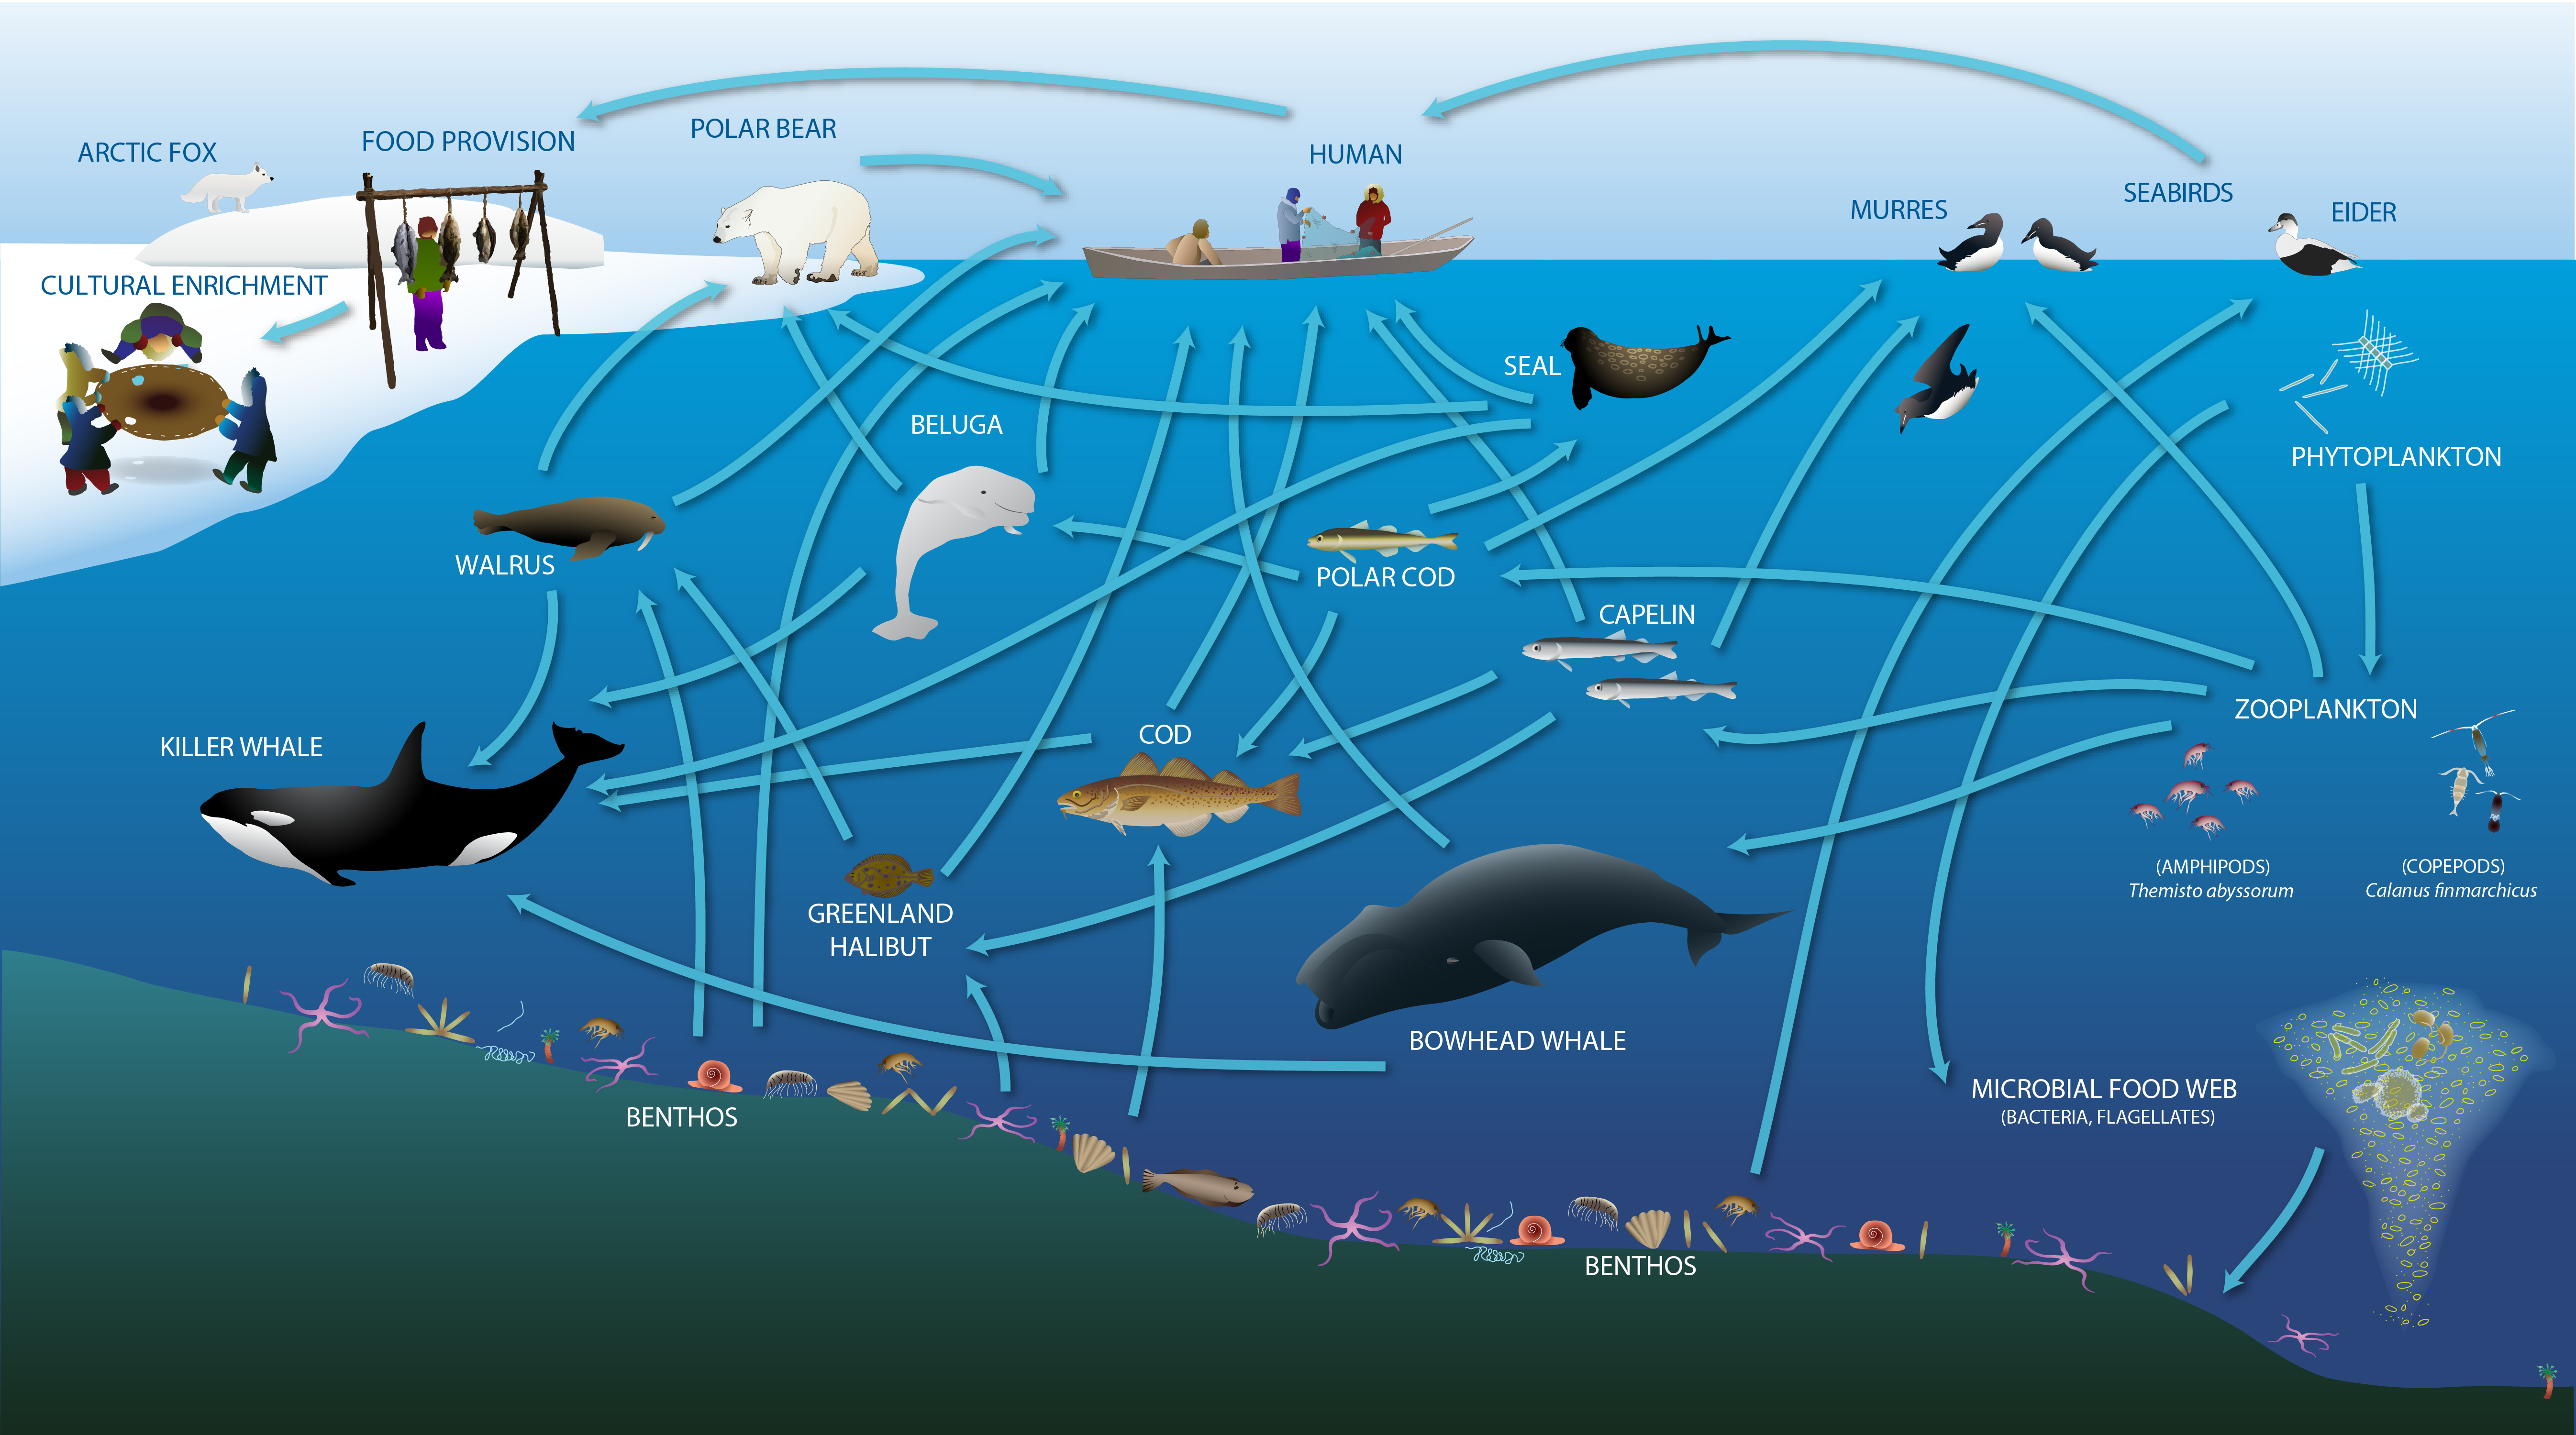
Changes expected or underway in the of energy flow in the High Arctic marine environment STATE OF THE ARCTIC MARINE BIODIVERSITY REPORT - <a href="https://arcticbiodiversity.is/marine" target="_blank">Chapter 2</a> - Page 23 - Figure 2.2b