 CAFF - Arctic Biodiversity Data Service (ABDS)
Conservation of Arctic Flora and Fauna (CAFF)
Type of resources
Available actions
Topics
Keywords
Contact for the resource
Provided by
Years
Formats
Representation types
Update frequencies
status
Service types
Scale
-
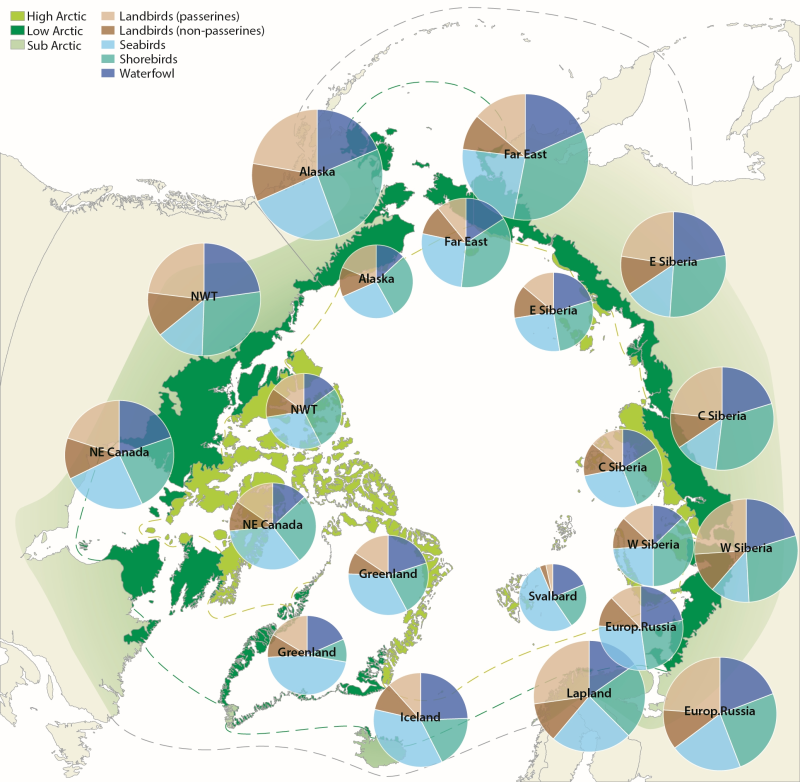
Figure 4.1. Avian biodiversity in different regions of the Arctic. Charts on the inner circle show species numbers of different bird groups in the high Arctic, on the outer circle in the low Arctic. The size of the charts is scaled to the number of species in each region, which ranges from 32 (Svalbard) to 117 (low Arctic Alaska). CAFF 2013. Arctic Biodiversity Assessment. Status and Trends in Arctic biodiversity. Conservation of Arctic Flora and Fauna, Akureyri - Birds (Chapter 4) page 145
-
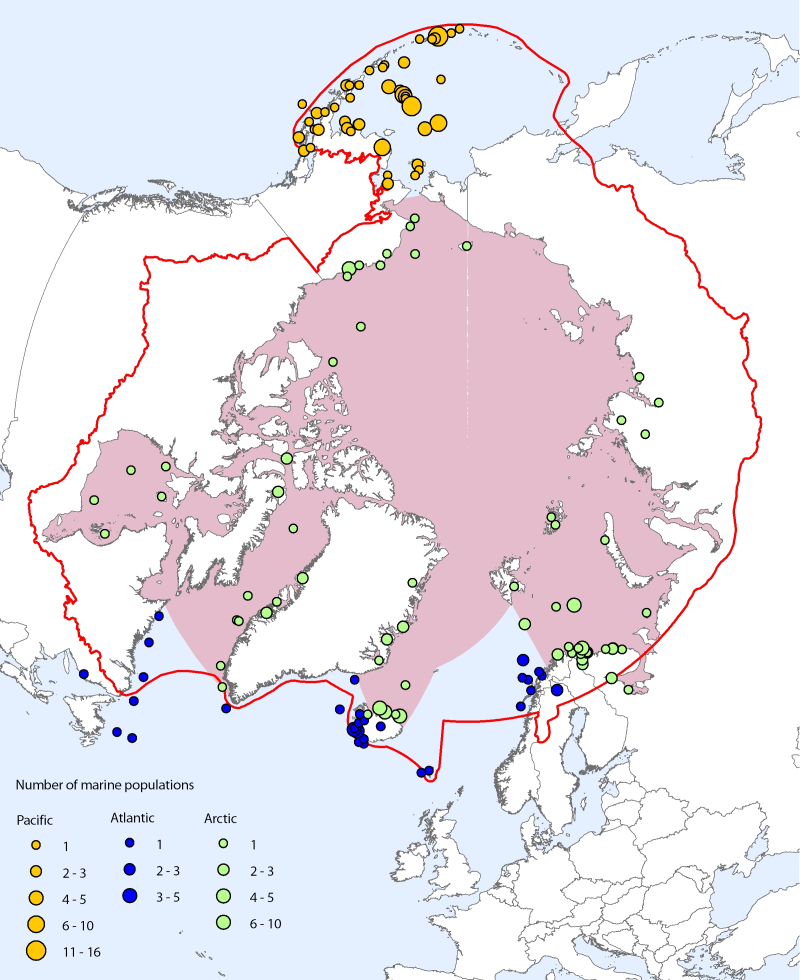
<img src="http://geo.abds.is/geonetwork/srv/eng//resources.get?uuid=59d822e4-56ce-453c-b98d-40207a2e9eec&fname=cbmp_small.png" alt="logo" height="67px" align="left" hspace="10px"> The Arctic marine data set contains a total of 111 species and 310 population time series from 170 locations. Species coverage is about 34% of Arctic marine vertebrate species (100% of mammals, 53% of birds, and 27% of fishes) (Bluhm et al. 2011). At the species level, even though the representation of Arctic fish species is lower than that of mammals and birds, the data are dominated by fishes, primarily from the Pacific Ocean (especially the Bering Sea and Aleutian Islands). However, there are more population time series in total for bird species, which is reflective of this group being both better studied historically and also monitored at many small study sites compared to fish and marine mammal species, which are regularly monitored at a much larger scale through stock management. Note that the time span selected for marine analyses is 1970 to 2005 (compared with 1970 to 2007 for the ASTI for all species). CAFF Assessment Series No. 7 April 2012 - <a href=http://caff.is/asti/asti-publications/28-arctic-species-trend-index-tracking-trends-in-arctic-marine-populations" target="_blank"> The Arctic Species Trend Index - Tracking trends in Arctic marine populations </a>
-
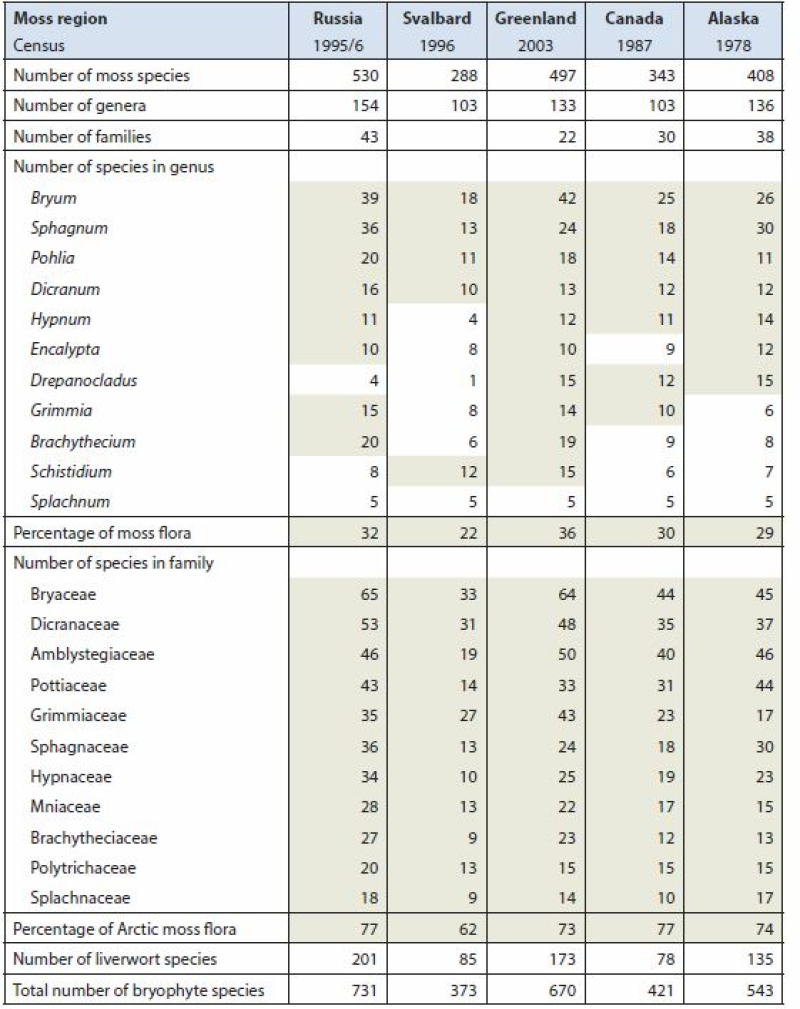
Arctic Biodiversity Assessment (ABA) 2013. Table 9.5. Species numbers of species-rich moss genera and families. Numbers highlighted in grey fields are used in calculating the percentage of the total moss flora. Listed are Splachnum, genera with at least 10 species and families with at least nine species. Conservation of Arctic Flora and Fauna, CAFF 2013 - Akureyri . Arctic Biodiversity Assessment. Status and Trends in Arctic biodiversity. - Plants(Chapter 9) page 333
-
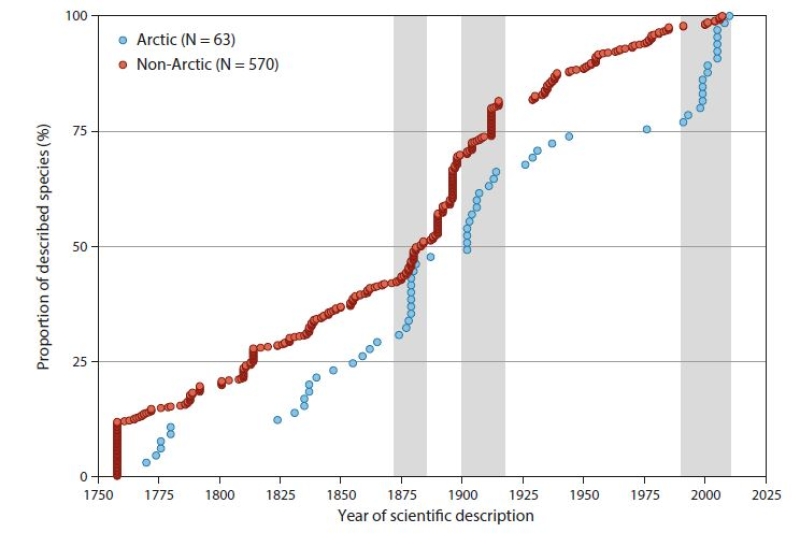
Cumulative numbers of marine fish diversity (n = 633, Appendix 6.2) in the Arctic Ocean and adjacent seas (AOAS) from 1758 to the present. Species are broadly grouped according to zoogeographic pattern (cf. Section 6.3.1): Arctic (A, blue symbols) and non-Arctic (Σ AB, B, WD, red symbols). Grey bars denote periods with many descriptions of new Arctic species. Note that 75% of the non-Arctic species known to science were described by 1912, whereas the same proportion for Arctic species was only reached in 1976. See text for further information. Conservation of Arctic Flora and Fauna, CAFF 2013 - Akureyri . Arctic Biodiversity Assessment. Status and Trends in Arctic biodiversity. - Fishes(Chapter 6) page 220
-
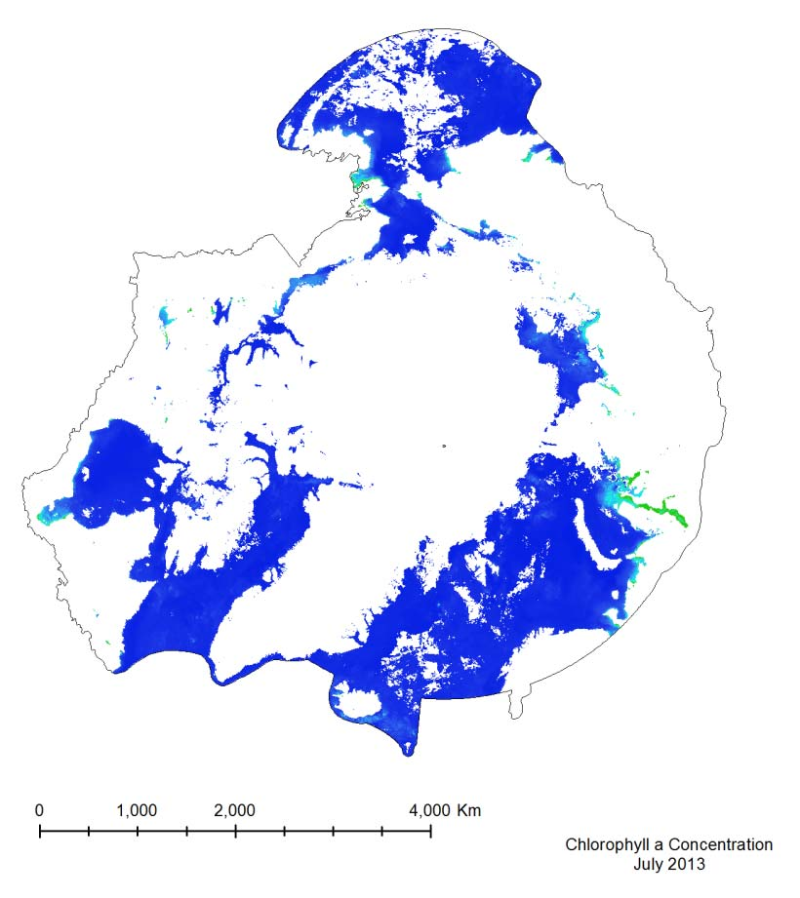
The MODIS marine chlorophyll a product provided, similar to SST, is a 4 km global monthly composite based on smaller resolution daily imagery compiled by NASA. The imagery is reliant on clear ocean (free of clouds and ice) so only months from March to October have been provided, as the chlorophyll levels in the Arctic diminish during the winter months, when sea ice is prevalent. The marine chlorophyll a is measured in mg/m3
-
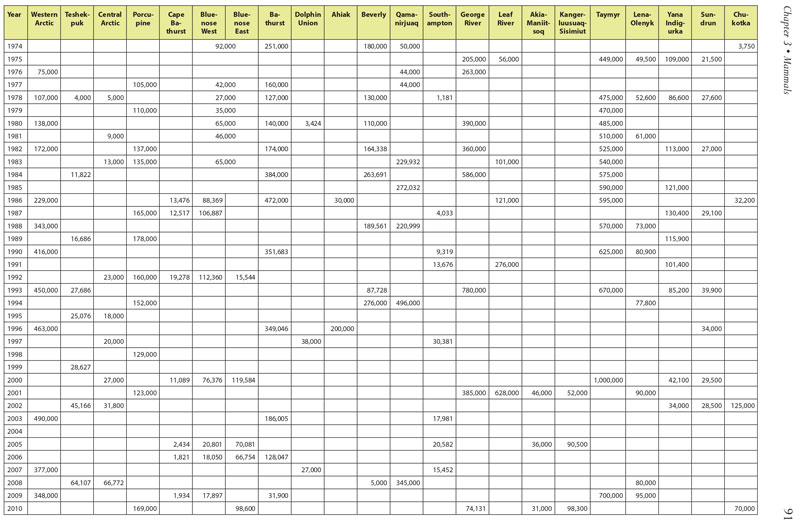
Table 3.1. Summary of historical population estimates for 22 circumpolar caribou and wild reindeer herds. Data courtesy of Circum-Arctic Rangifer Monitoring Assessment Network (CARMA) and D.E. Russell & A. Gunn; www.carmanetwork.com/display/ public/home. Data vary substantially among herds and over time in accuracy and precision, and represent only general patterns of abundance. Conservation of Arctic Flora and Fauna, CAFF 2013 - Akureyri . Arctic Biodiversity Assessment. Status and Trends in Arctic biodiversity. - Mammals(Chapter 3) page 91
-
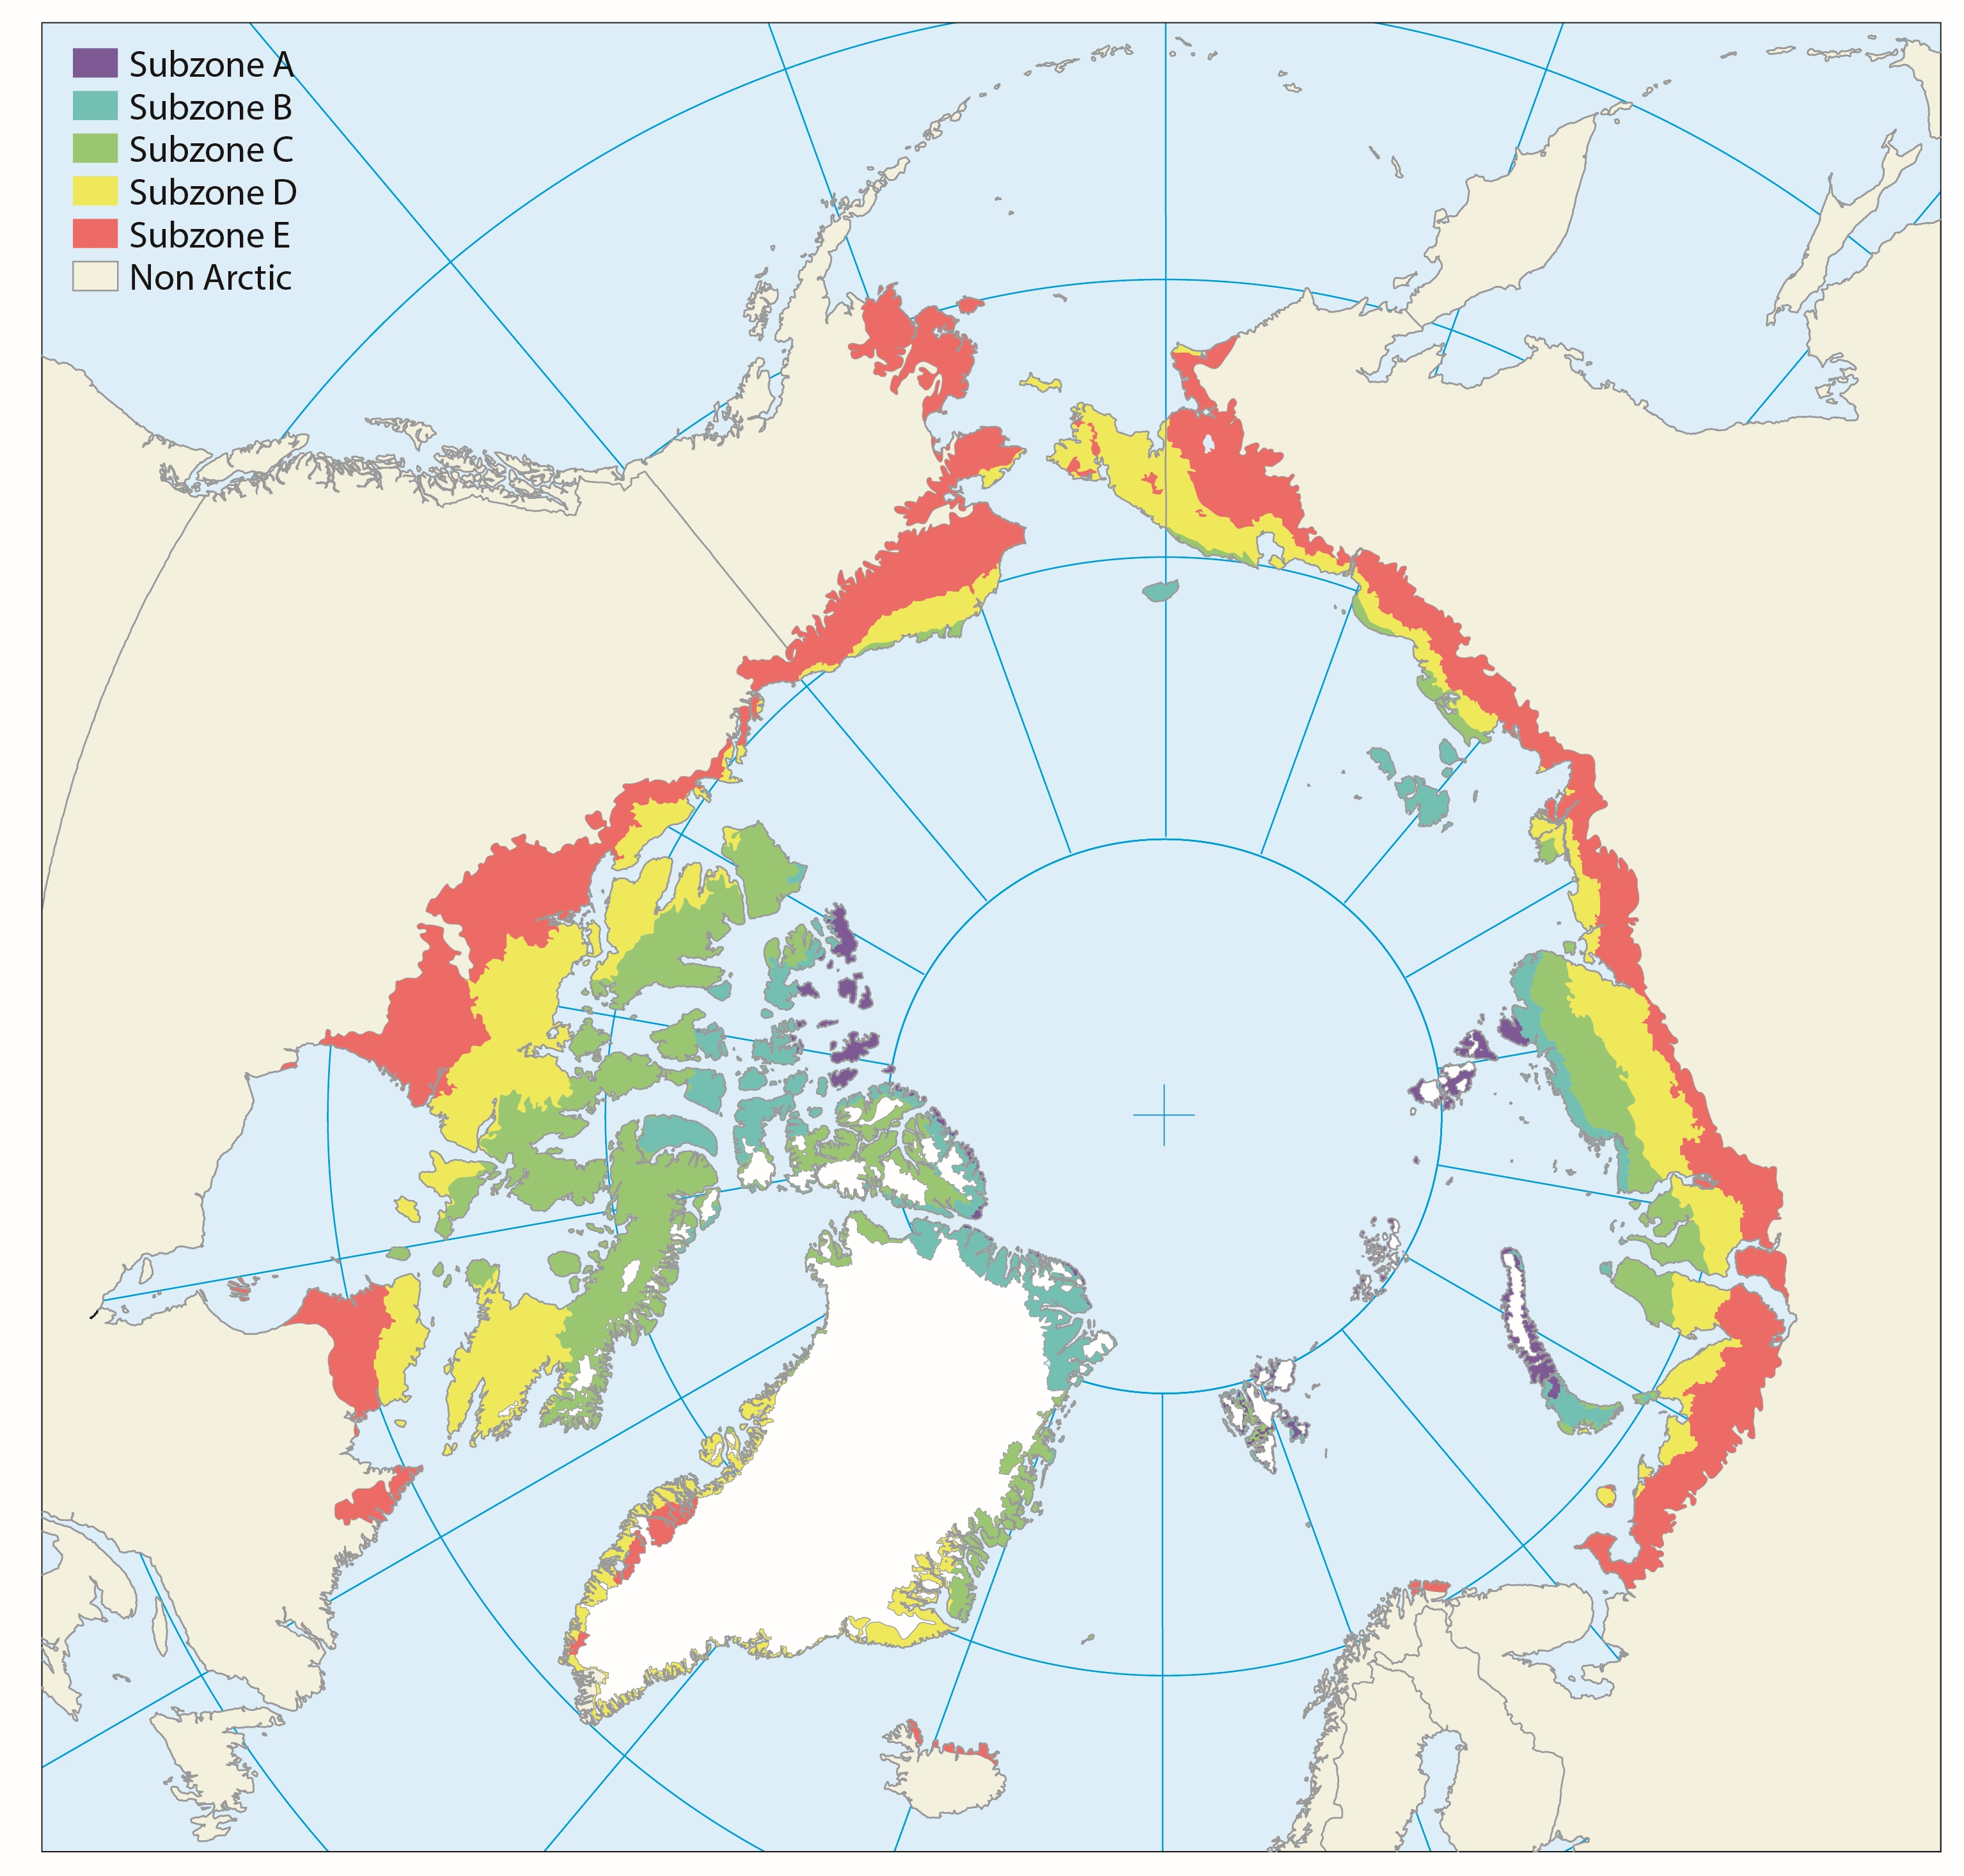
The Arctic territory is roughly subdivided along two main axes in latitudinal subzones (Fig. 9.1) and longitudinal floristic provinces (Fig. 9.2). The latitudinal northsouth axis mainly reflects the present climate gradient divided into five different subzones, which are separated according to climate and vegetation in the lowlands of each zone. Published in the Arctic Biodiversity Assessment, Chapter 9 - released in 2013
-
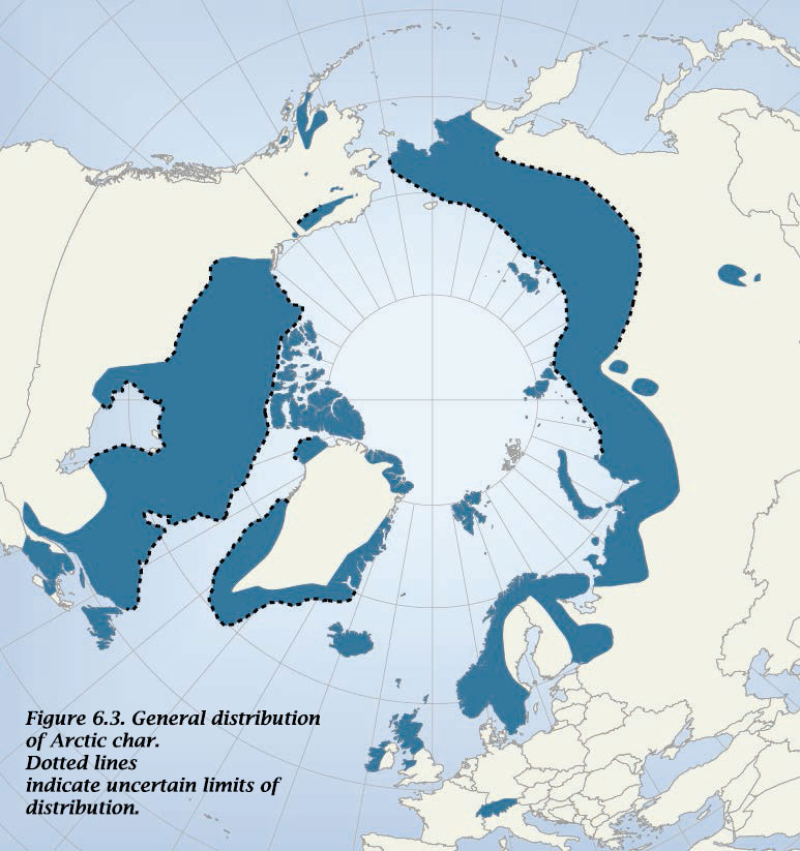
Circumpolar distribution of arctic char species complex Salvelinus alpinus, and related species. - <a href="http://www.caff.is/assessment-series/10-arctic-biodiversity-assessment/211-arctic-biodiversity-assessment-2013-chapter-6-fishes" target="_blank"> Arctic Biodiversity Assessment, Chapter 6: Fishes</a>
-
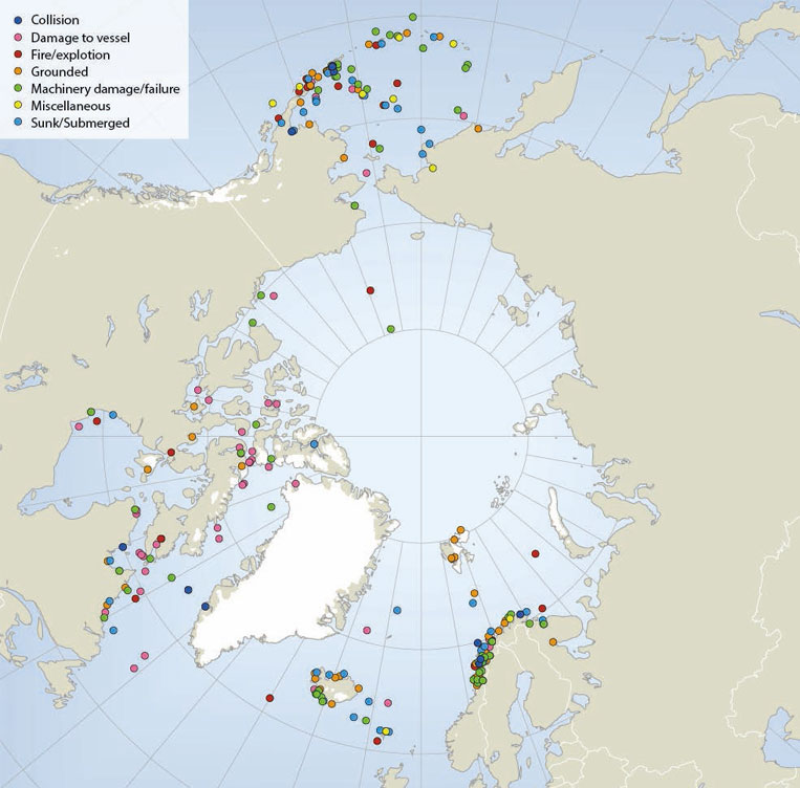
Locations of sub-Arctic and Arctic shipping accidents and incident causes, 1995-2004 (source: Arctic Marine Shipping Assessment 2009). Published in the Arctic Biodiversity Assessment (ABA) released in 2014.
-
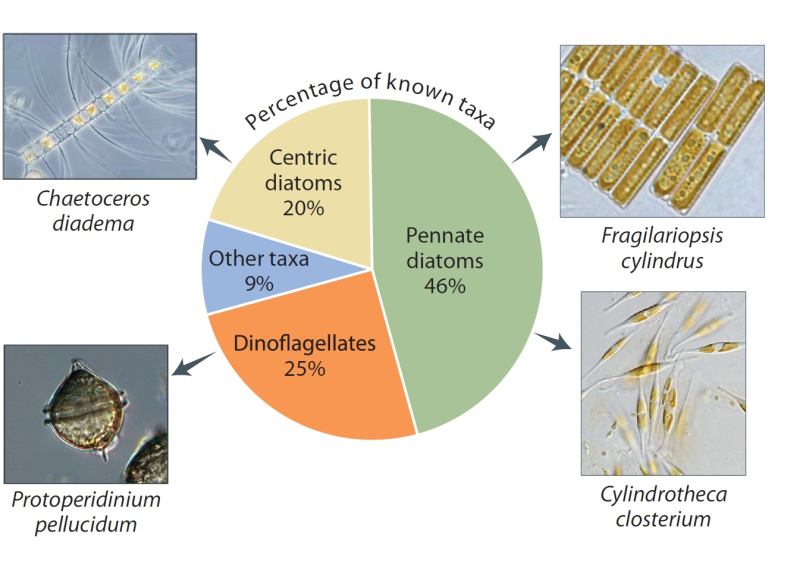
The number of species depends partly on what has been studied. Proportions vary somewhat around the Arctic, but diatoms and dinoflagellates are the most diverse groups everywhere. The greatest sampling effort has been in the Laptev Sea, Hudson Bay, and the Norwegian sector of the Barents Sea. Species shown are among the most commonly recorded. Published in the Life Linked to Ice released in 2013, page 26. Life Linked to Ice: A guide to sea-ice-associated biodiversity in this time of rapid change. CAFF Assessment Series No. 10. Conservation of Arctic Flora and Fauna, Iceland. ISBN: 978-9935-431-25-7.