 CAFF - Arctic Biodiversity Data Service (ABDS)
SAMBR
Type of resources
Available actions
Topics
Keywords
Contact for the resource
Provided by
Representation types
Update frequencies
status
Scale
-
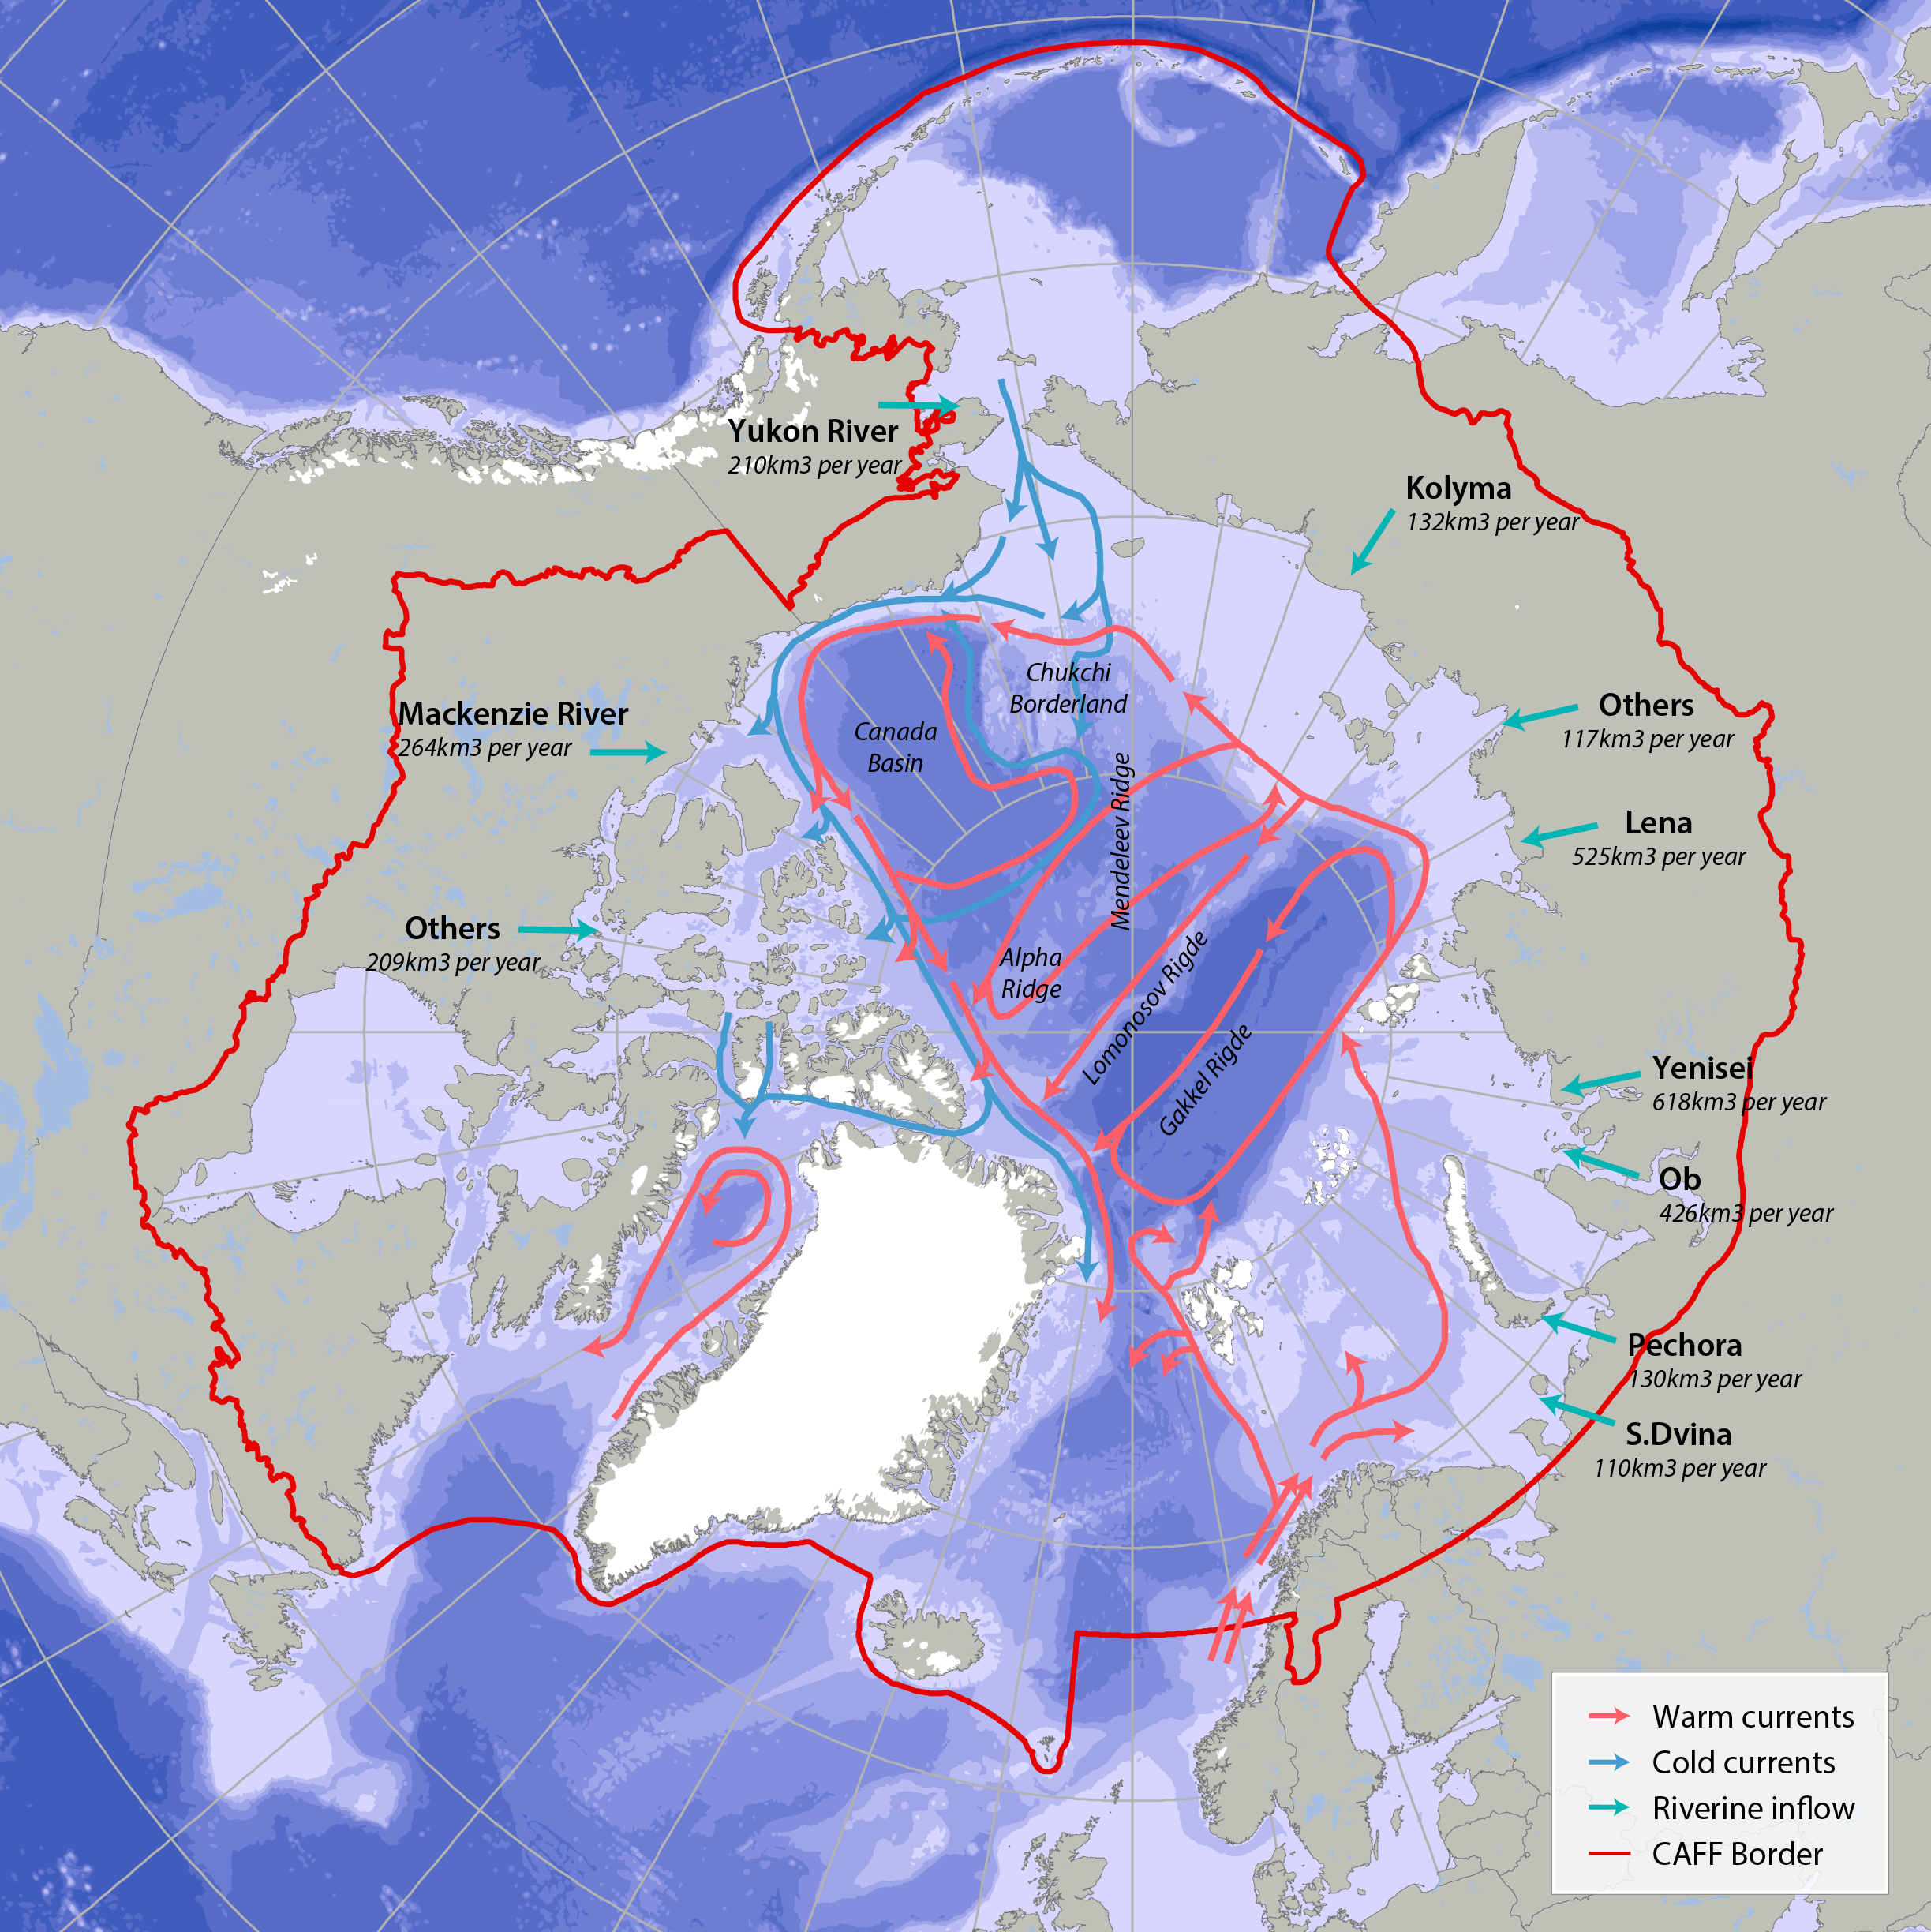
Bathymetric features, warm currents (red arrows), cold currents (blue arrows) and riverine inflow in the Arctic. Adapted from Jakobsen et al. (2012). Simplified Arctic Ocean currents (Fig. 2.1) show that the main circulation patterns follow the continental shelf breaks and margins of the basins in the Arctic Ocean. Different global models predict different types of changes, which can cause changes to Arctic ecosystems (AMAP 2013, Meltofte 2013). STATE OF THE ARCTIC MARINE BIODIVERSITY REPORT - <a href="https://arcticbiodiversity.is/marine" target="_blank">Chapter 2</a> - Page 22 - Figure 2.1
-
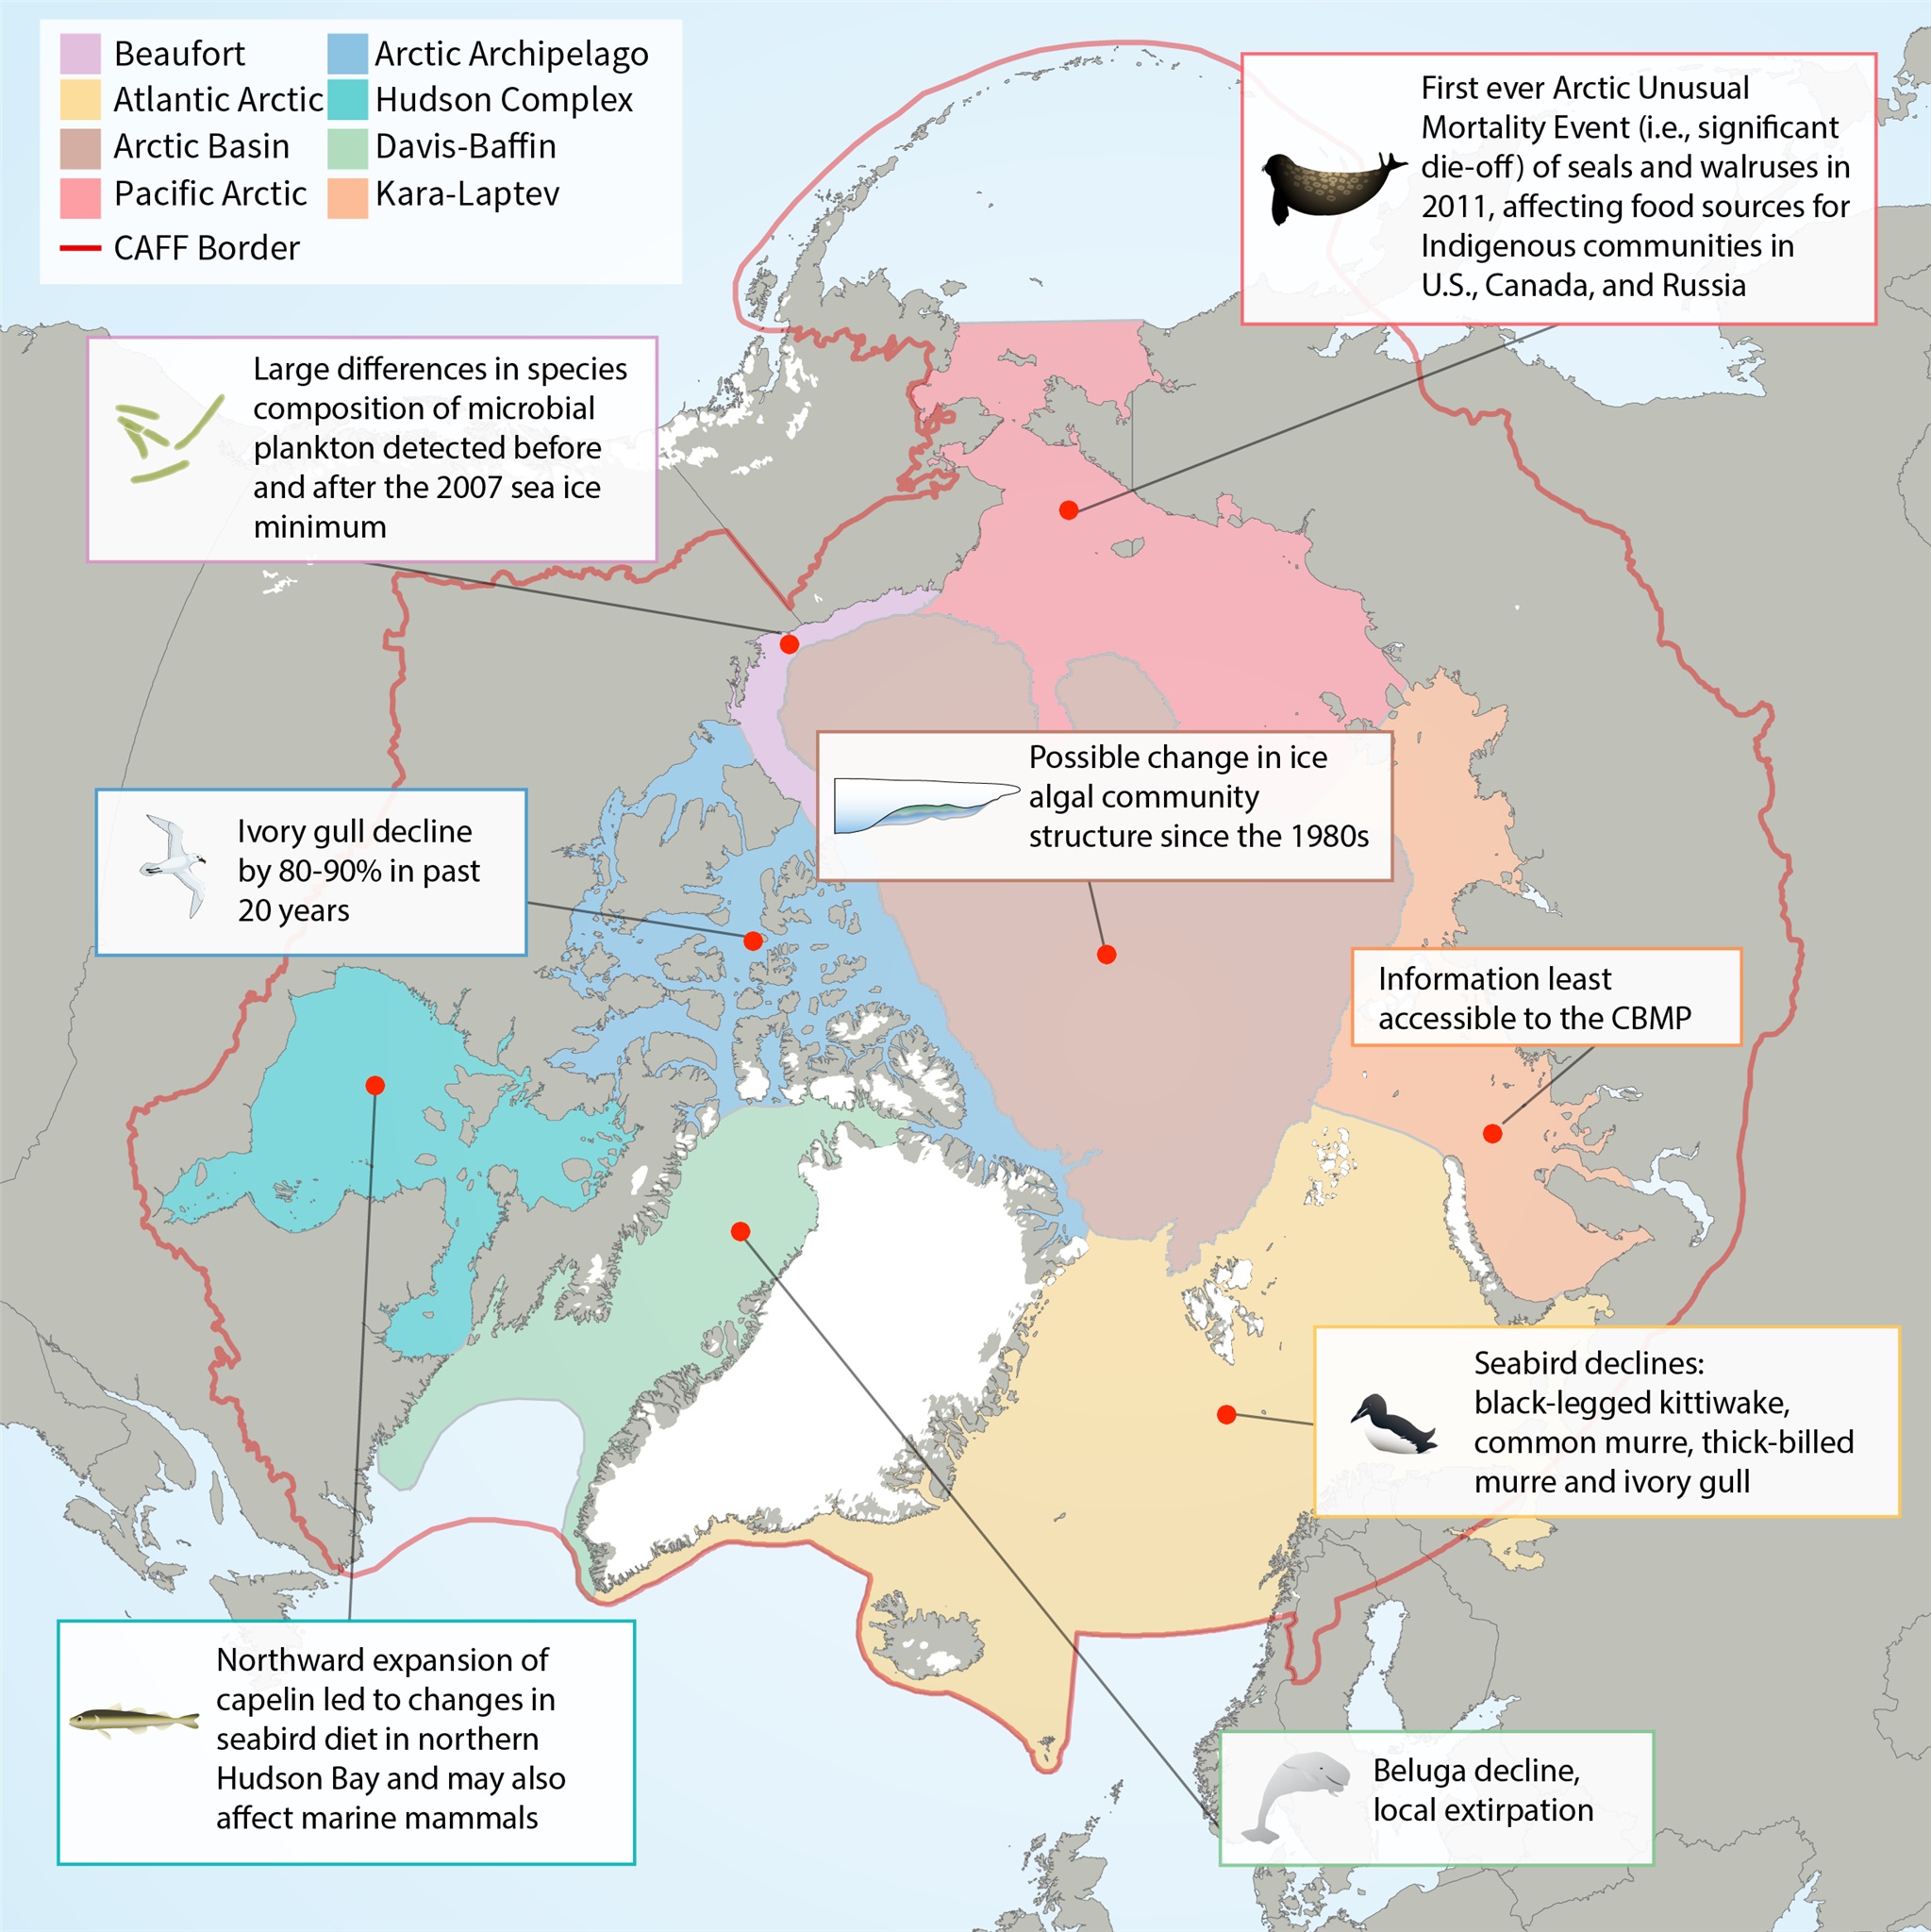
Map of Arctic Marine Areas as defined by the Circumpolar Biodiversity Monitoring Program (CBMP), with one sample finding from each area.
-
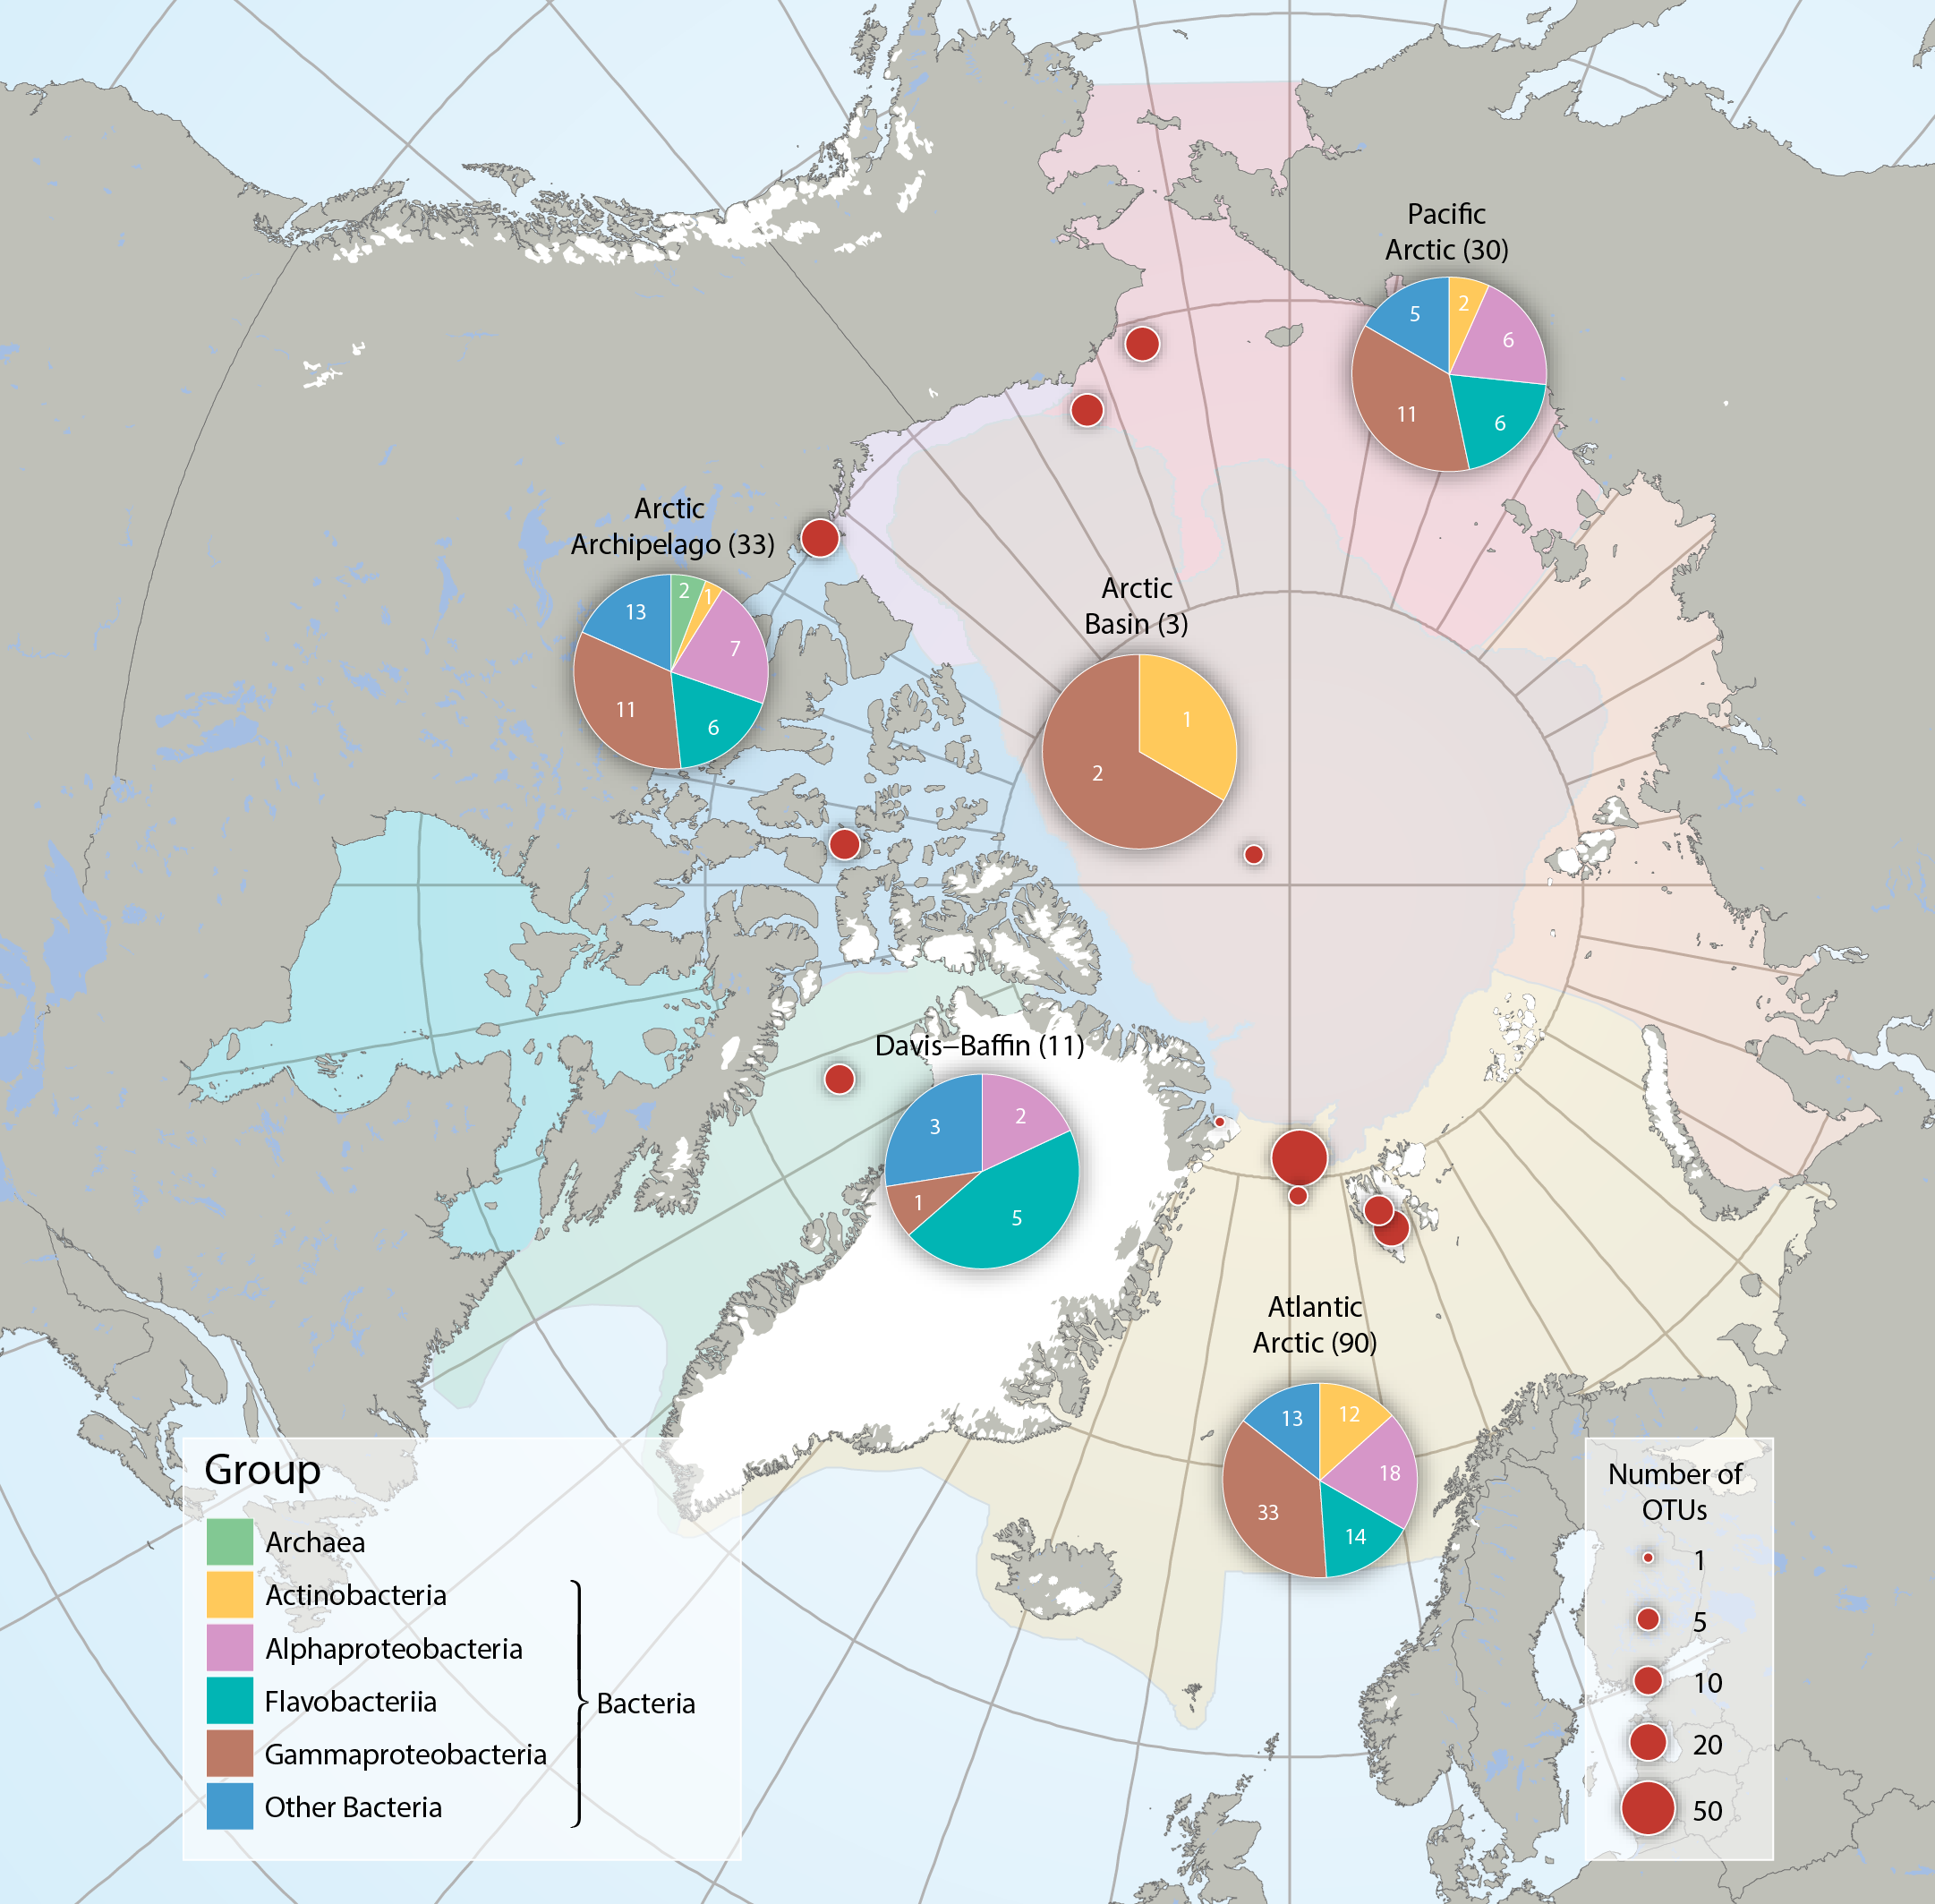
Bacteria and Archaea across five Arctic Marine Areas based on number of operational taxonomic units (OTUs), or molecular species. Composition of microbial groups, with respective numbers of OTUs (pie charts) and number of OTUs at sampling locations (red dots). Data aggregated by the CBMP Sea Ice Biota Expert Network. Data source: National Center for Biotechnology Information’s (NCBI 2017) Nucleotide and PubMed databases. STATE OF THE ARCTIC MARINE BIODIVERSITY REPORT - <a href="https://arcticbiodiversity.is/findings/sea-ice-biota" target="_blank">Chapter 3</a> - Page 38 - Figure 3.1.2 From the report draft: "Synthesis of available data was performed by using searches conducted in the National Center for Biotechnology Information’s “Nucleotide” (http://www.ncbi.nlm.nih.gov/guide/data-software/) and “PubMed” (http://www.ncbi.nlm.nih.gov/pubmed) databases. Aligned DNA sequences were downloaded and clustered into OTUs by maximum likelihood phylogenetic placement."
-
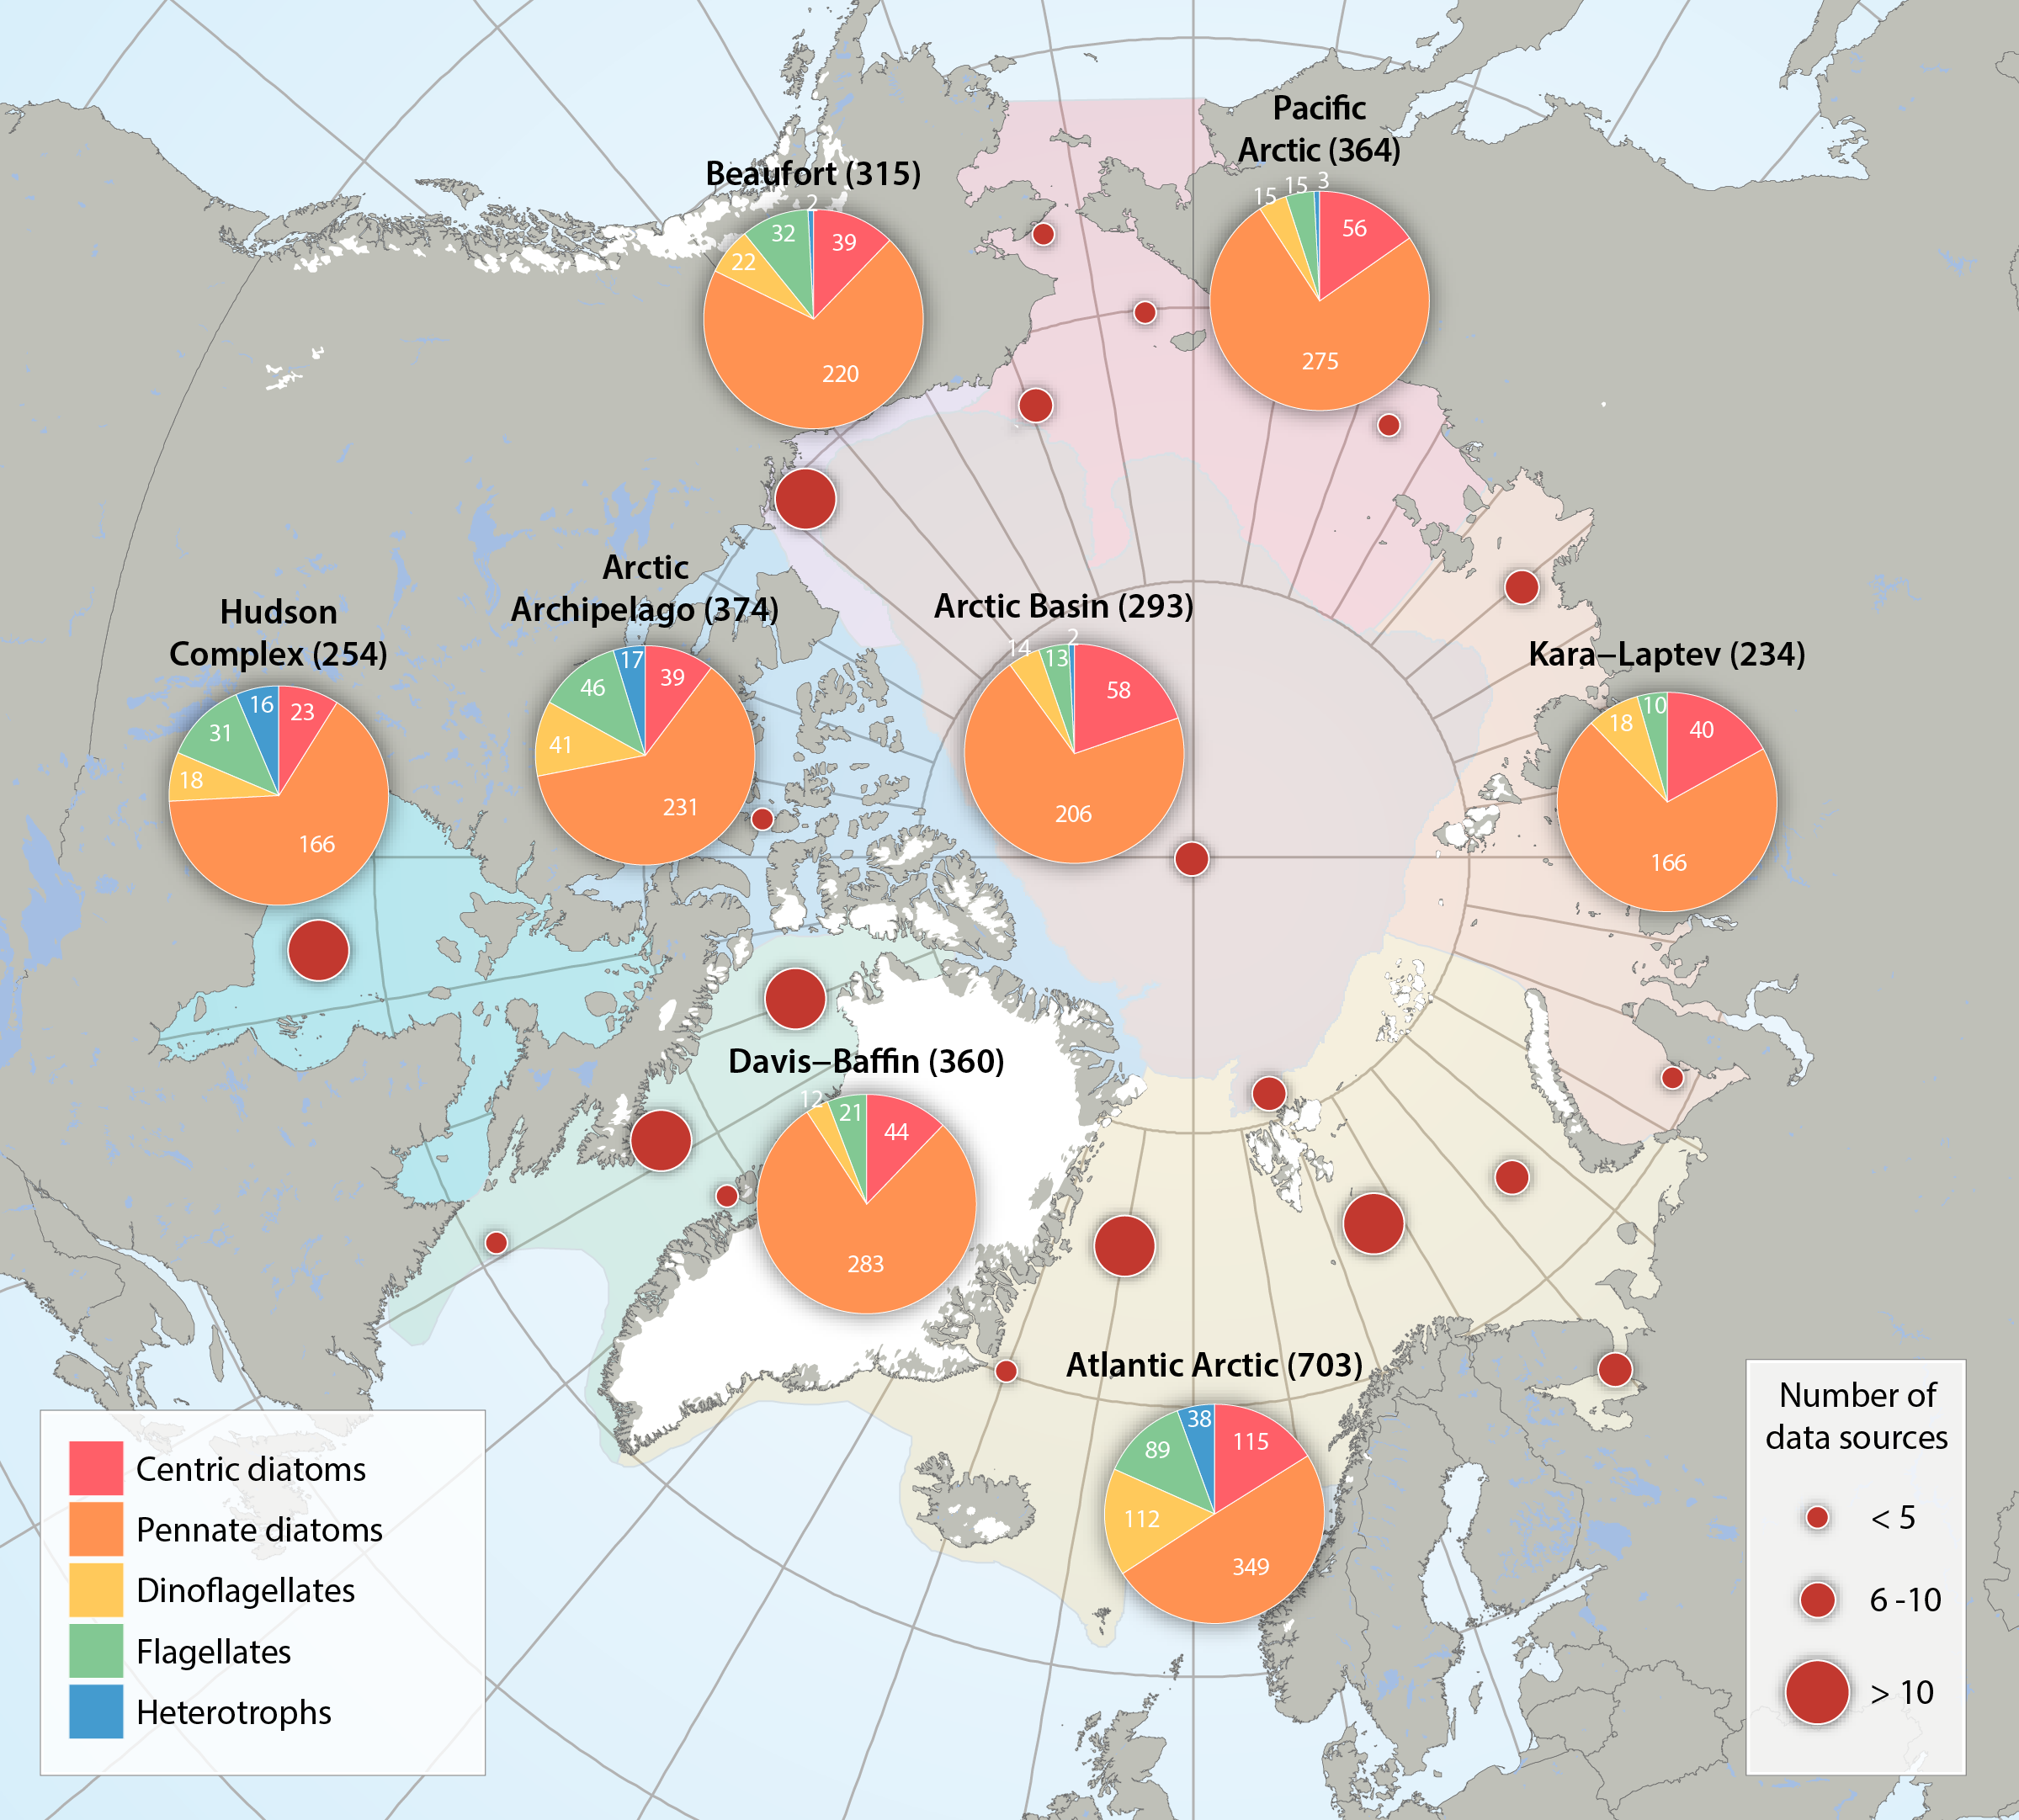
Numbers and taxonomic composition of five single-celled eukaryote groups for the regional divisions of the Arctic Marine Areas (pie charts), as well as the number of data sources reviewed across the Arctic (red circles). Total number of taxa is given in parenthesis after each region. Flagellates include: chlorophytes, chrysophytes, cryptophytes, dictyochophytes, euglenids, prasinophytes, prymnesiophytes, raphidophytes, synurales, and xanthophytes, and- for practical purposes though not flagellates - cyanophytes. Heterotrophs include: choanoflagellates, kinetoplastea, incertae sedis. Updated from Poulin et al. (2011). STATE OF THE ARCTIC MARINE BIODIVERSITY REPORT - <a href="https://arcticbiodiversity.is/findings/sea-ice-biota" target="_blank">Chapter 3</a> - Page 39- Figure 3.1.3 From the report draft: "For a pan-Arctic assessment of diversity (here defined as species richness), the first comprehensive assessments of this FEC from a few years ago (Poulin et al. 2011, Daniëls et al. 2013) have been updated for regions, with taxonomic names standardized according to the World Register of Marine Species (www.marinespecies.org). For the analysis of possible interannual trends in the ice algal community, we used a data set from the Central Arctic, the area most consistently and frequently sampled (Melnikov 2002, I. Melnikov, Shirshov Institute, unpubl. data). Multivariate community structure was analysed based on a presence-absence matrix of cores from 1980 to 2013. The analysis is biased by the varying numbers of analysed cores taken per year ranging widely from 1 to 24, ice thickness between 0.6 and 4.2 m, and including both first-year as well as multiyear sea ice. Locations included were in a bounding box within 74.9 to 90.0 °N and 179.9°W to 176.6°E and varied among years."
-
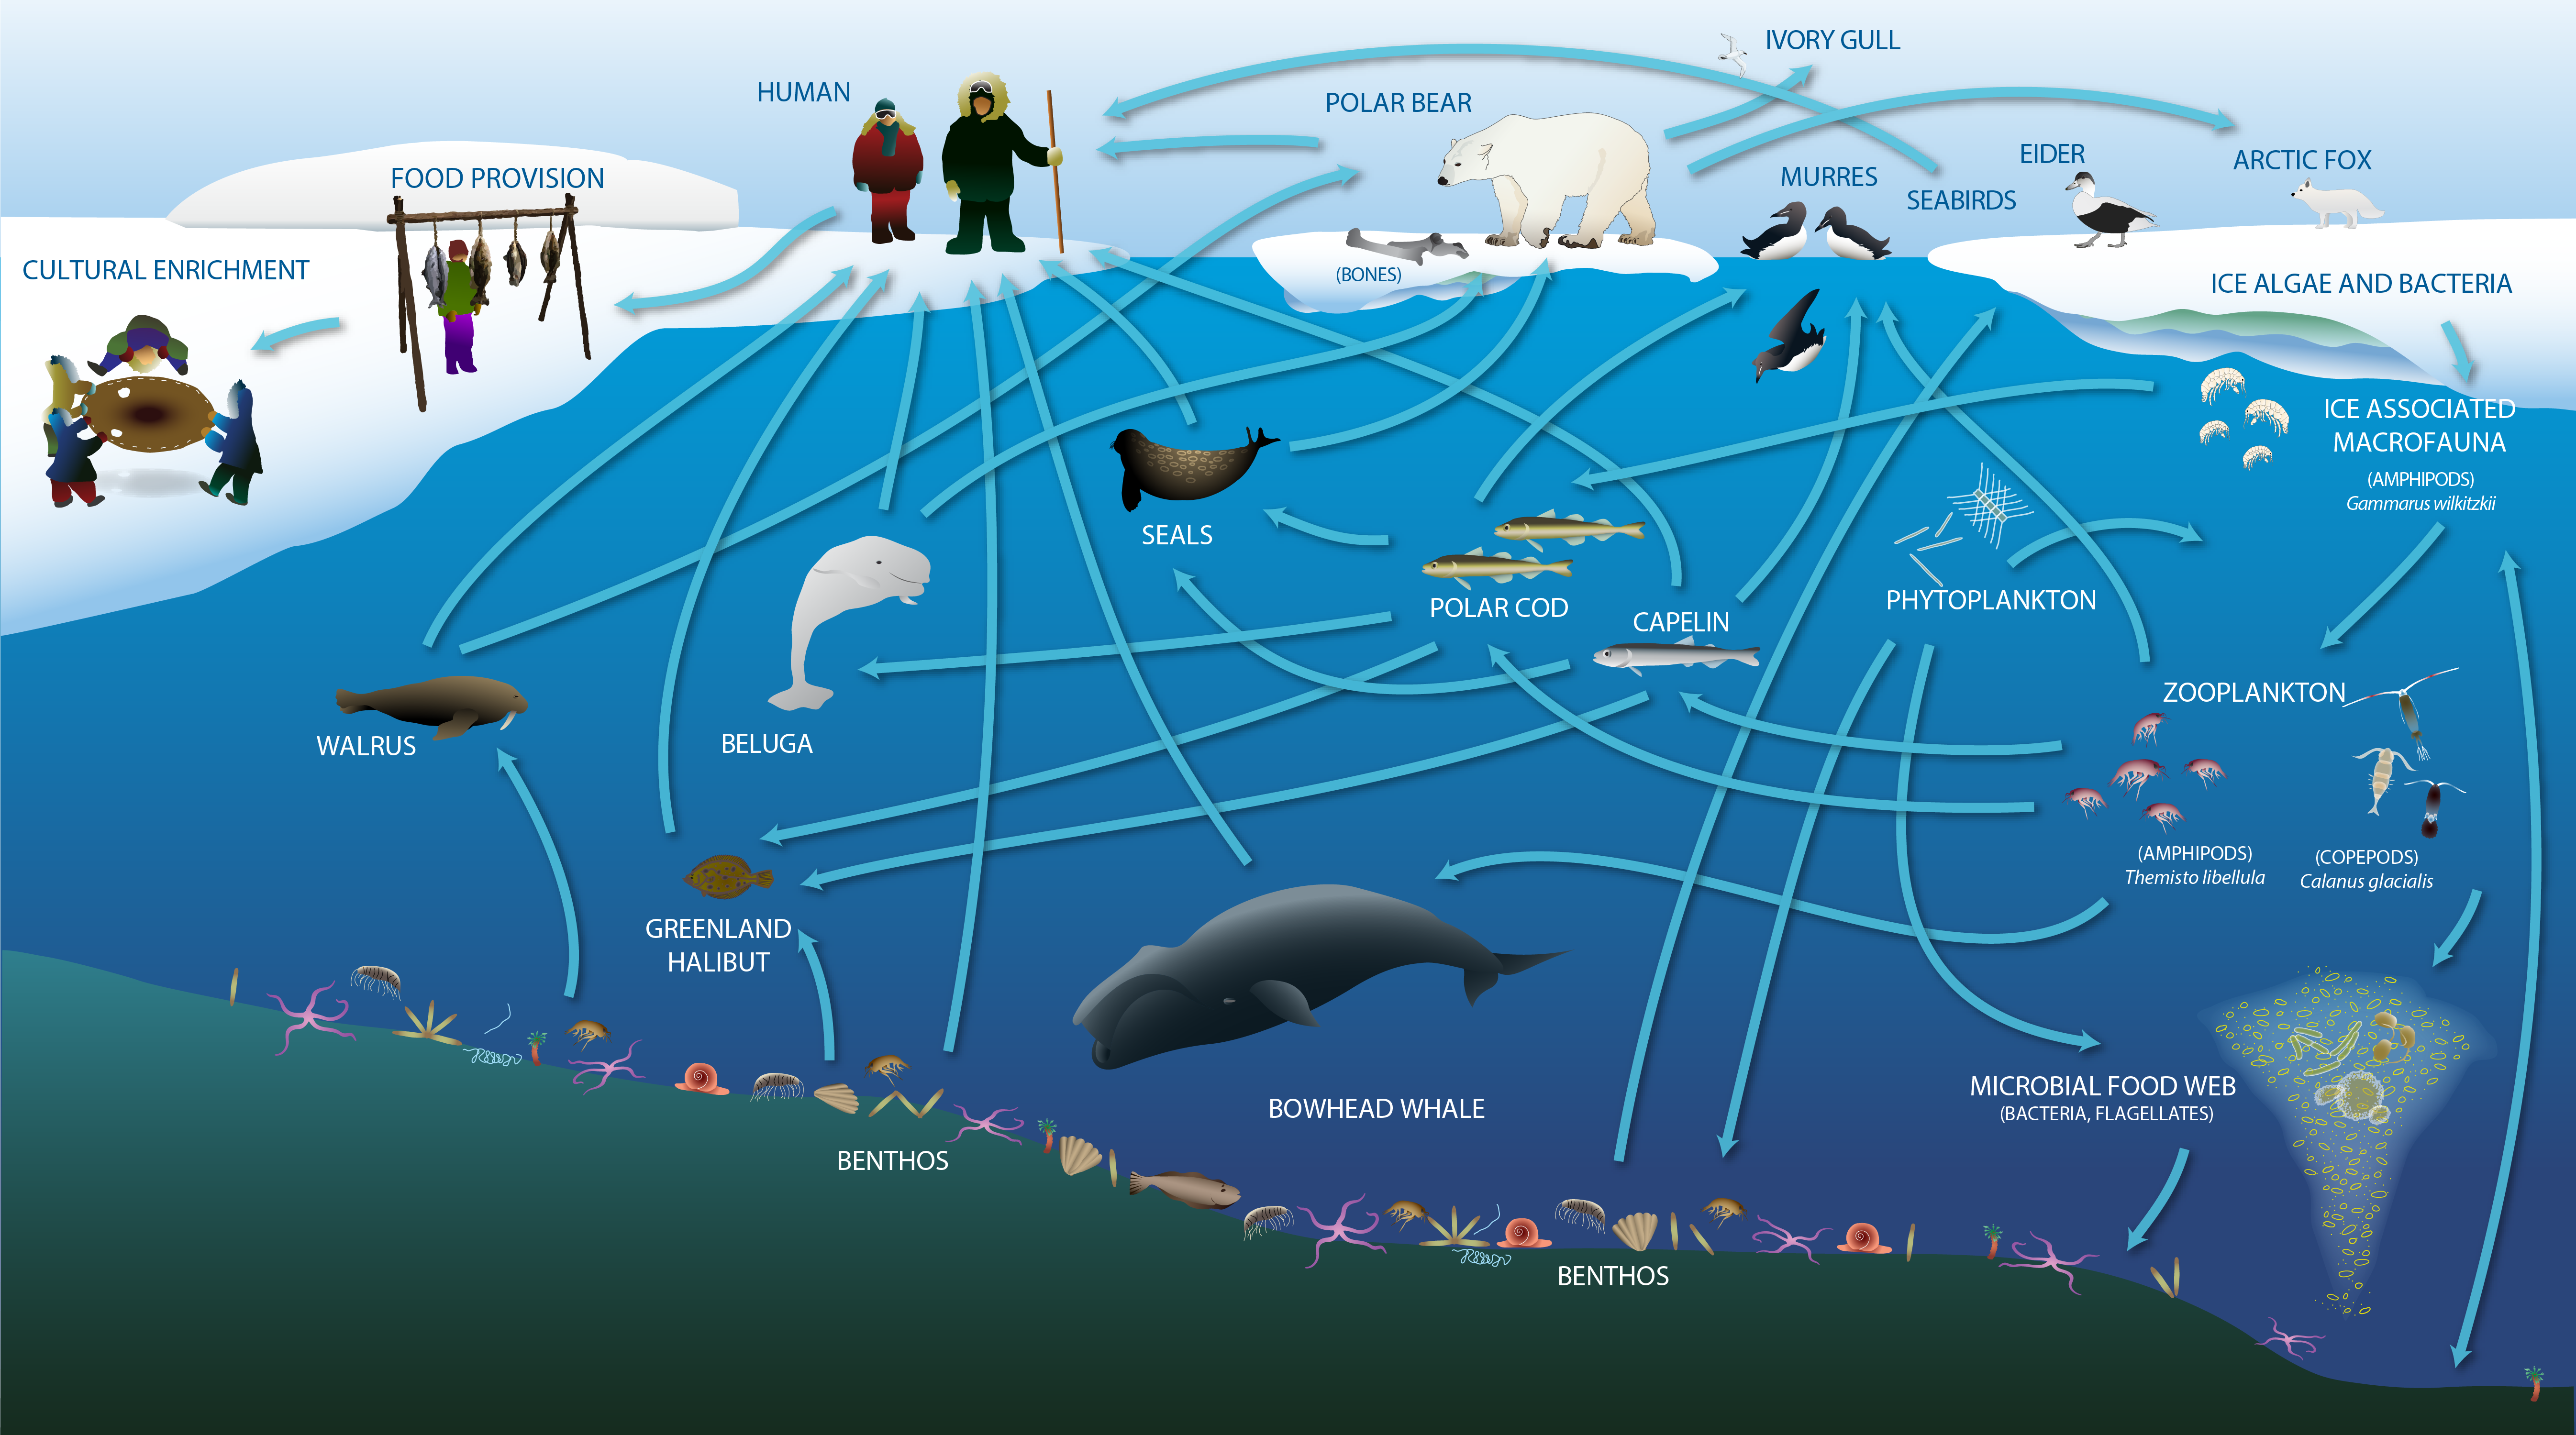
Changes expected or underway in the of energy flow in the High Arctic marine environment STATE OF THE ARCTIC MARINE BIODIVERSITY REPORT - <a href="https://arcticbiodiversity.is/marine" target="_blank">Chapter 2</a> - Page 23 - Figure 2.2b
-
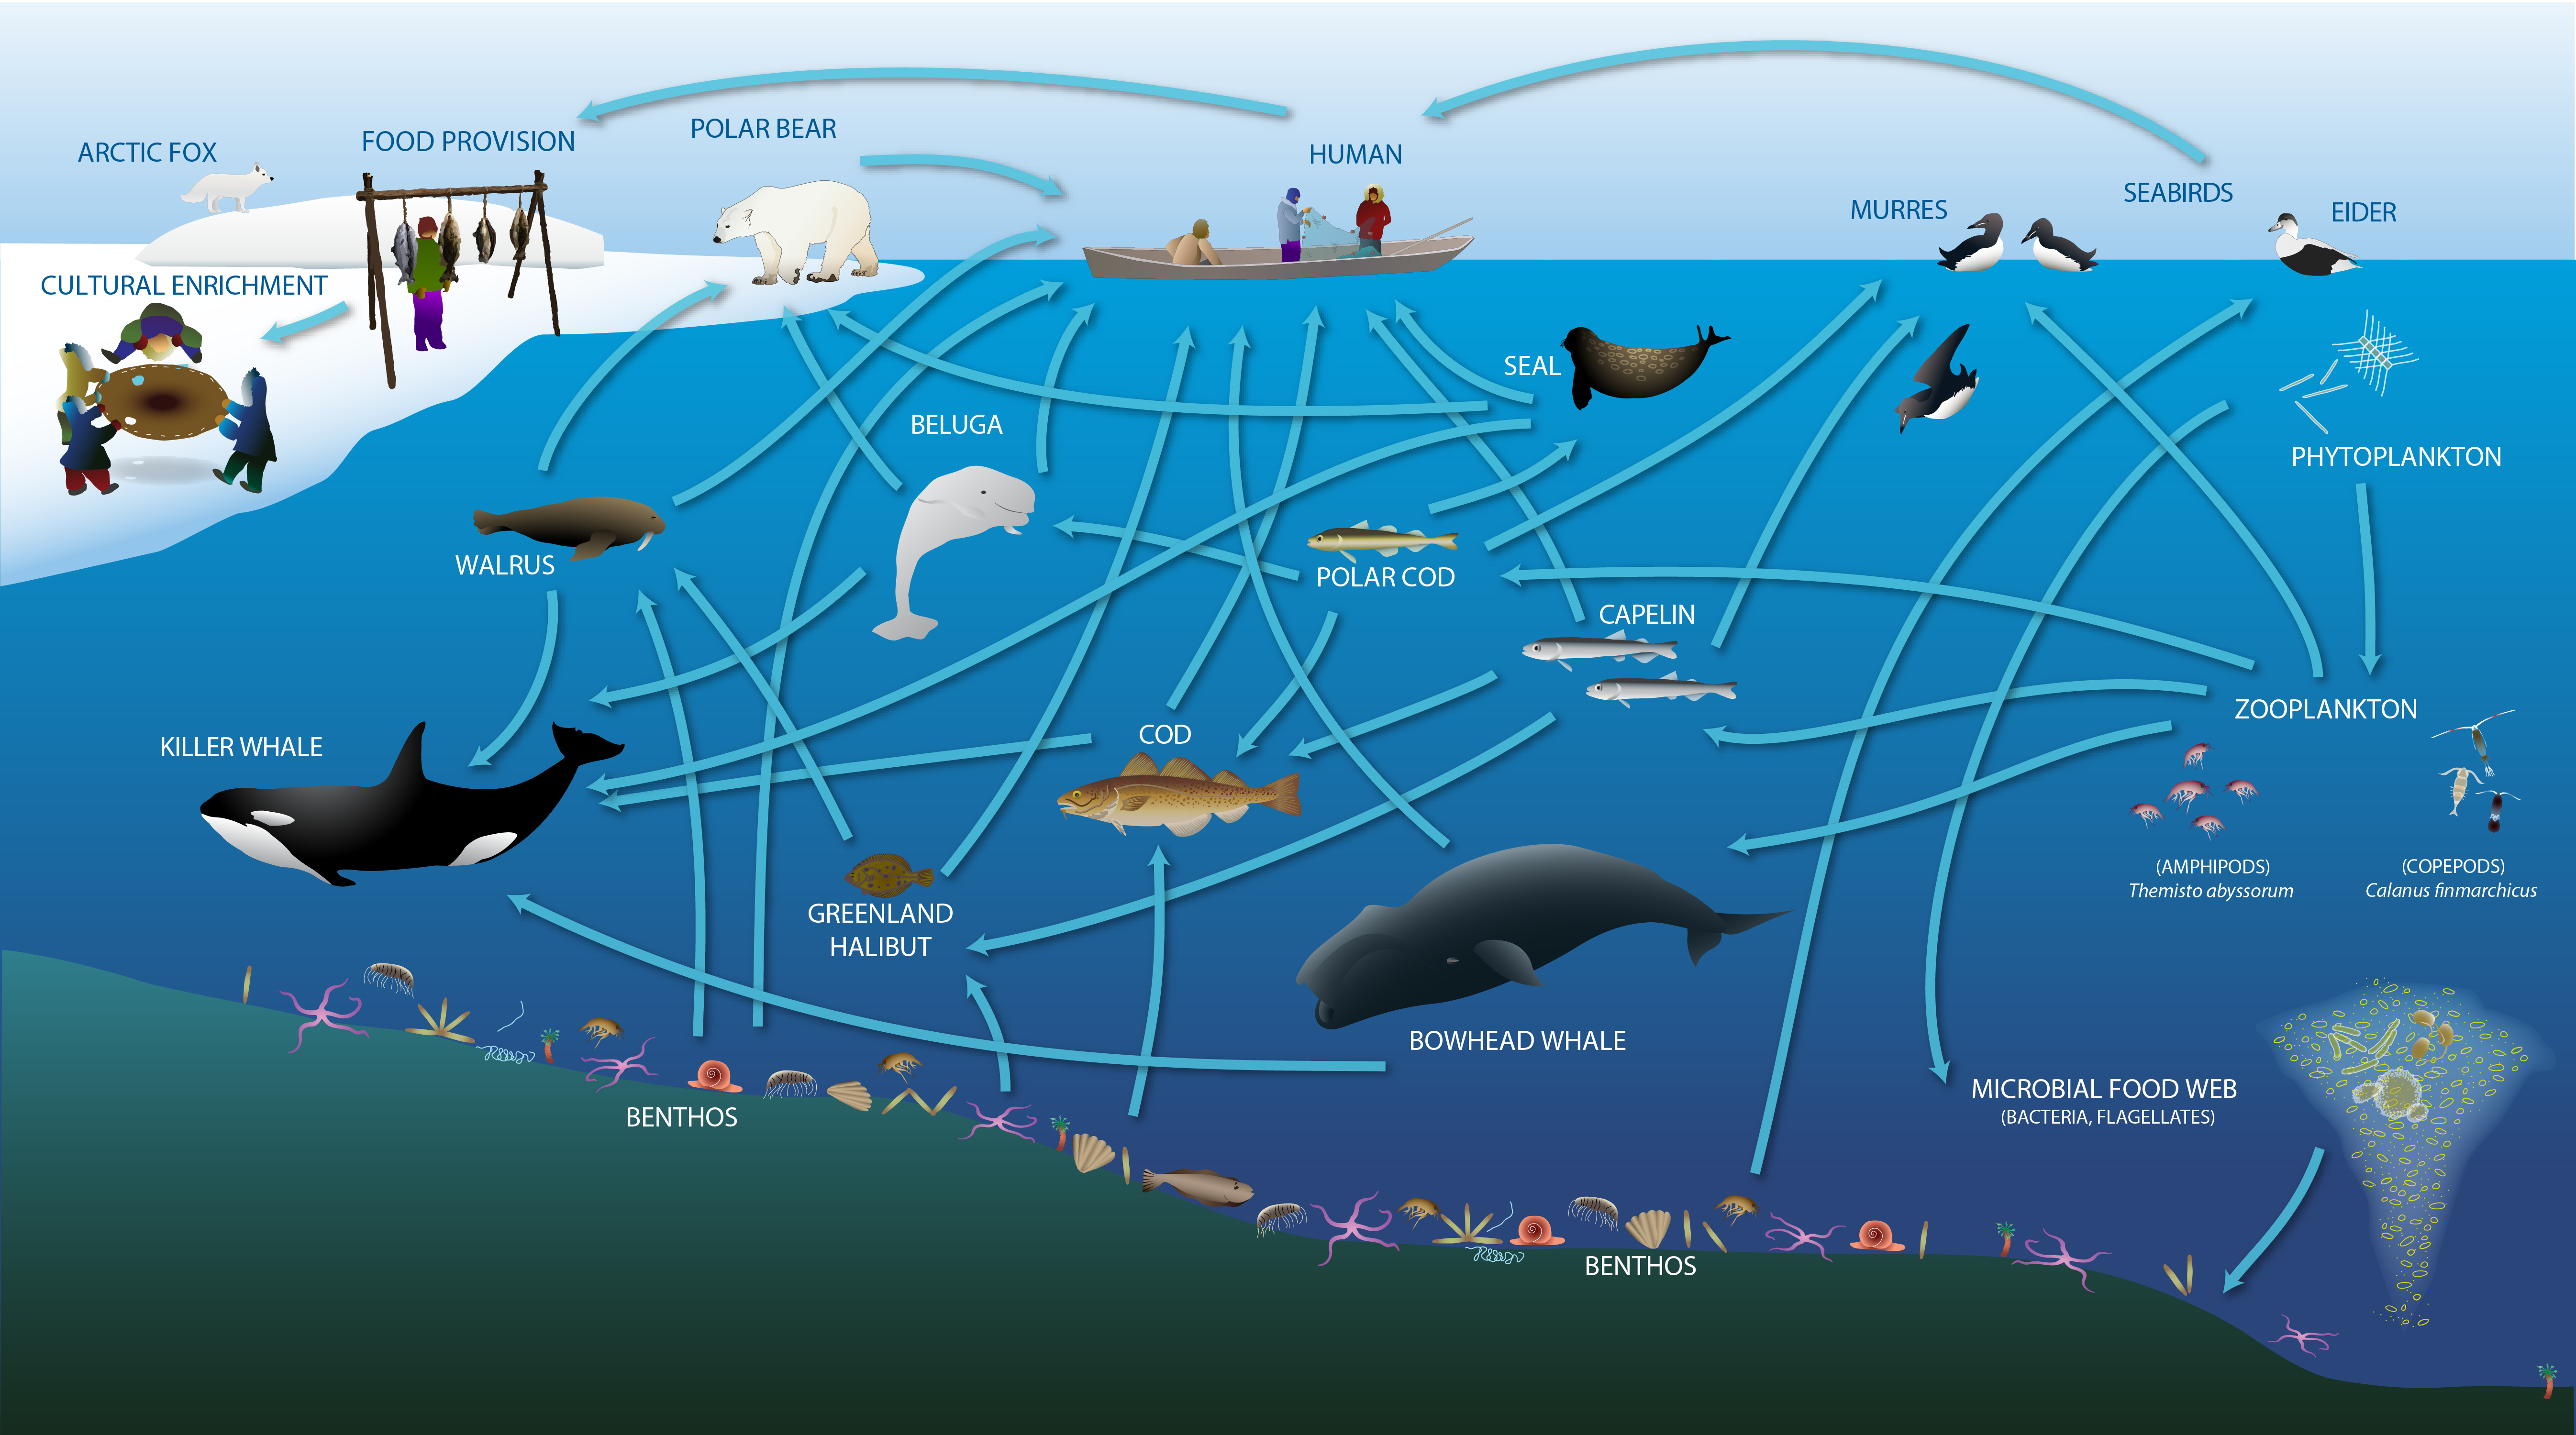
The Arctic marine food web includes the exchange of energy and nutrition, and also provides cultural, social and spiritual meaning for human communities. Adapted from Darnis et al. (2012) and Inuit Circumpolar Council-Alaska (2015). STATE OF THE ARCTIC MARINE BIODIVERSITY REPORT - <a href="https://arcticbiodiversity.is/marine" target="_blank">Chapter 2</a> - Page 23 - Figure 2.2a
-
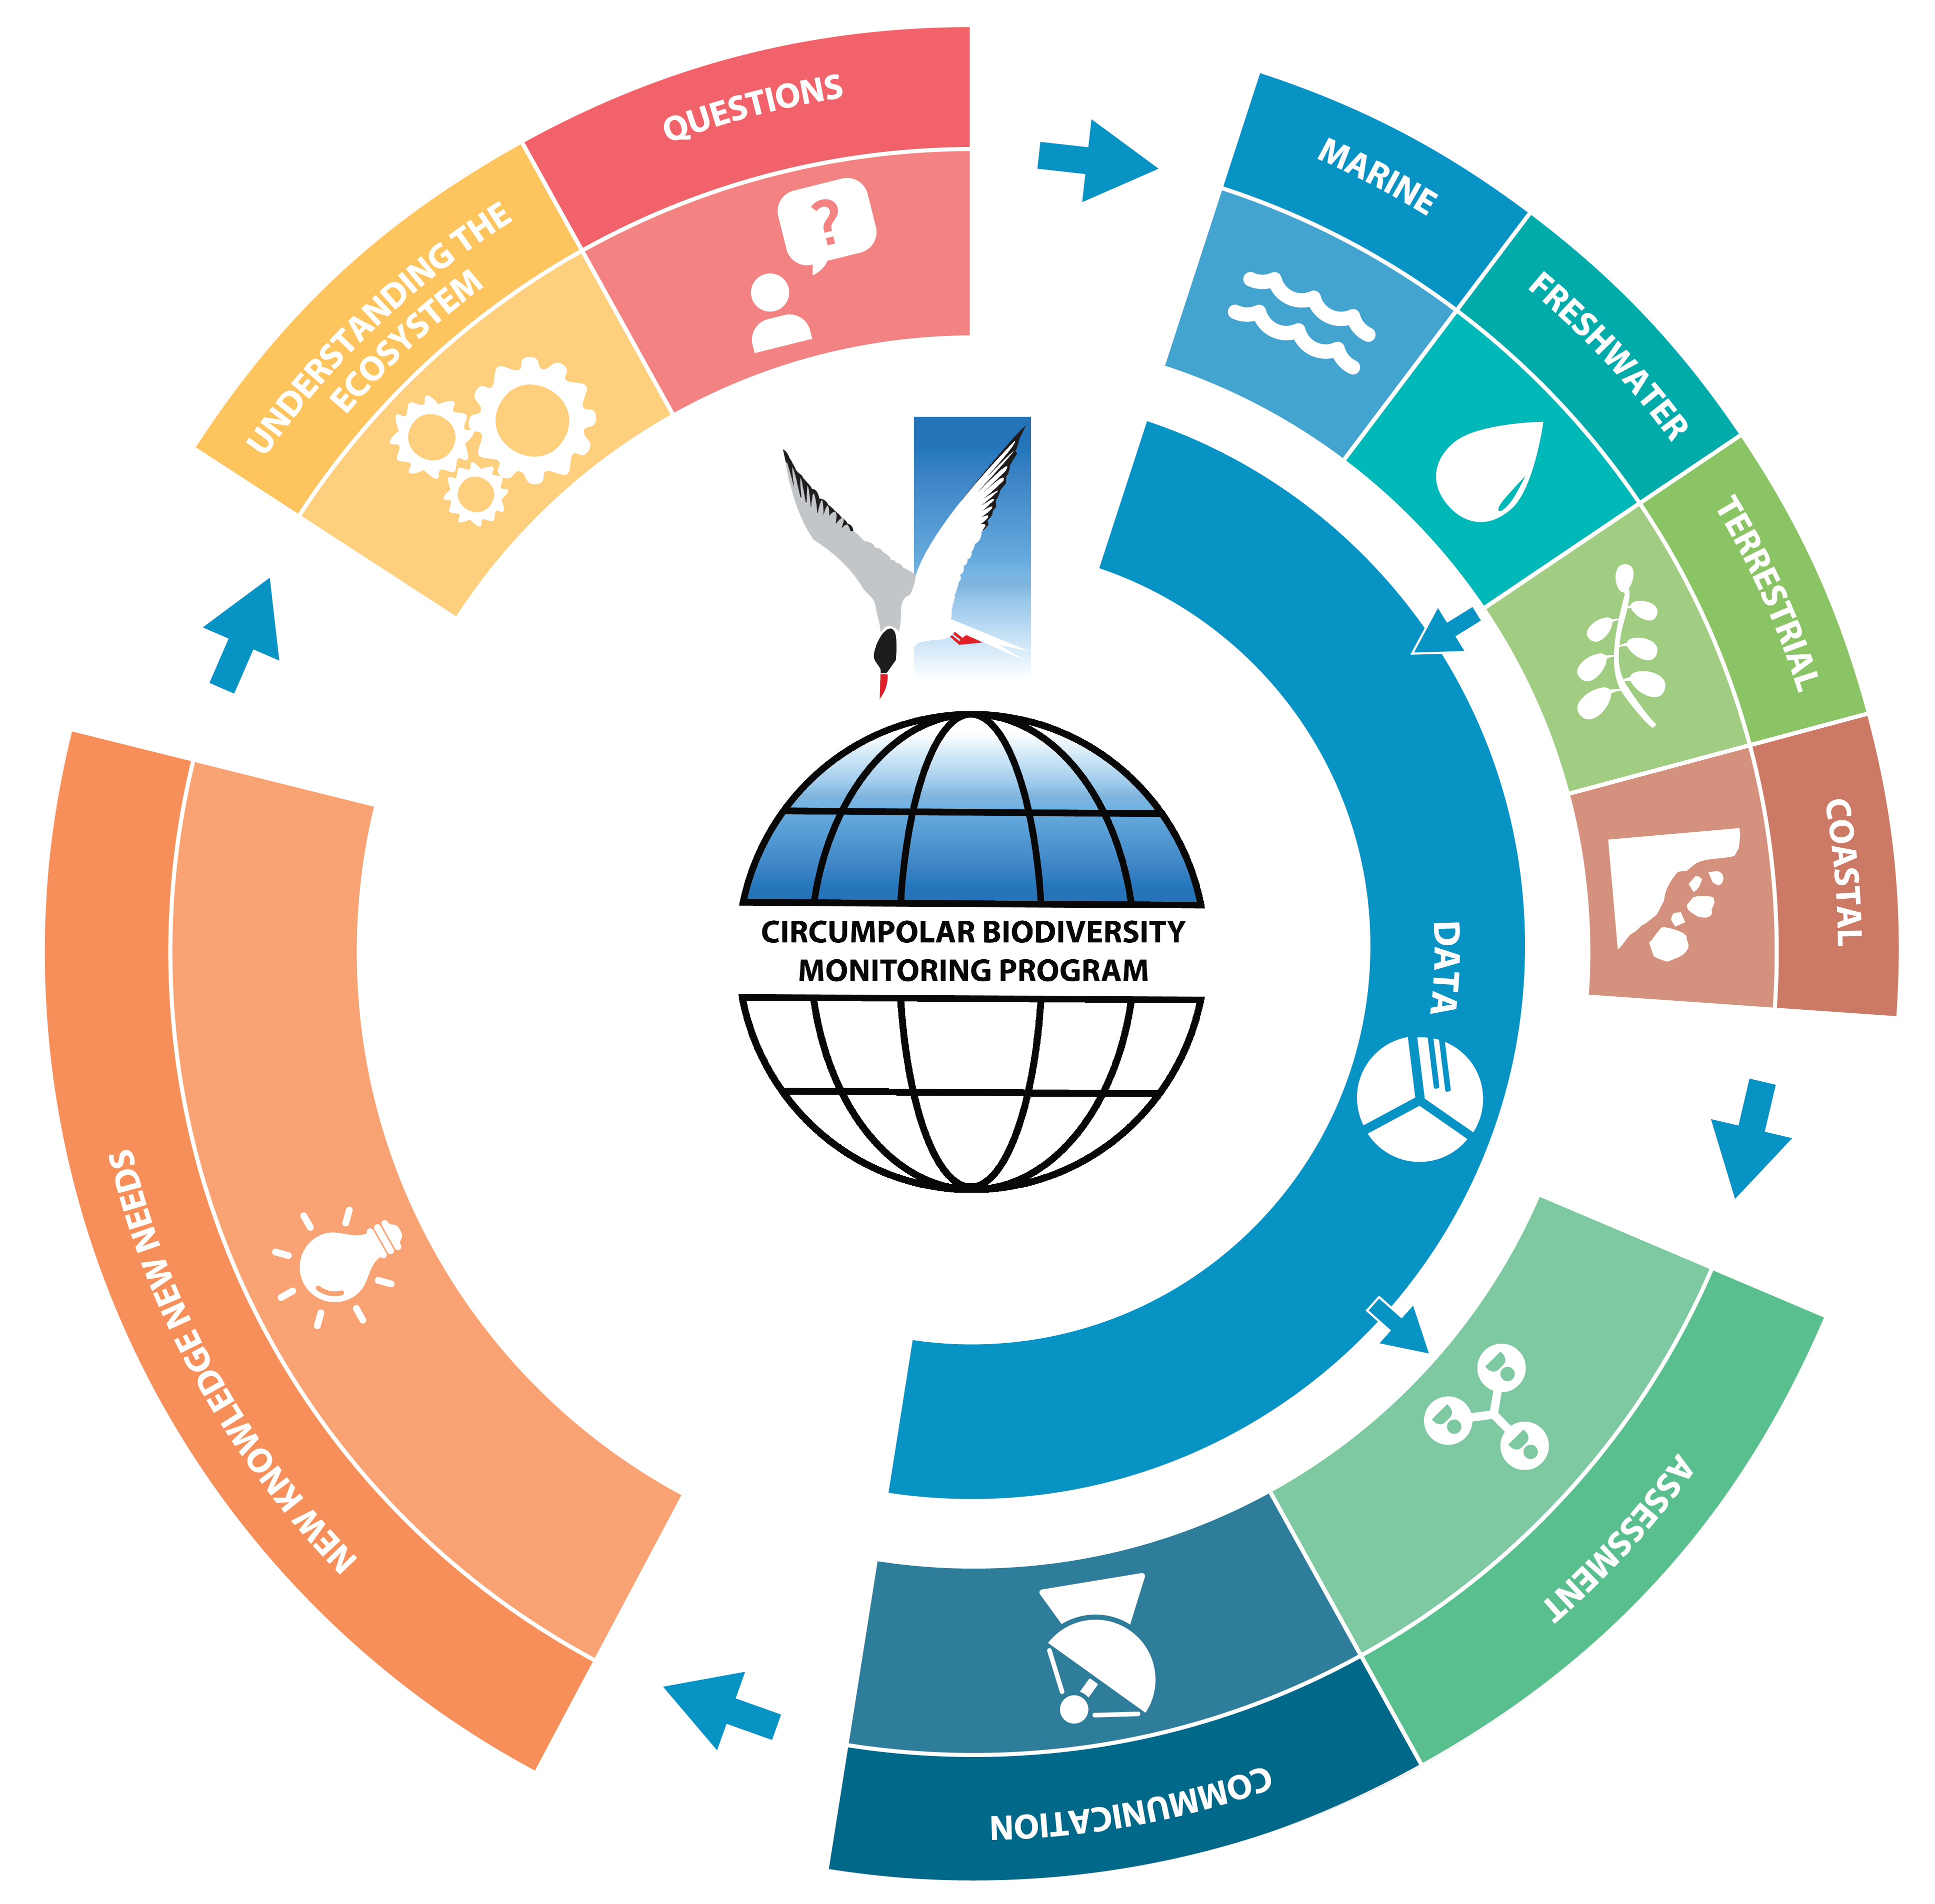
Workflow of the Circumpolar Biodiversity Monitoring Program (CBMP). STATE OF THE ARCTIC MARINE BIODIVERSITY REPORT - <a href="https://arcticbiodiversity.is/marine" target="_blank">Chapter 1</a> - Page 13 - Figure 1.1
-
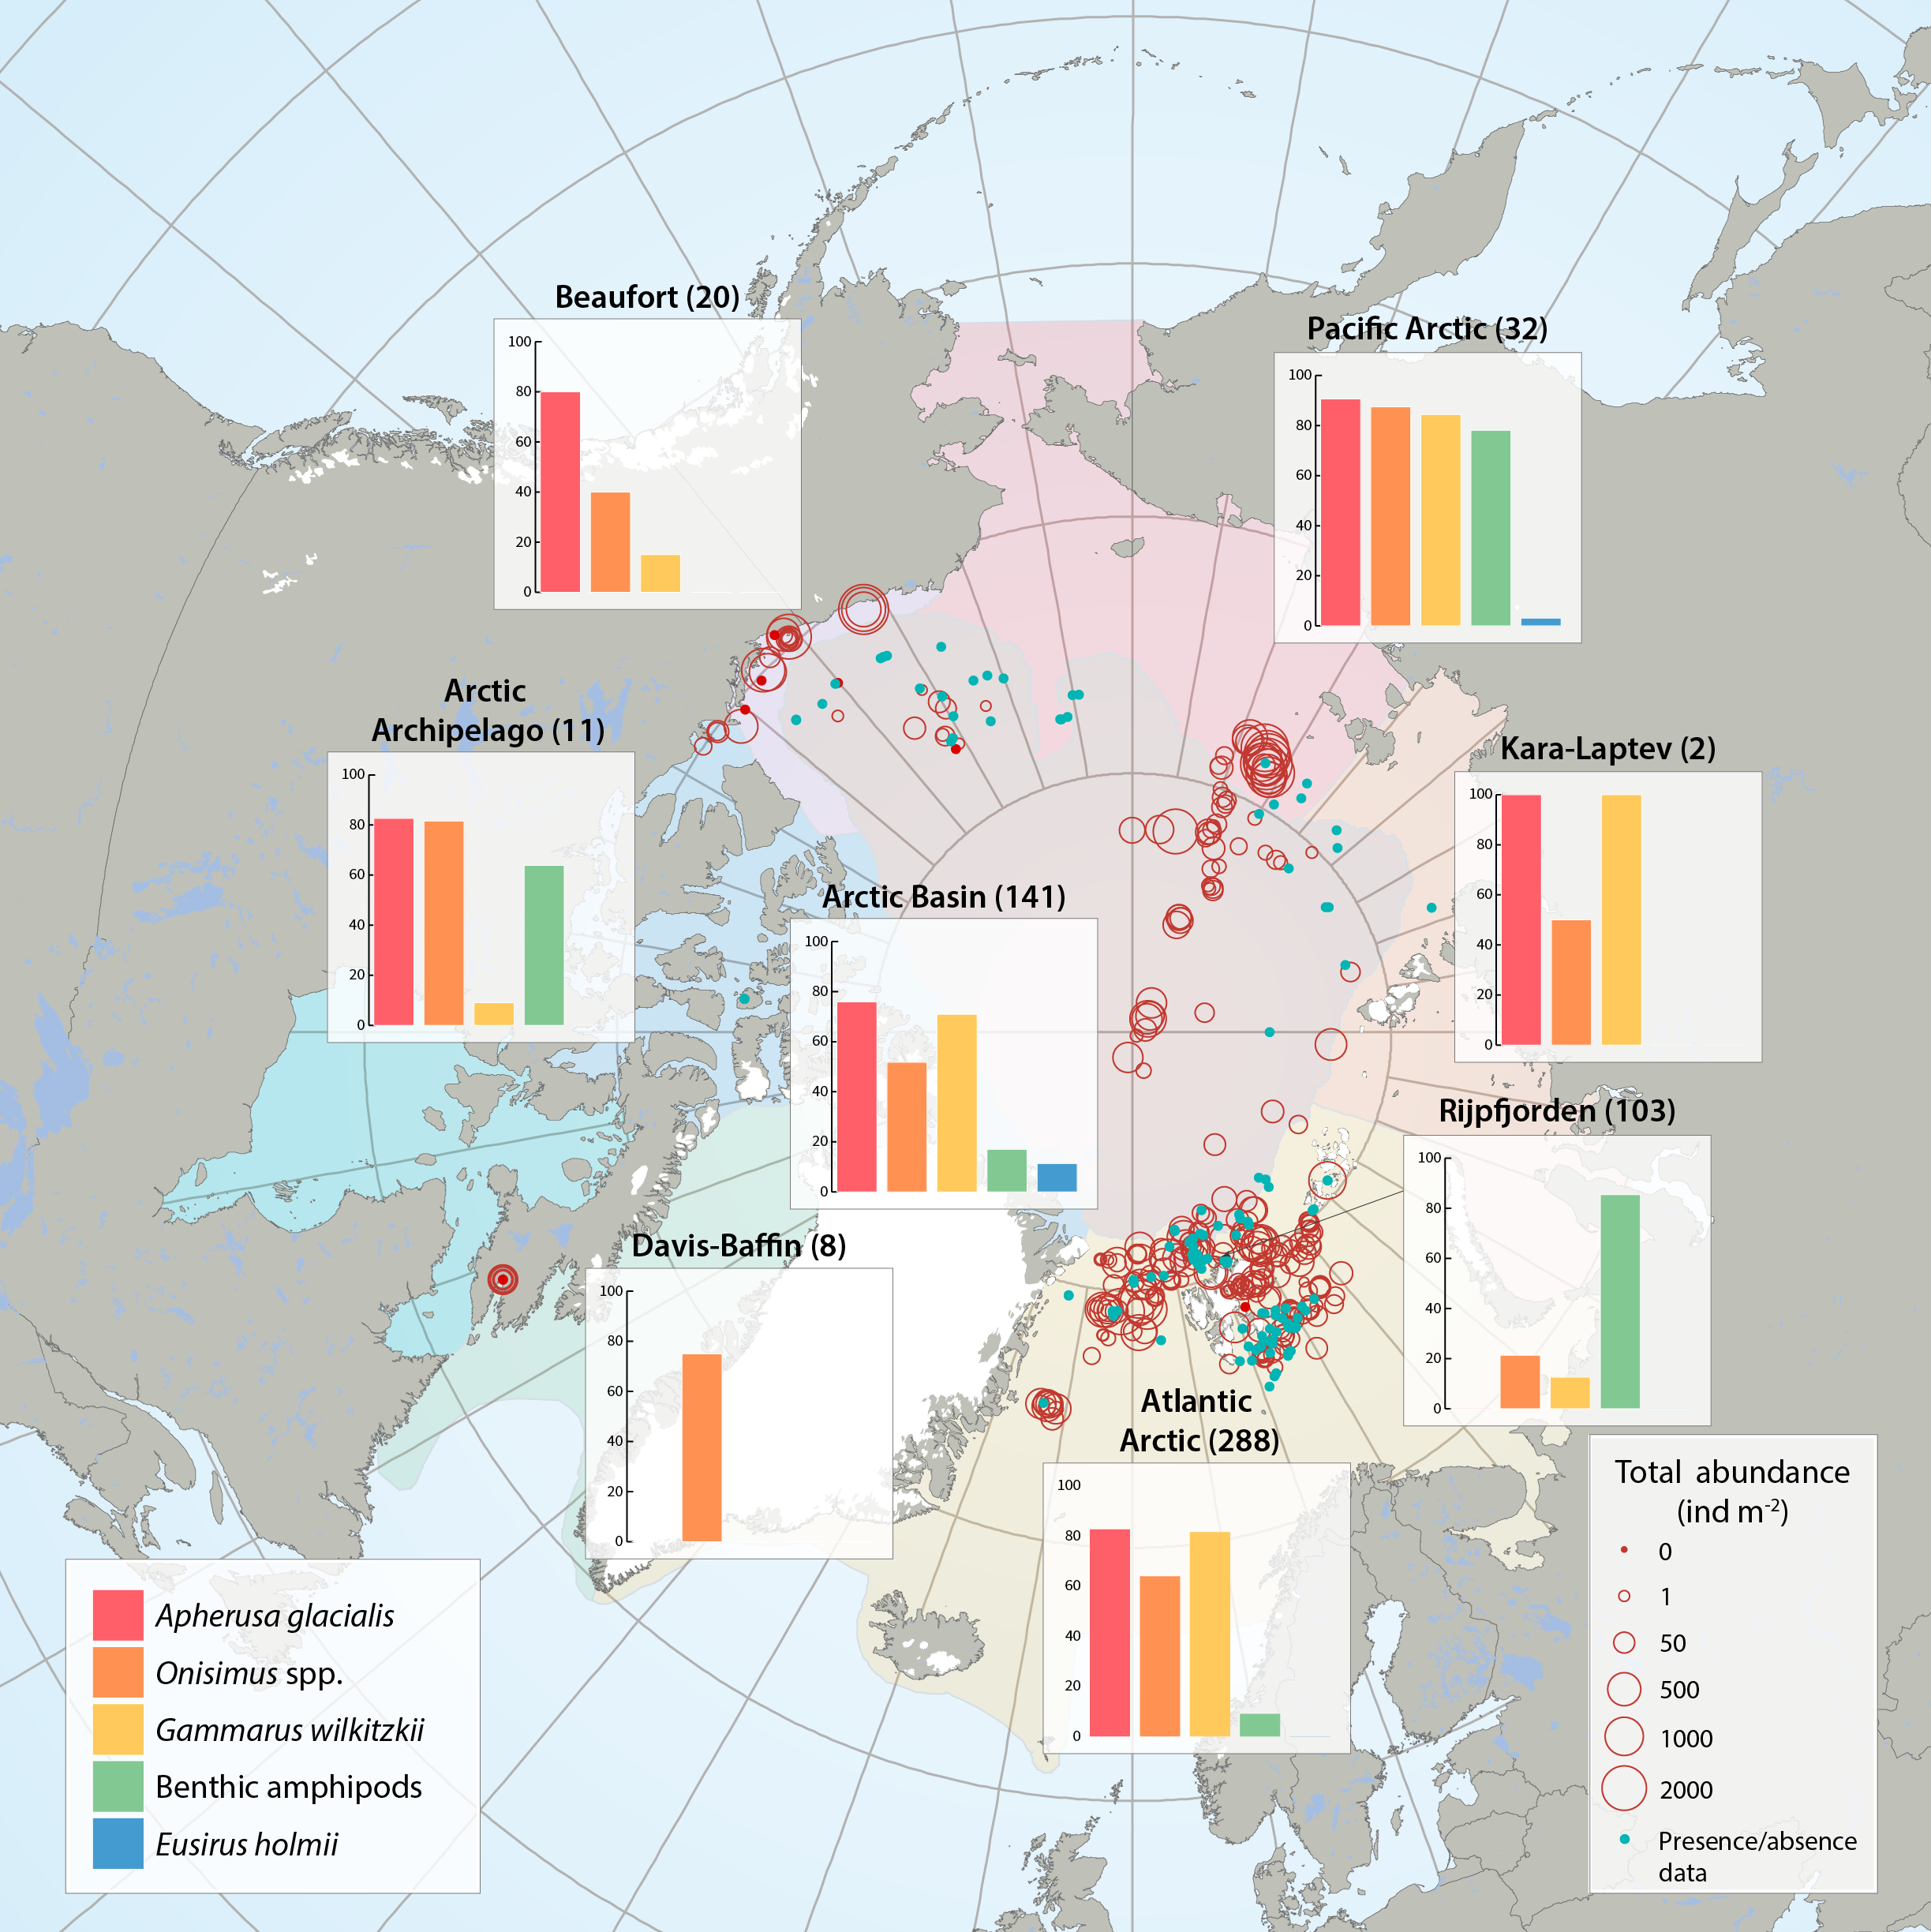
Sea ice amphipod (macrofauna) distribution and abundance across the Arctic aggregated from 47 sources between 1977 and 2012 by the CBMP Sea Ice Biota Expert Network. Bar graphs illustrate the frequency of occurrence (%) of amphipods in samples that contained at least one ice-associated amphipod. Red circles illustrate the total abundances of all ice-associated amphipods in quantitative samples (individuals m-2) at locations of sampling for each Arctic Marine Area (AMA). Number of sampling efforts for each region is given in parenthesis after region name. Blue dots represent samples where only presence/ absence data were available and where amphipods were present. STATE OF THE ARCTIC MARINE BIODIVERSITY REPORT - <a href="https://arcticbiodiversity.is/findings/sea-ice-biota" target="_blank">Chapter 3</a> - Page 44 - Figure 3.1.6 From the report draft: "This summary includes 47 data sources of under-ice amphipods published between 1977 and 2012. When available, we collected information on abundance or density (ind. m-2, or ind. m-3 that were converted to ind. m-2) and biomass (g m-2, wet weight). If abundance or biomass data were not available, we examined presence/relative abundance information. Frequency of occurrence was calculated for regions across the Arctic using integrated data for all available years."
-
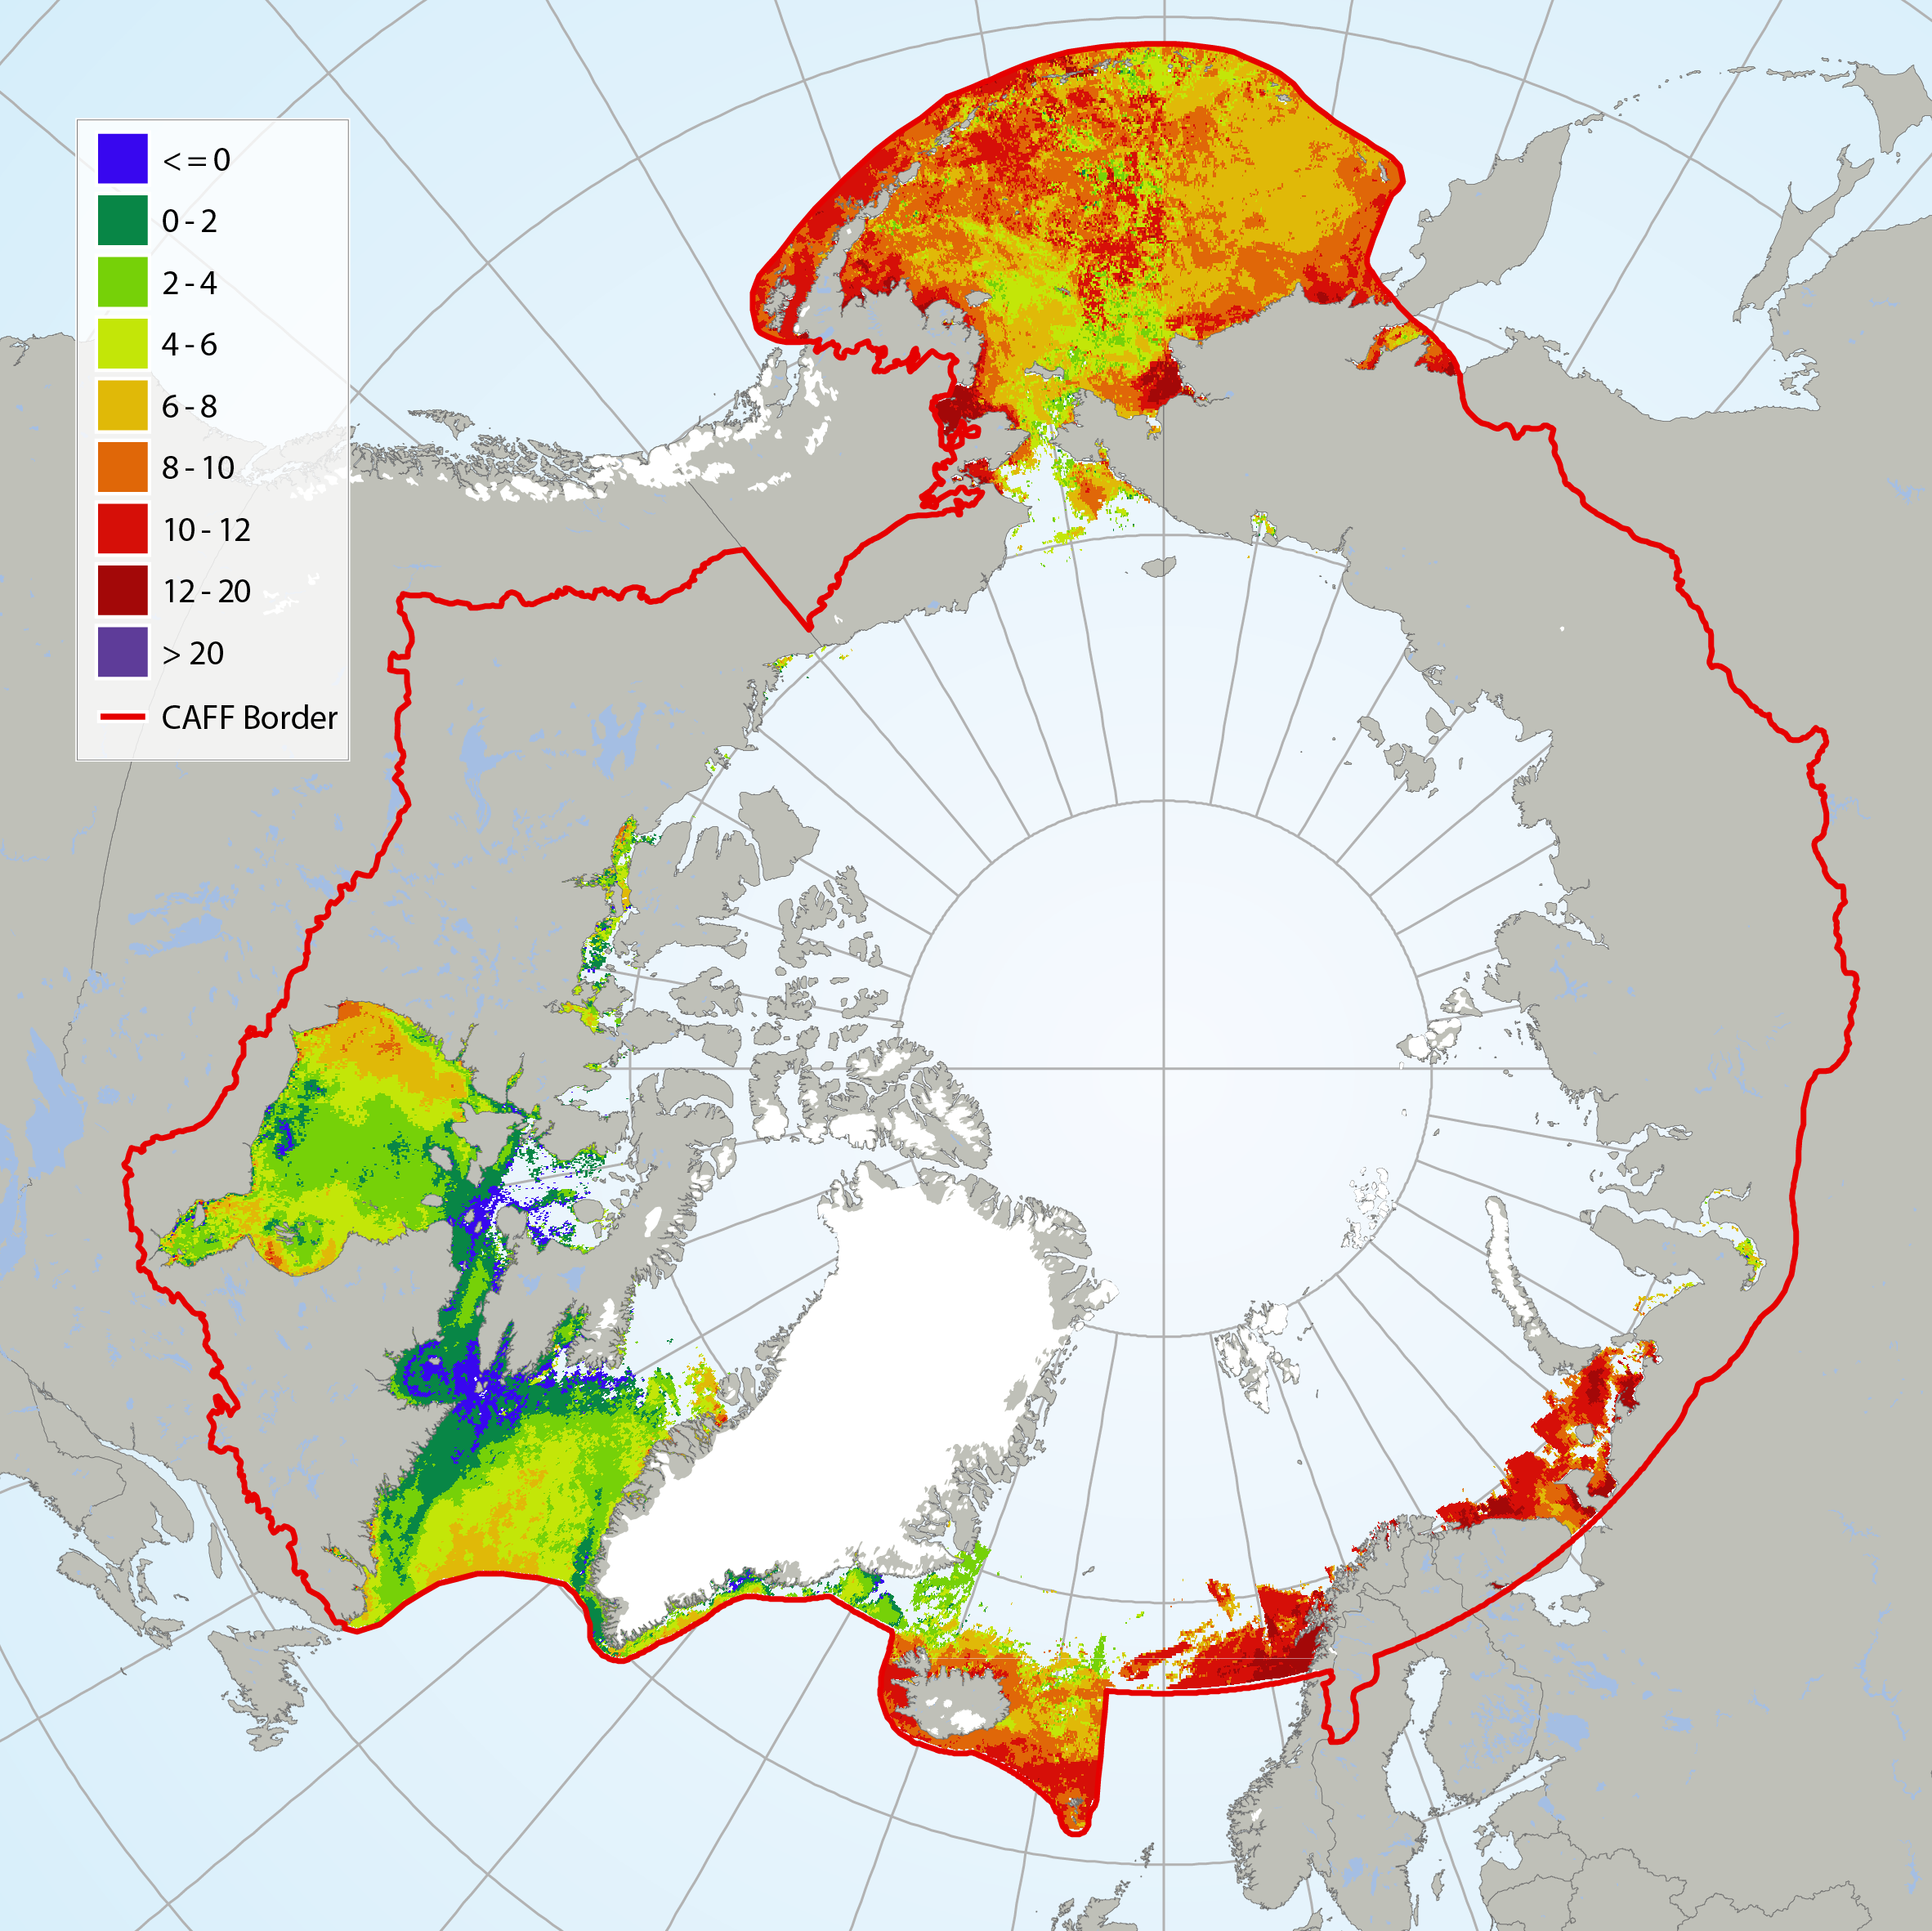
It has not been possible to identify available trend data for Arctic Ocean sea surface temperatures because there is not enough data to calculate reliable long-term trends for much of the Arctic marine environment (IPCC 2013, NOAA 2015). Here, sea surface temperature for July 2015 is shown from CAFF’s Land Cover Change Index. MODIS Sea Surface Temperature (SST) provided a four-kilometre spatial resolution monthly composite snapshot made from night-time measurements from the NASA Aqua Satellite. The night-time measurements are used to collect a consistent temperature measurement that is unaffected by the warming of the top layer of water by the sun. STATE OF THE ARCTIC MARINE BIODIVERSITY REPORT - <a href="https://arcticbiodiversity.is/marine" target="_blank">Chapter 2</a> - Page 25 - Figure 2.3
-
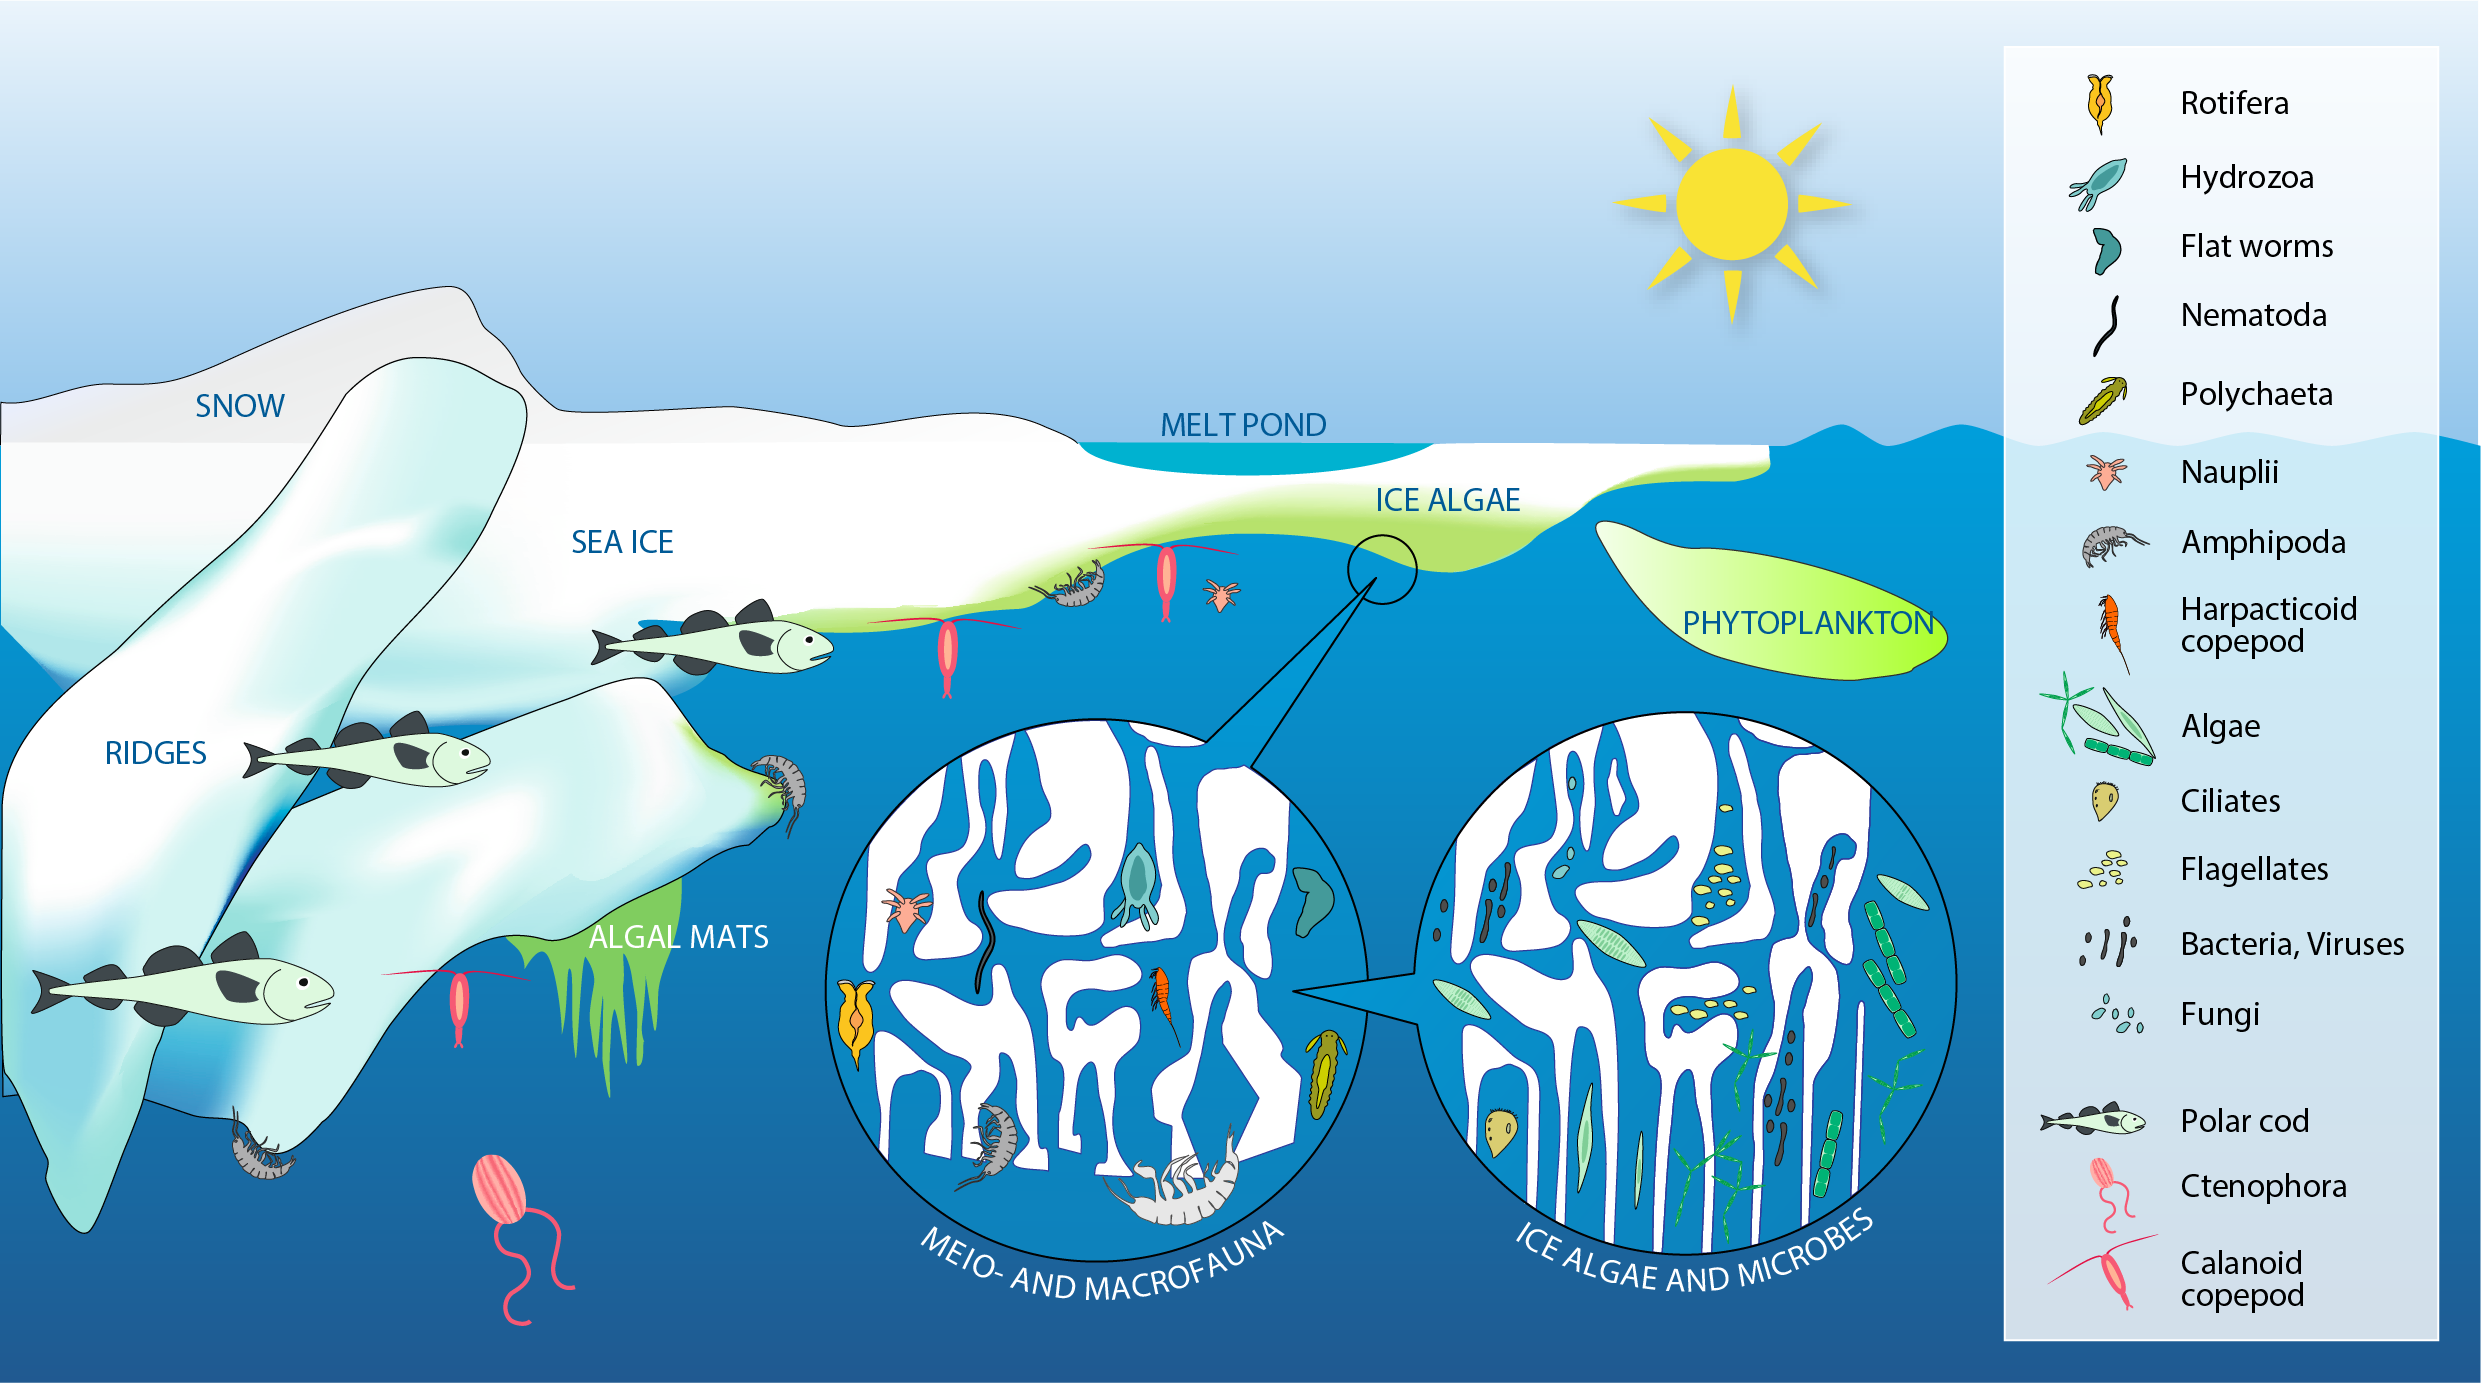
Sea ice provides a wide range of microhabitats for diverse biota including microbes, single-celled eukaryotes (labelled algae), multicellular meiofauna, larger under-ice fauna (represented by amphipods), as well as polar cod (Boreogadus saida). Modified from Bluhm et al. (2017). STATE OF THE ARCTIC MARINE BIODIVERSITY REPORT - <a href="https://arcticbiodiversity.is/findings/sea-ice-biota" target="_blank">Chapter 3</a> - Page 35 - Figure 3.1.1