 CAFF - Arctic Biodiversity Data Service (ABDS)
oceans
Type of resources
Available actions
Topics
Keywords
Contact for the resource
Provided by
Years
Formats
Representation types
Update frequencies
status
Scale
-

Interannual differences in taxonomic composition of phytoplankton during summer in a) Kongsfjorden and b) Rijpfjorden (Source: MOSJ, Norwegian Polar Institute). STATE OF THE ARCTIC MARINE BIODIVERSITY REPORT - <a href="https://arcticbiodiversity.is/findings/plankton" target="_blank">Chapter 3</a> - Page 74 - Figure 3.2.5
-
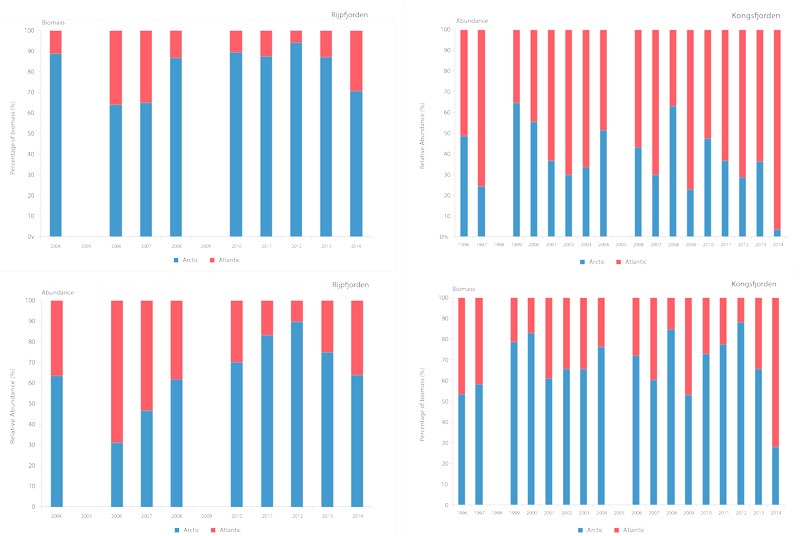
Time series of relative proportions of Arctic and Atlantic Calanus species in Kongsfjorden (top) and Rijpfjorden (bottom) (Source: MOSJ, Norwegian Polar Institute). STATE OF THE ARCTIC MARINE BIODIVERSITY REPORT - <a href="https://arcticbiodiversity.is/findings/plankton" target="_blank">Chapter 3</a> - Page 77 - Figure 3.2.8
-
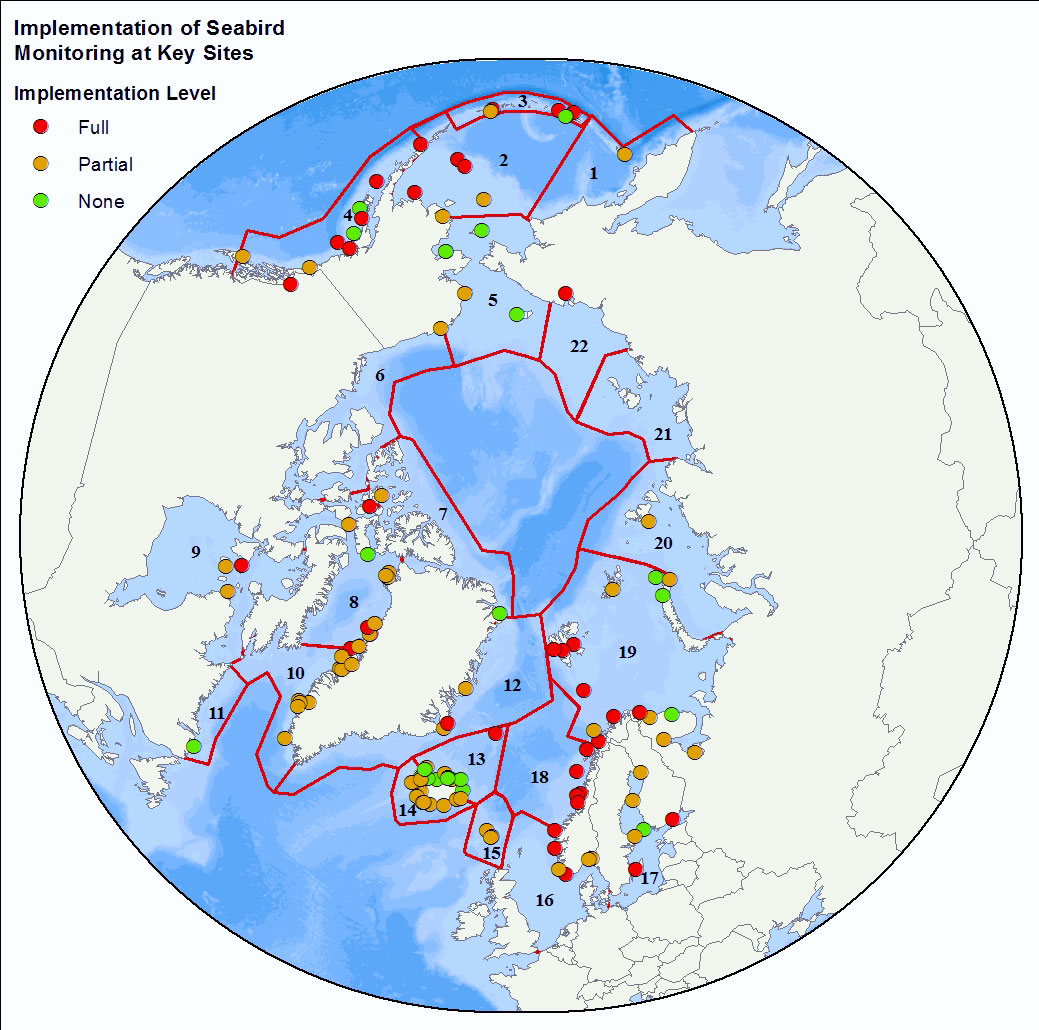
<img width="80px" height="67px" alt="logo" align="left" hspace="10px" src="http://geo.abds.is/geonetwork/srv/eng//resources.get?uuid=7d8986b1-fbd1-4e1a-a7c8-a4cef13e8eca&fname=cbird.png">The Circumpolar Seabird Monitoring Plan is designed to 1) monitor populations of selected Arctic seabird species, in one or more Arctic countries; 2) monitor, as appropriate, survival, diets, breeding phenology, and productivity of seabirds in a manner that allows changes to be detected; 3) provide circumpolar information on the status of seabirds to the management agencies of Arctic countries, in order to broaden their knowledge beyond the boundaries of their country thereby allowing management decisions to be made based on the best available information; 4) inform the public through outreach mechanisms as appropriate; 5) provide information on changes in the marine ecosystem by using seabirds as indicators; and 6) quickly identify areas or issue in the Arctic ecosystem such as declining biodiversity or environmental pressures to target further research and plan management and conservation measures. - <a href="http://caff.is" target="_blank"> Circumpolar Seabird Monitoring plan </a>
-
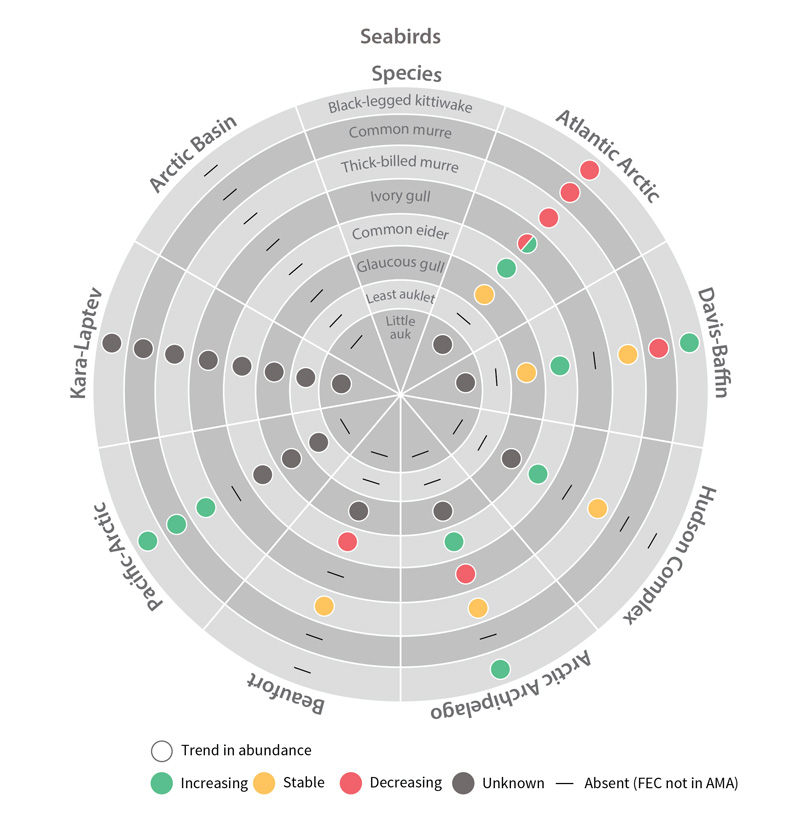
Trends in abundance of seabird Focal Ecosystem Components across each Arctic Marine Area. STATE OF THE ARCTIC MARINE BIODIVERSITY REPORT - Chapter 4 - Page 181 - Figure 4.5
-
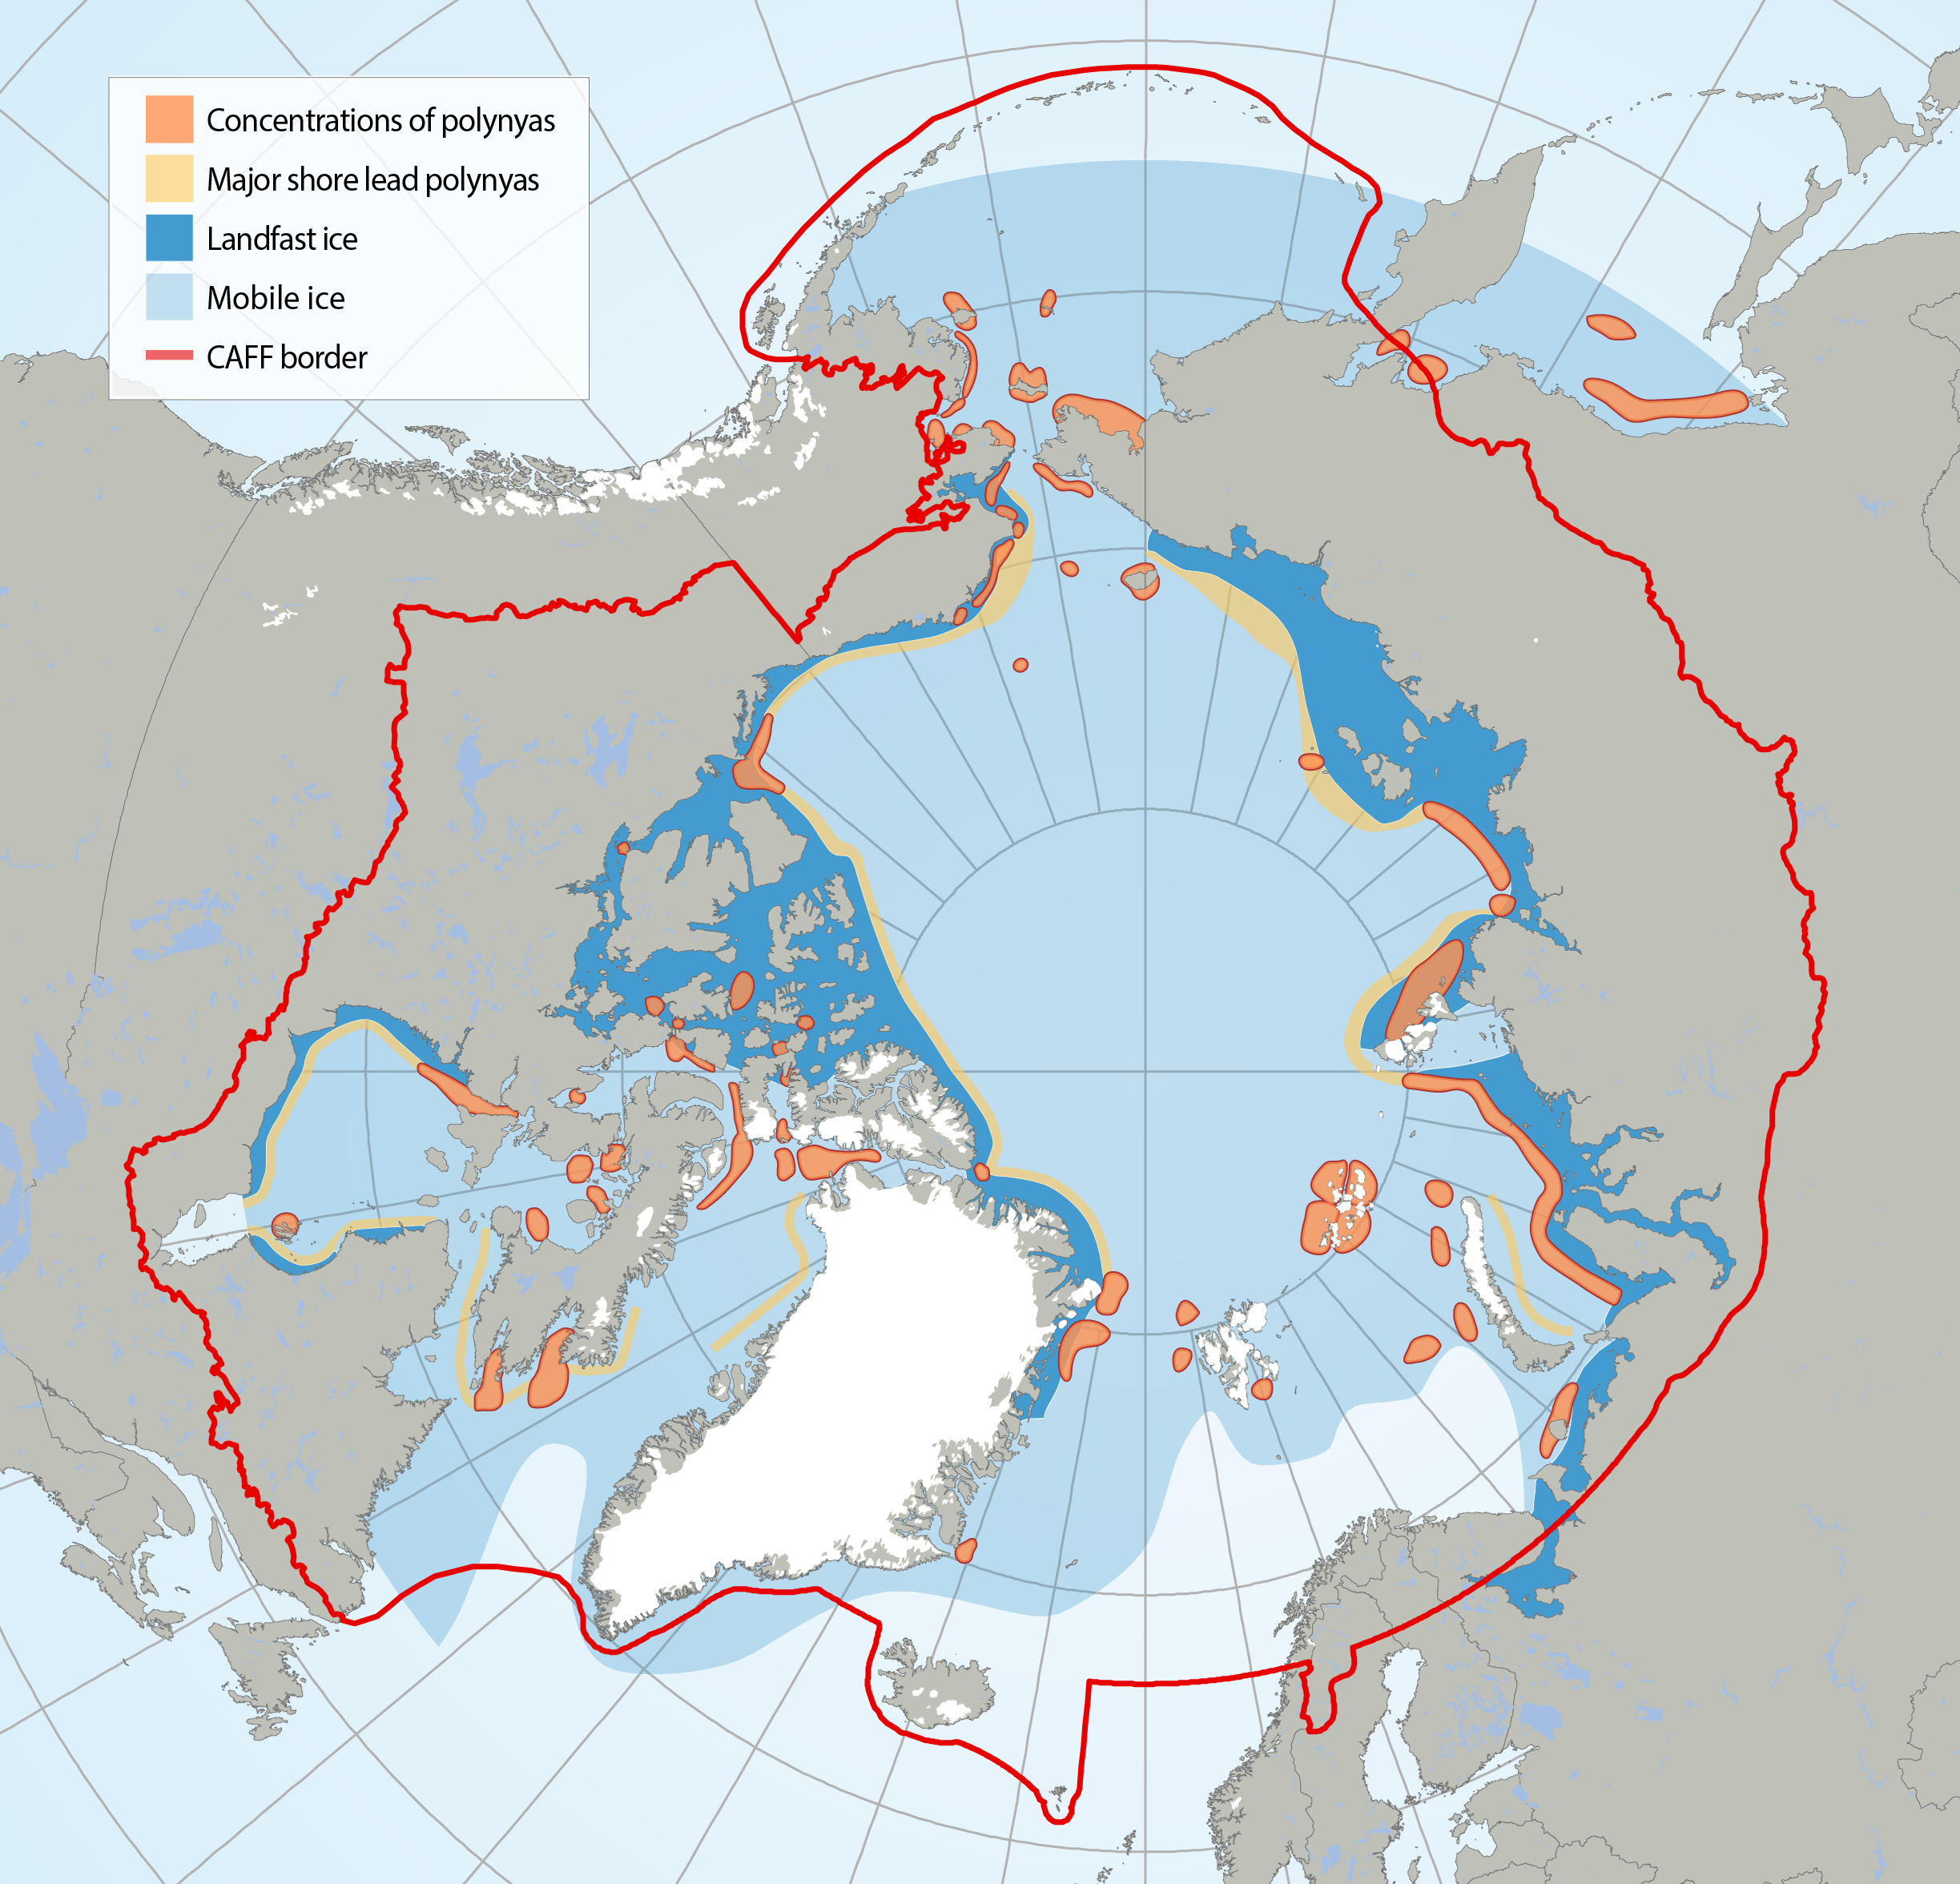
Circumpolar map of known polynyas. Note that polynyas are dynamic systems and some may no longer exist in the form known from their recent history. Adapted from Meltofte (2013) and based on Barber and Massom (2007). STATE OF THE ARCTIC MARINE BIODIVERSITY REPORT - <a href="https://arcticbiodiversity.is/marine" target="_blank">Chapter 2</a> - Page 28 - Figure 2.5
-
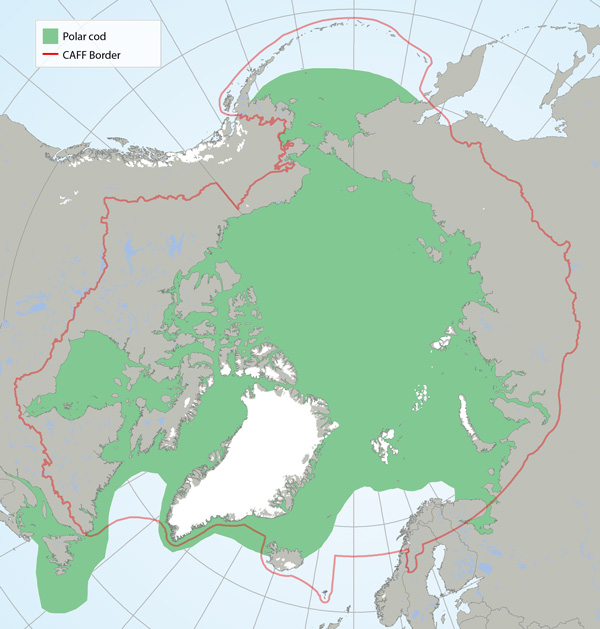
Distribution of polar cod (Boreogadus saida) based on participation in research sampling, examination of museum voucher collections and the literature (Mecklenburg et al. 2011, 2014, 2016; Mecklenburg and Steinke 2015). Map shows the maximum distribution observed from point data and includes both common and rare locations. STATE OF THE ARCTIC MARINE BIODIVERSITY REPORT - <a href="https://arcticbiodiversity.is/findings/marine-fishes" target="_blank">Chapter 3</a> - Page 114 - Figure 3.4.2
-
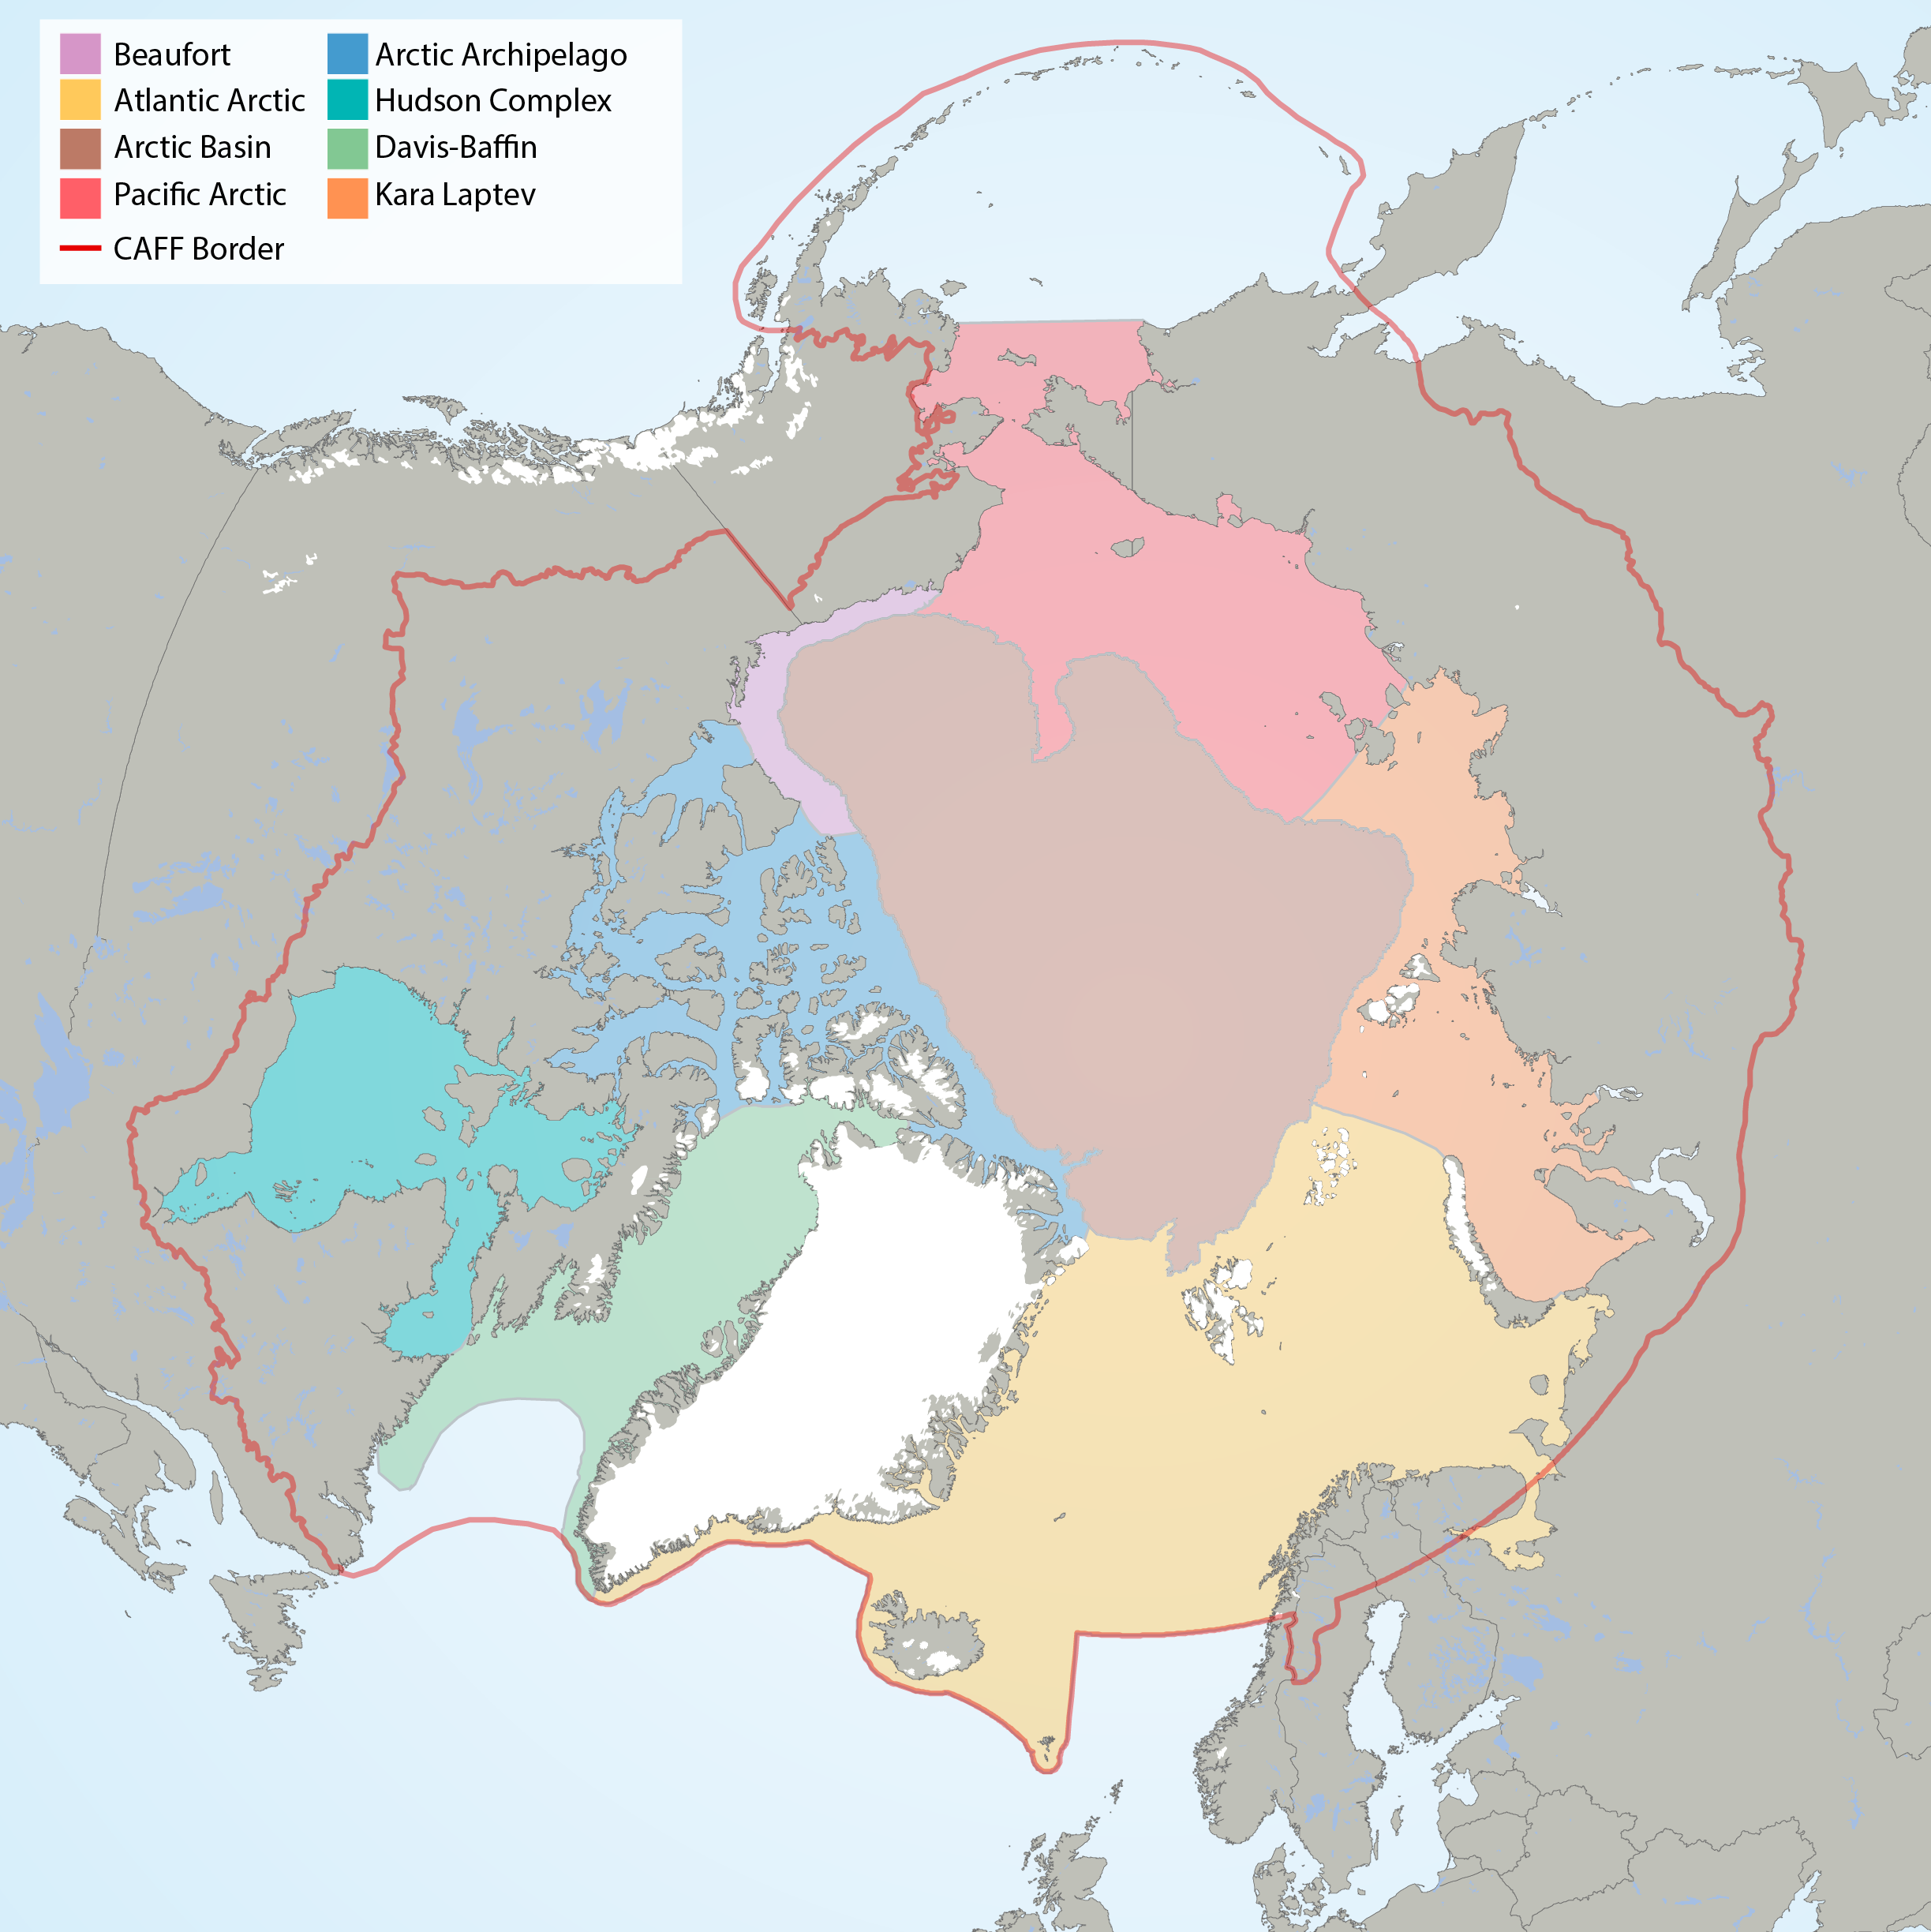
Arctic Marine Areas (AMAs) as defined in the CBMP Marine Plan. STATE OF THE ARCTIC MARINE BIODIVERSITY REPORT - <a href="https://arcticbiodiversity.is/marine" target="_blank">Chapter 1</a> - Page 15 - Figure 1.2
-
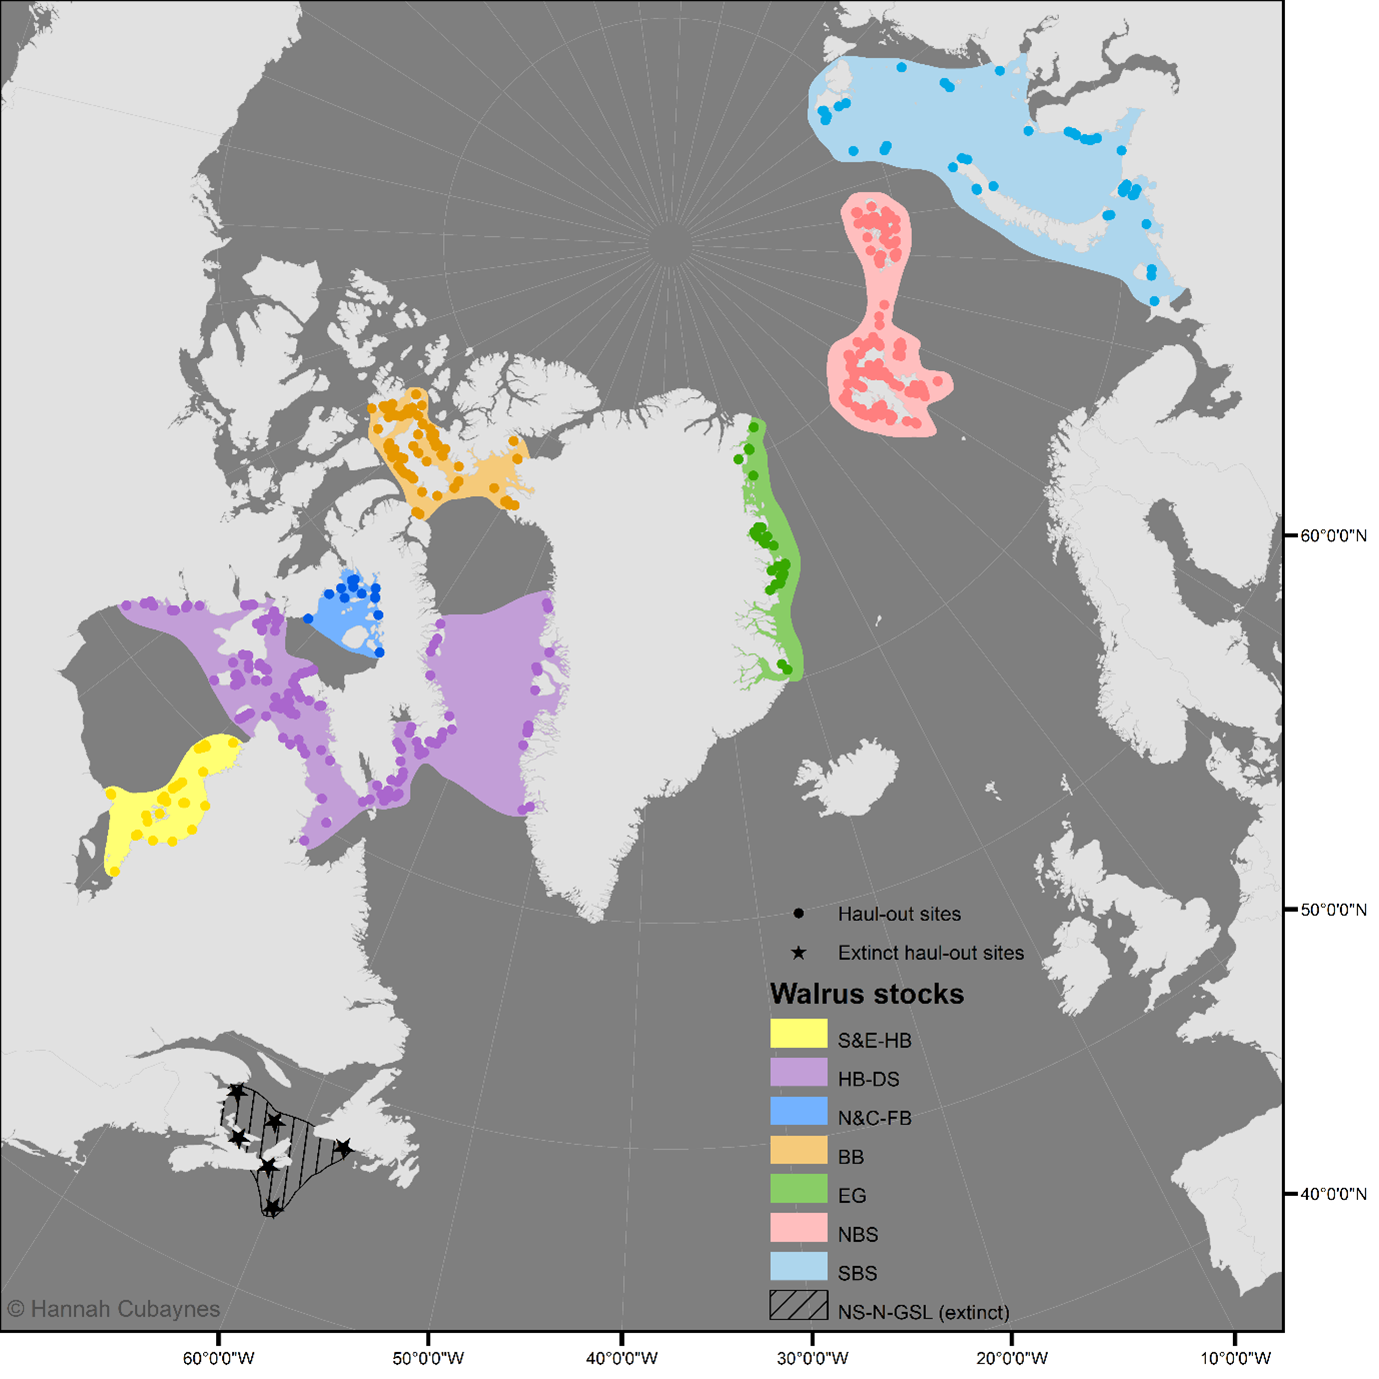
A dataset compiling all known terrestrial haul-out sites for the Atlantic walrus. The dataset comprises of the following documents: (1) the database in .csv format: walrus_haulout_database_Atlantic_caff_v4.csv; (2) the database in .shp format: walrus_haulout_database_Atlantic_caff_v4.shp; and (3) a user guidance document: user_guidance_atlantic_walrus_db.docx. The dataset will be updated annually. The latest update was 14th May 2025.
-
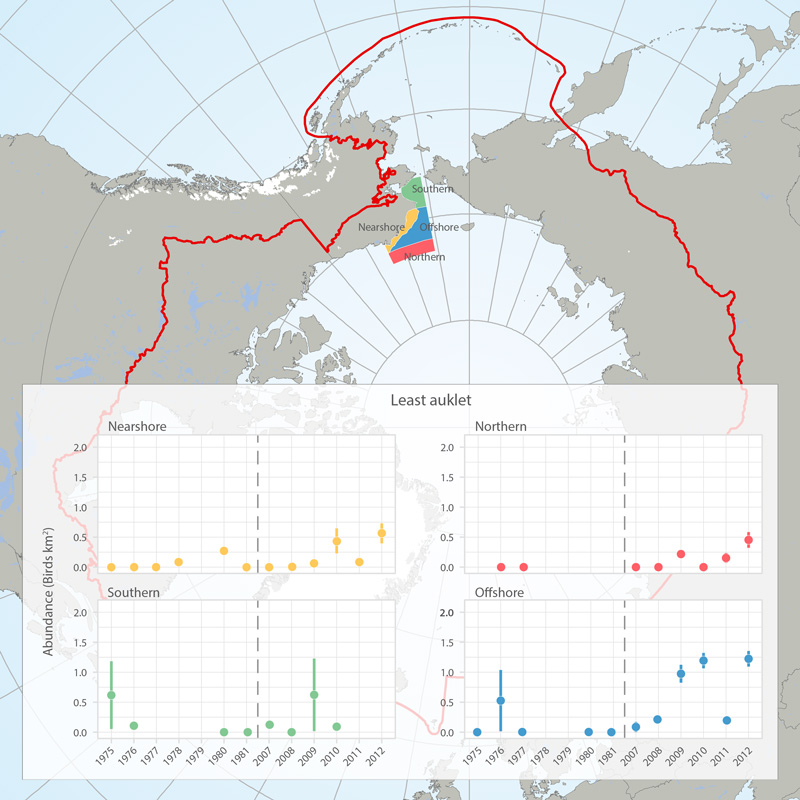
Abundance (birds/km2) of least auklets in four regions (see map) of the eastern Chukchi Sea, 1975-1981 and 2007-2012, based on at-sea surveys (archived in the North Pacific Pelagic Seabird Database). Figures provided by Adrian Gall, ABR, Inc. and reprinted with permission. STATE OF THE ARCTIC MARINE BIODIVERSITY REPORT - <a href="https://arcticbiodiversity.is/findings/seabirds" target="_blank">Chapter 3</a> - Page 138 - Box fig. 3.5.1 The shapefile outlines 4 regions of the eastern Chukchi Sea that were surveyed for seabirds during the open-water seasons of 1976-2012. We compared the density of seabirds in these regions among two time periods (1975-1981 and 2008-2012) to assess changes in seabird abundance over the past 4 decades. We also include a figure showing abundance of Least Auklets 1975-2012. Data are from the North Pacific Pelagic Seabird Database, maintained by the USGS (http://alaska.usgs.gov/science/biology/nppsd/index.php).
-
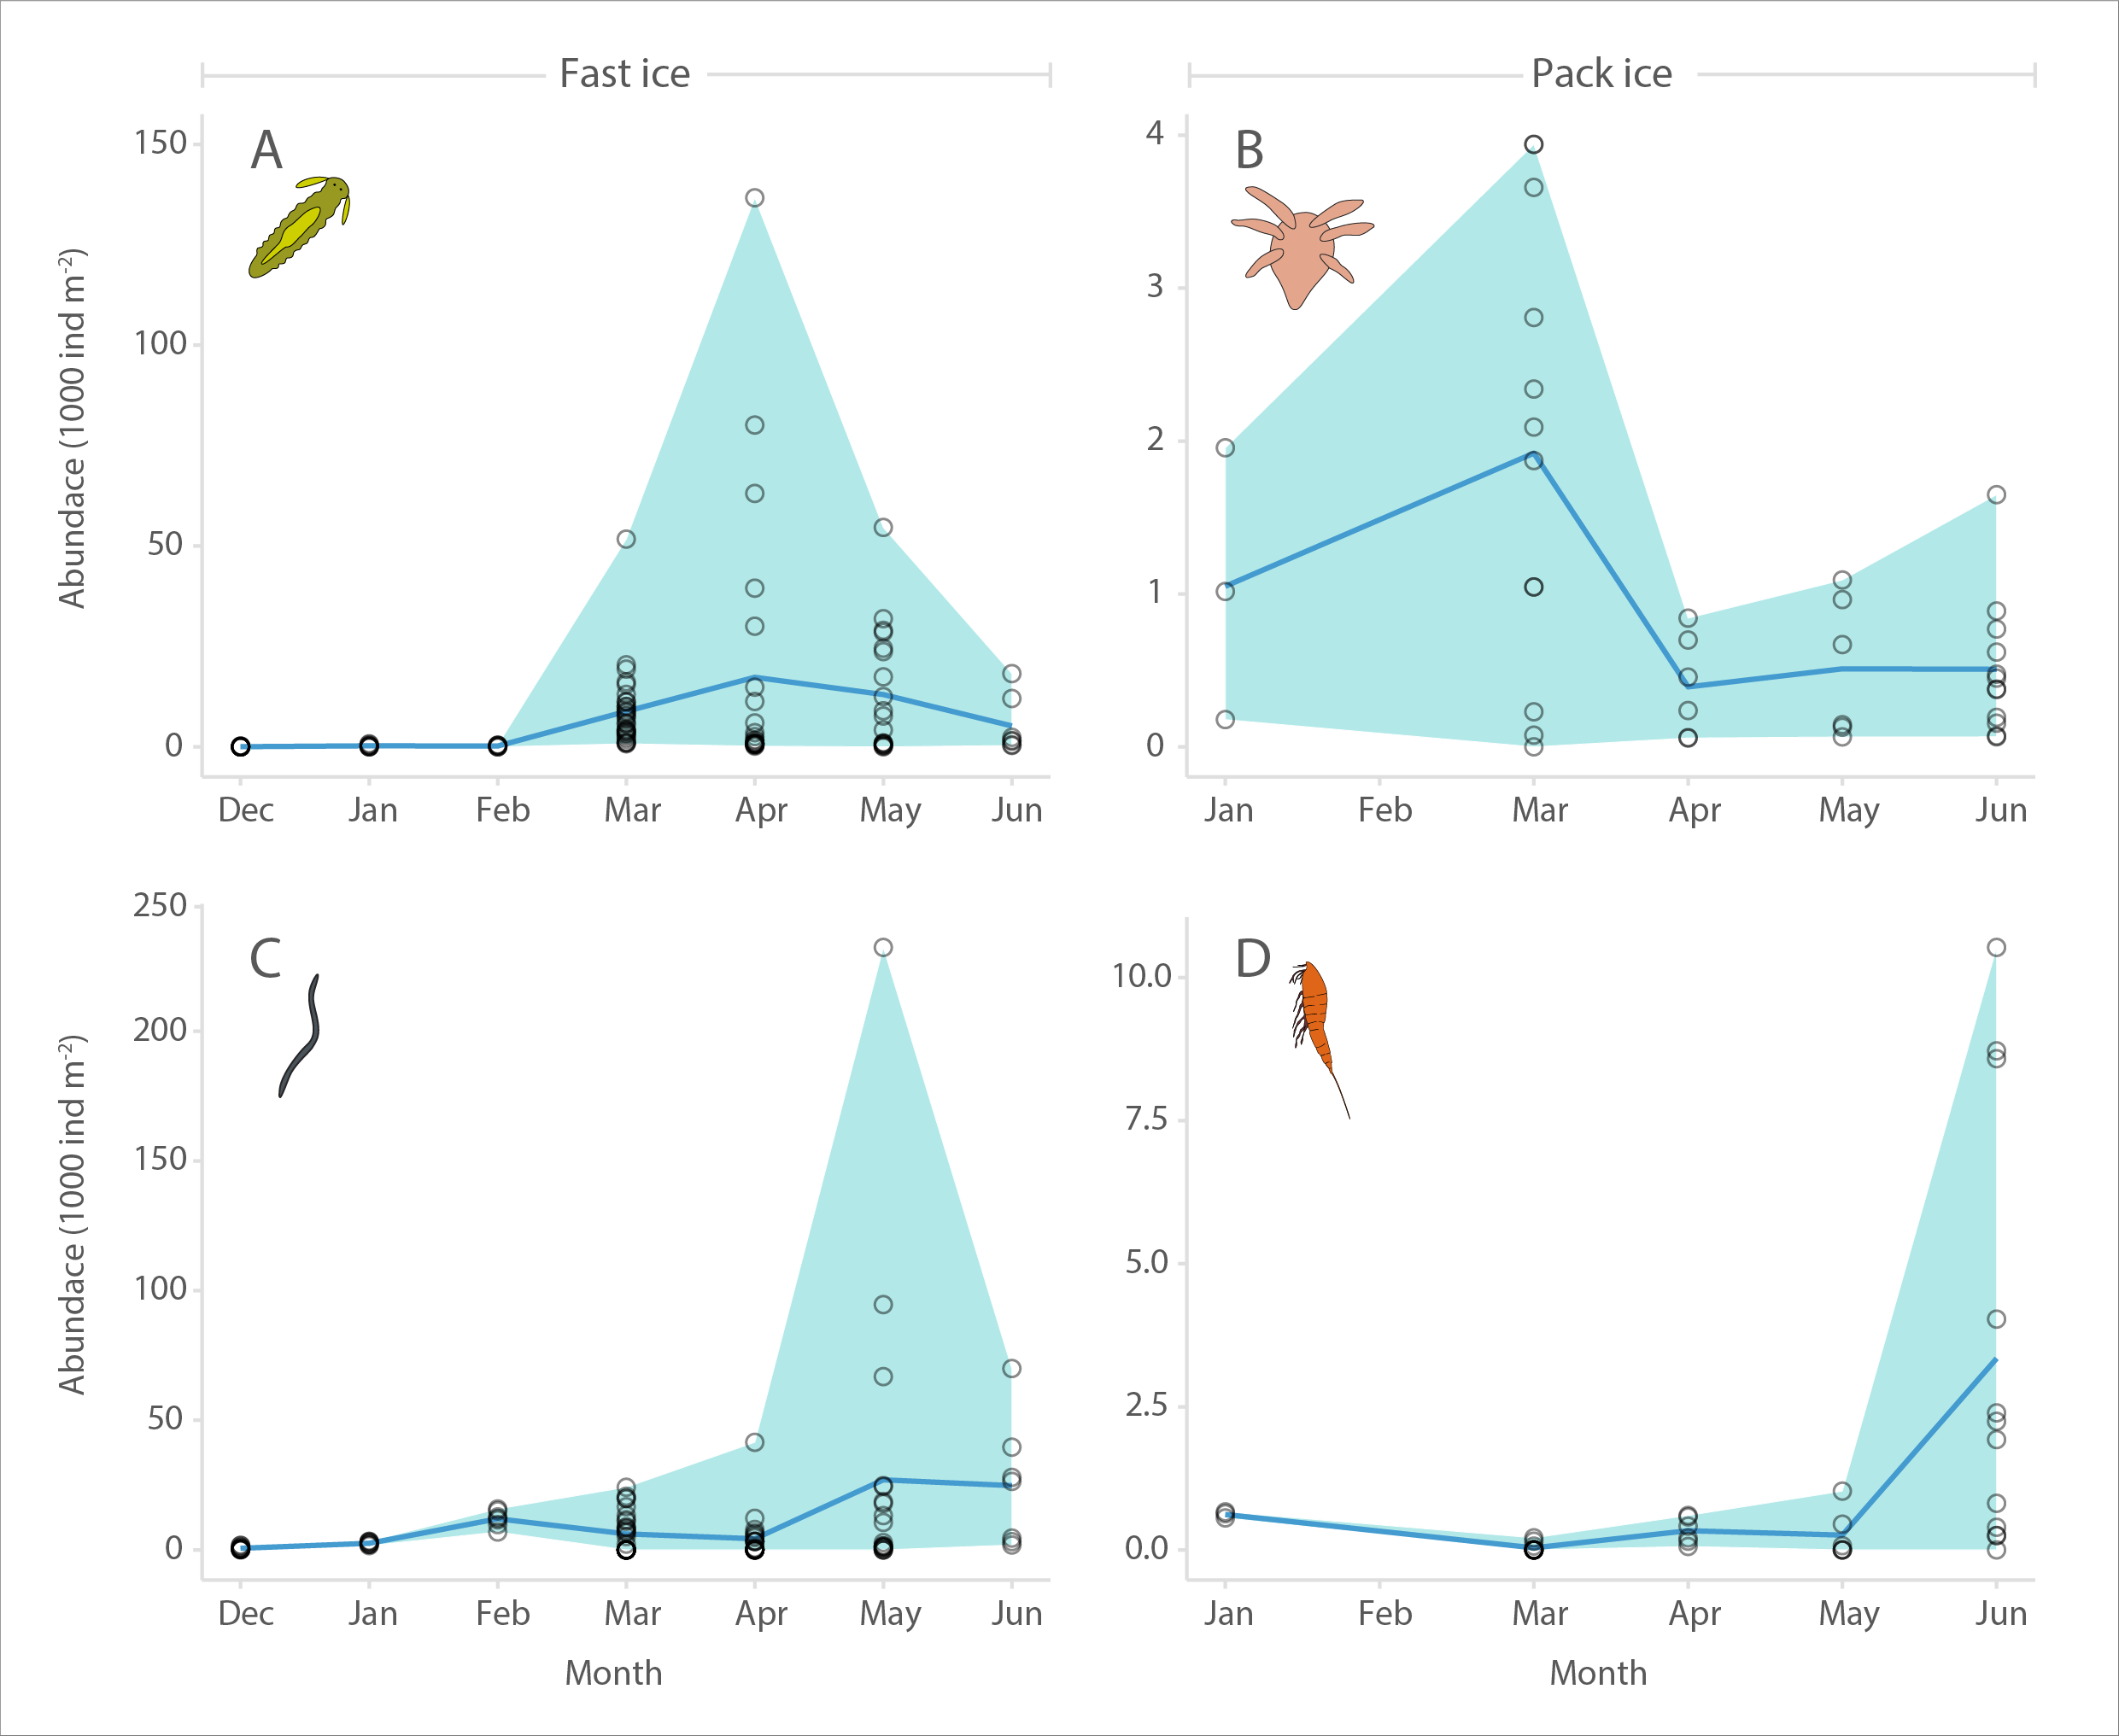
Seasonal abundance (1000 individuals m- 2) of sea ice meiofauna at landfast sea ice (Barrow, 2005-2006, A and C) and pack ice (North of Svalbard, 2015, B and D). A and B show larval stages (polychaete juveniles and nauplii, respectively), while C and D show nematodes and harpacticoid copepods, respectively. Circles represent individual cores (n = 107 for A and C, and 39 for B and D), shading the extent of minimum as well as maximum values, and blue line indicates mean values. STATE OF THE ARCTIC MARINE BIODIVERSITY REPORT - <a href="https://arcticbiodiversity.is/findings/sea-ice-biota" target="_blank">Chapter 3</a> - Page 43 - Figure 3.1.5 From the report draft: "In addition to showing composition and peak abundance ranges, we illustrate the phenology of ice meiofauna over the ice-covered season in the entire combined data set. For this purpose, the data were normalized to the daylight hours at each location during the date of sampling using R package geosphere (Hijmans 2015) and a method described in Forsythe et al. (1995). This was necessary, because ‘spring’ arrives earlier at lower latitudes than at higher latitudes, so that using month or day of year would obscure the pan-Arctic integration of the data. Other influential factors such as snow depth, ice thickness and nutrient concentrations were not accounted for in this analysis."