Oceans
Type of resources
Available actions
Topics
Keywords
Contact for the resource
Provided by
Years
Formats
Representation types
Update frequencies
status
Scale
-
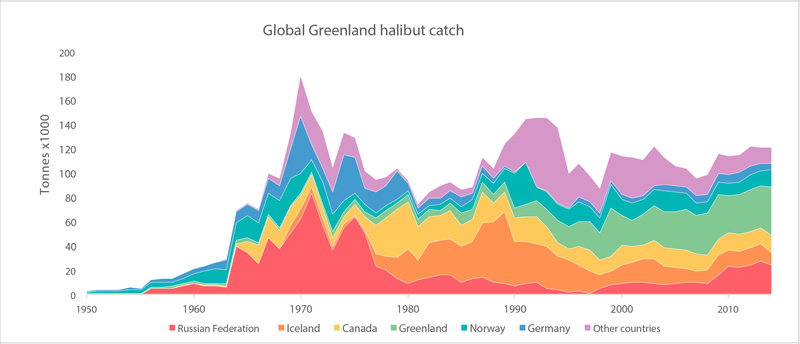
Global catches of Greenland halibut (FAO 2015). STATE OF THE ARCTIC MARINE BIODIVERSITY REPORT - <a href="https://arcticbiodiversity.is/findings/marine-fishes" target="_blank">Chapter 3</a> - Page 121 - Figure 3.4.8
-
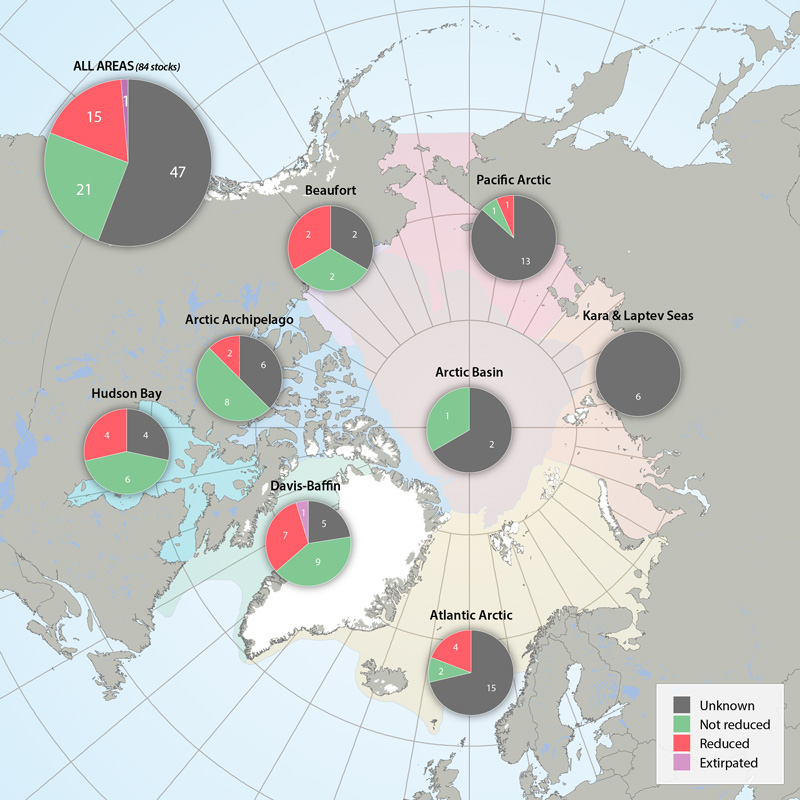
Status of marine mammal Focal Ecosystem Component stocks by Arctic Marine Area. STATE OF THE ARCTIC MARINE BIODIVERSITY REPORT - <a href="https://arcticbiodiversity.is/findings/marine-mammals" target="_blank">Chapter 3</a> - Page 157 - Figure 3.6.3
-
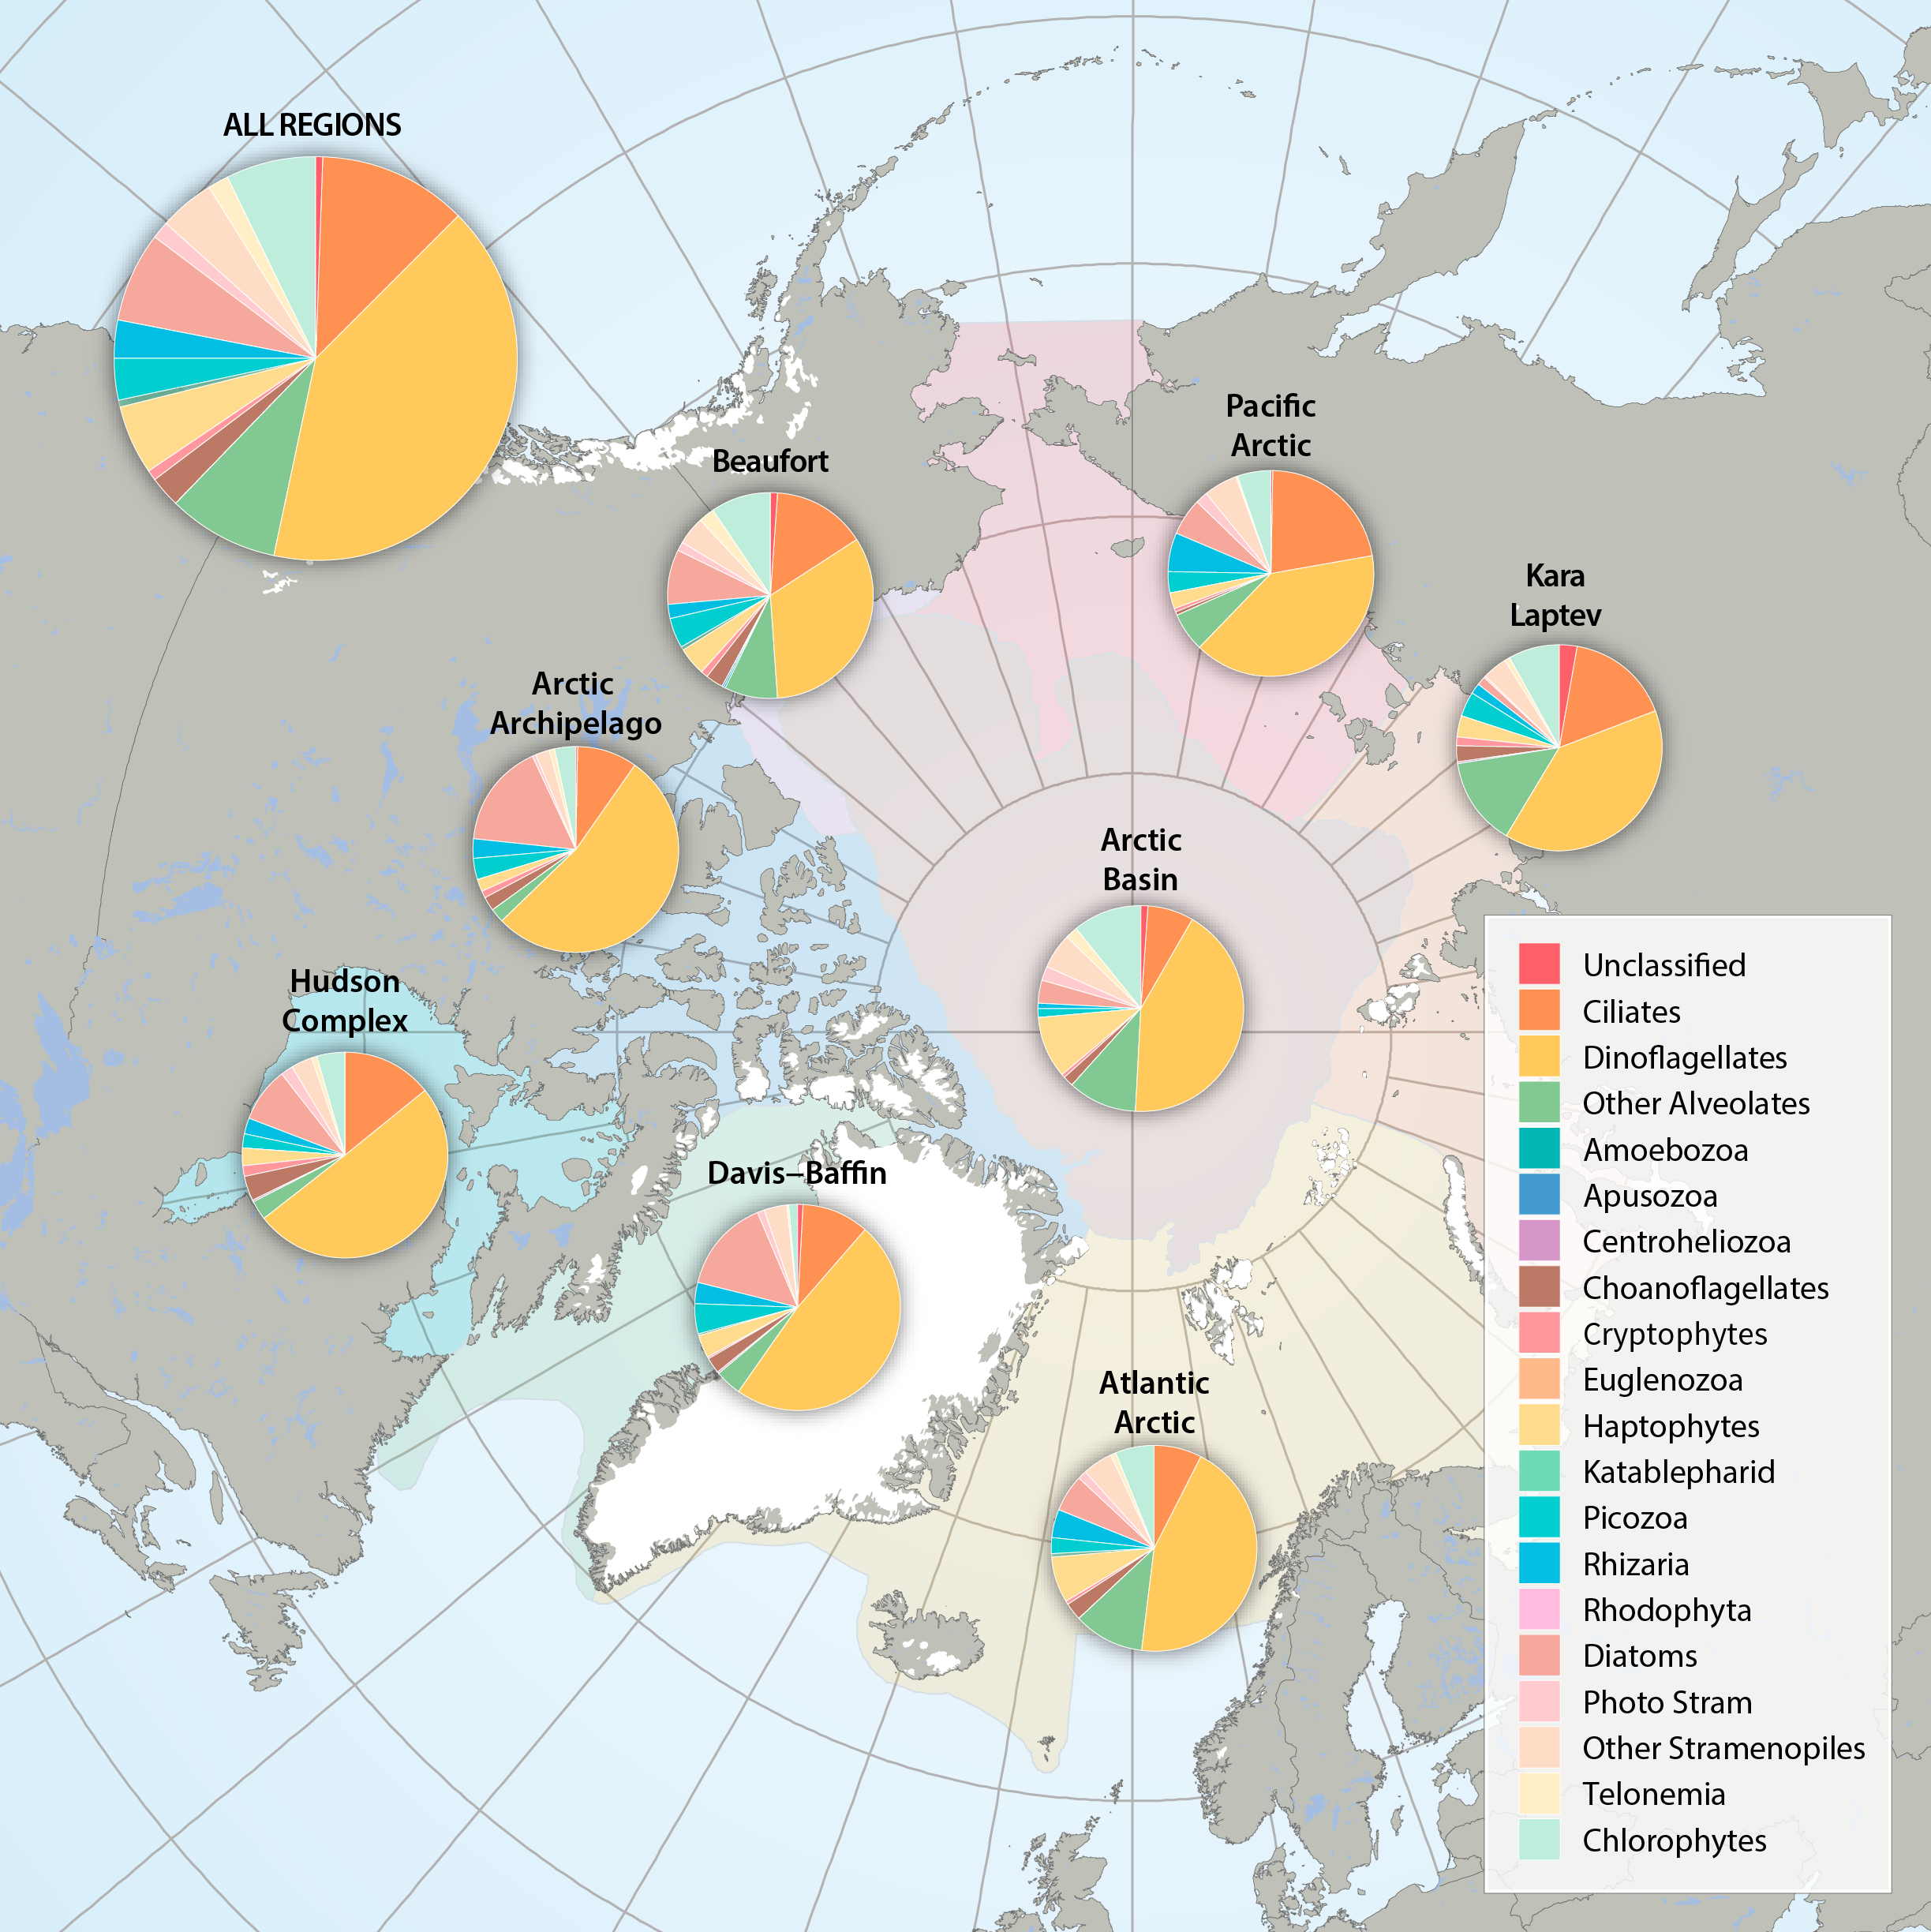
Figure 3.2.2a: Relative abundance of major eukaryote taxonomic groups found by high throughput sequencing of the small-subunit (18S) rRNA gene across Arctic Marine Areas. Figure 3.2.2b: Relative abundance of major eukaryote functional groups found by microscopy in the Arctic Marine Areas. STATE OF THE ARCTIC MARINE BIODIVERSITY REPORT - <a href="https://arcticbiodiversity.is/findings/plankton" target="_blank">Chapter 3</a> - Page 70 - Figures 3.2.2a and 3.2.2b
-
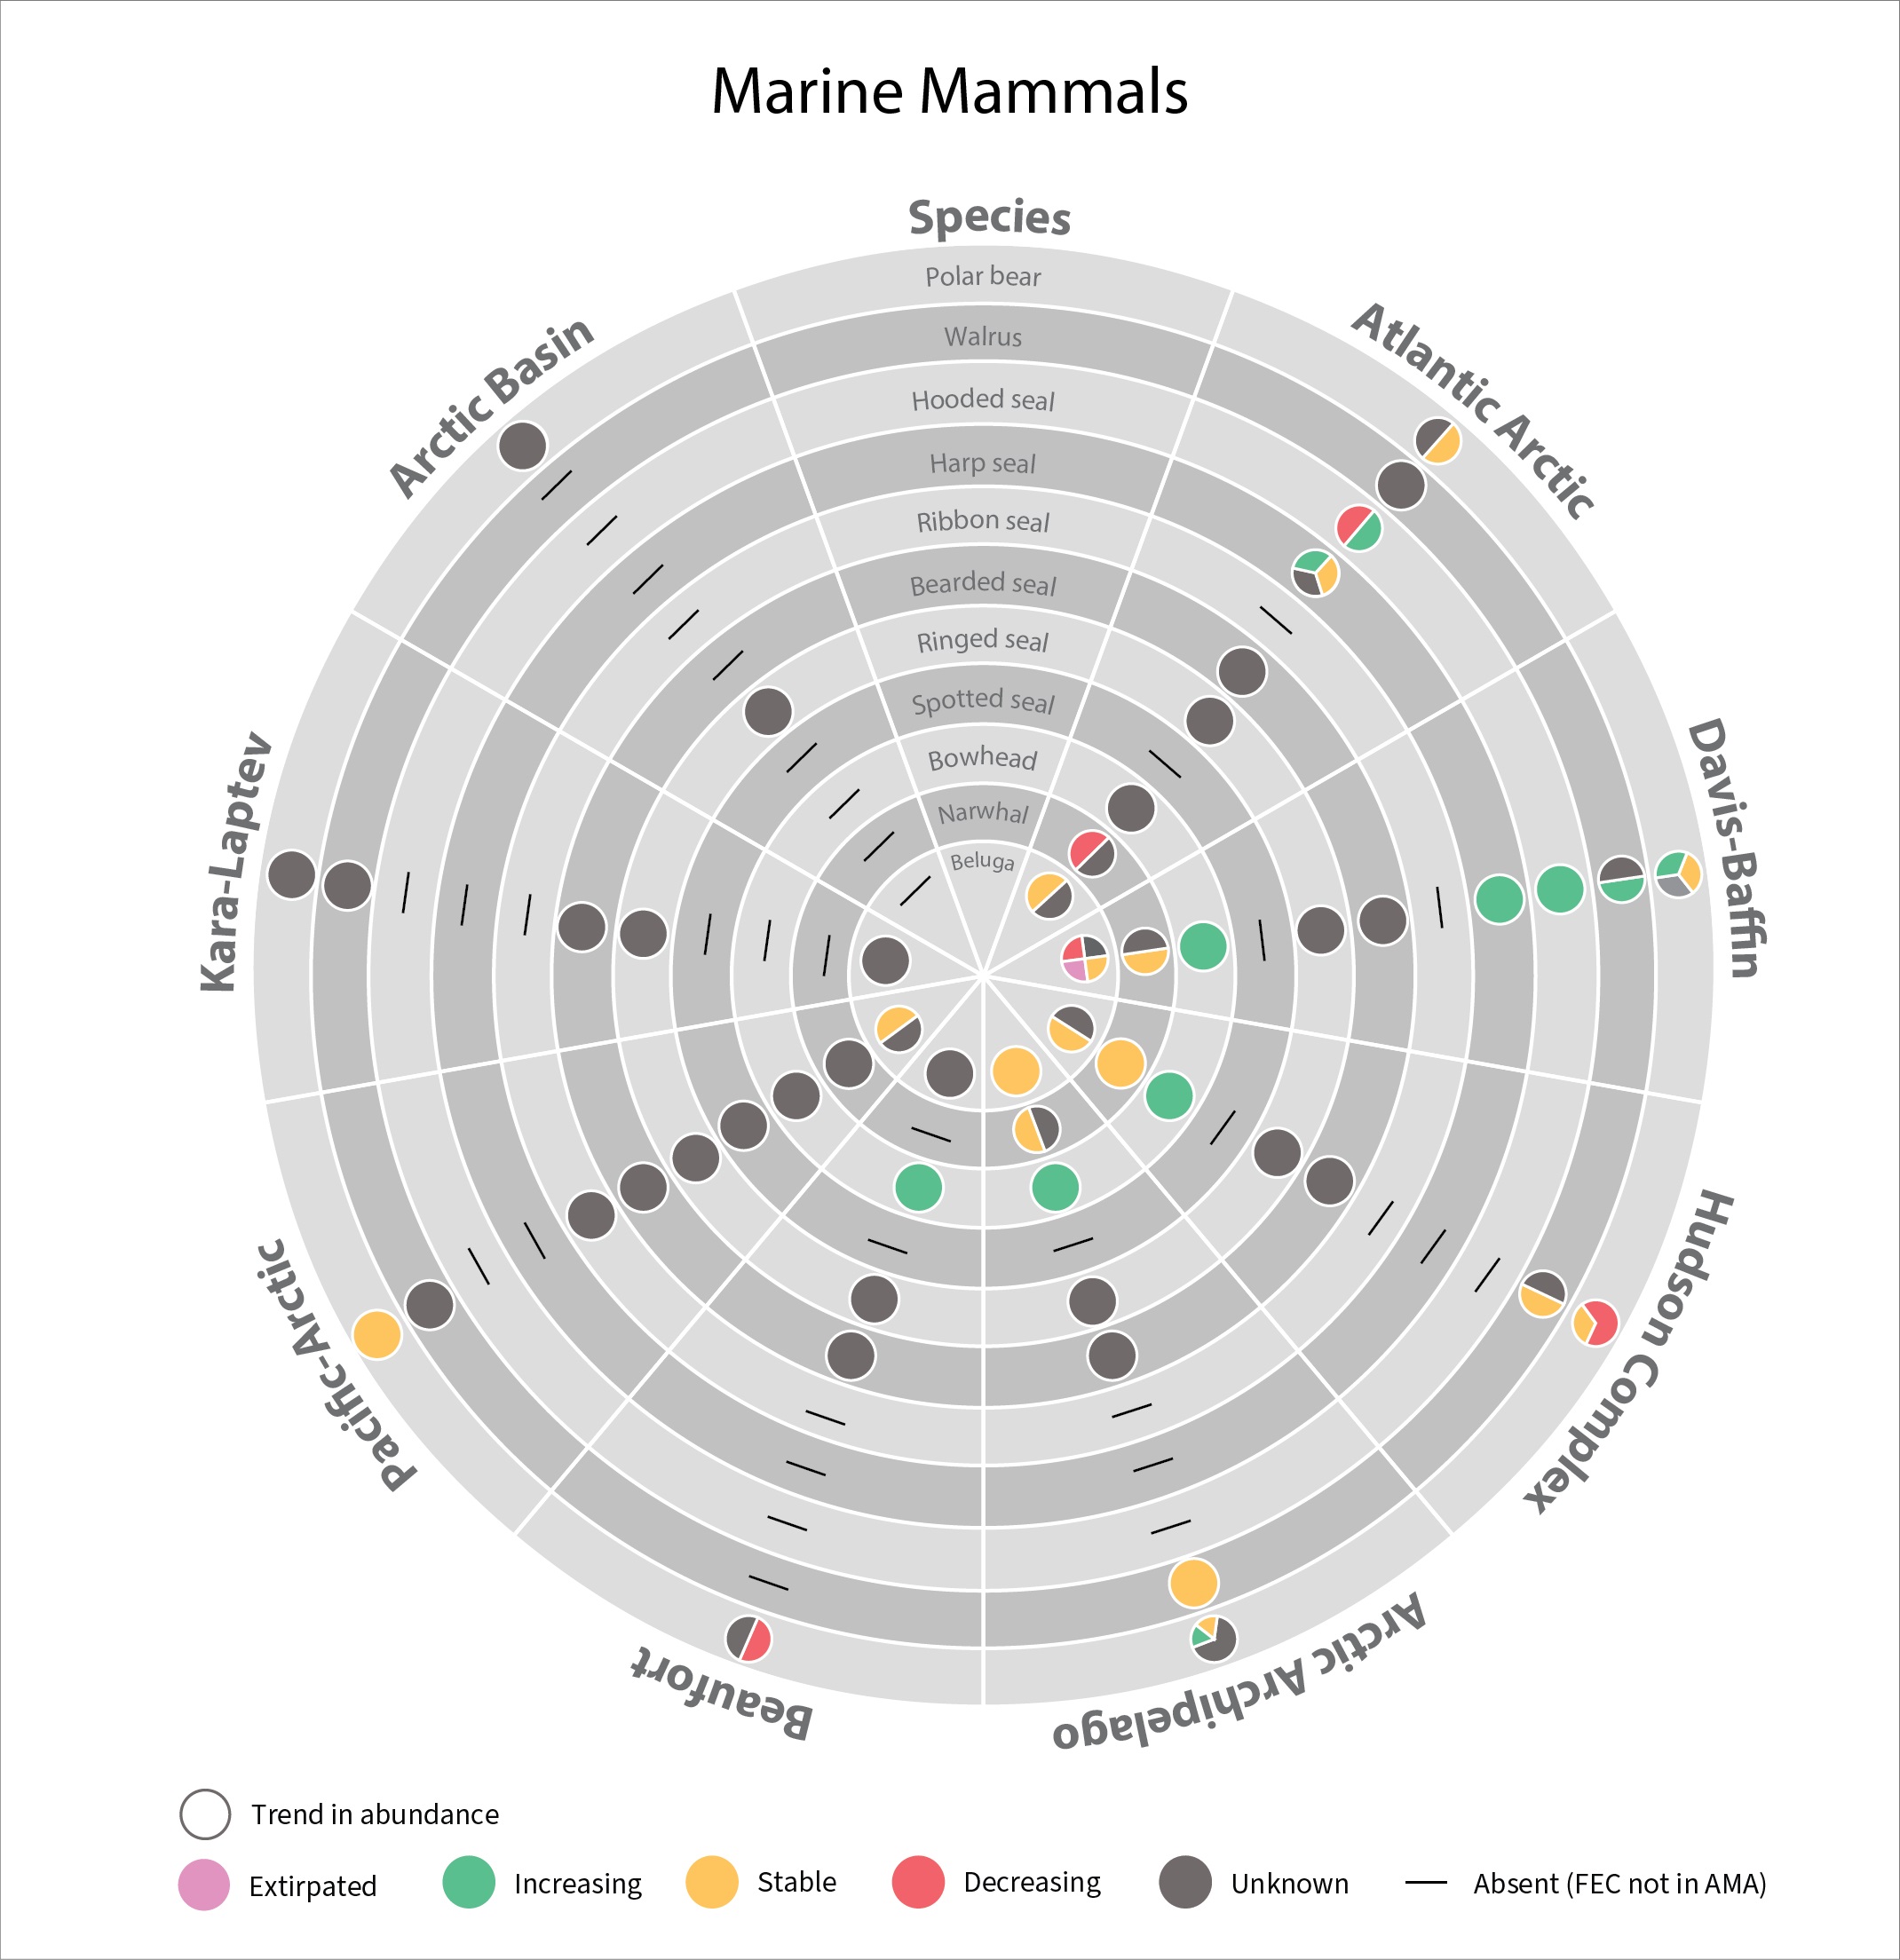
In 2017 the SAMBR synthesized data about biodiversity in Arctic marine ecosystems around the circumpolar Arctic.. SAMBR highlighted observed changes and relevant monitoring gaps. This 2021 update provides information on the status of marine mammals in the Arctic from 2015–2020: More detail can be found in the Marine Mammals 2021 Technical report. STATE OF THE ARCTIC MARINE BIODIVERSITY REPORT
-
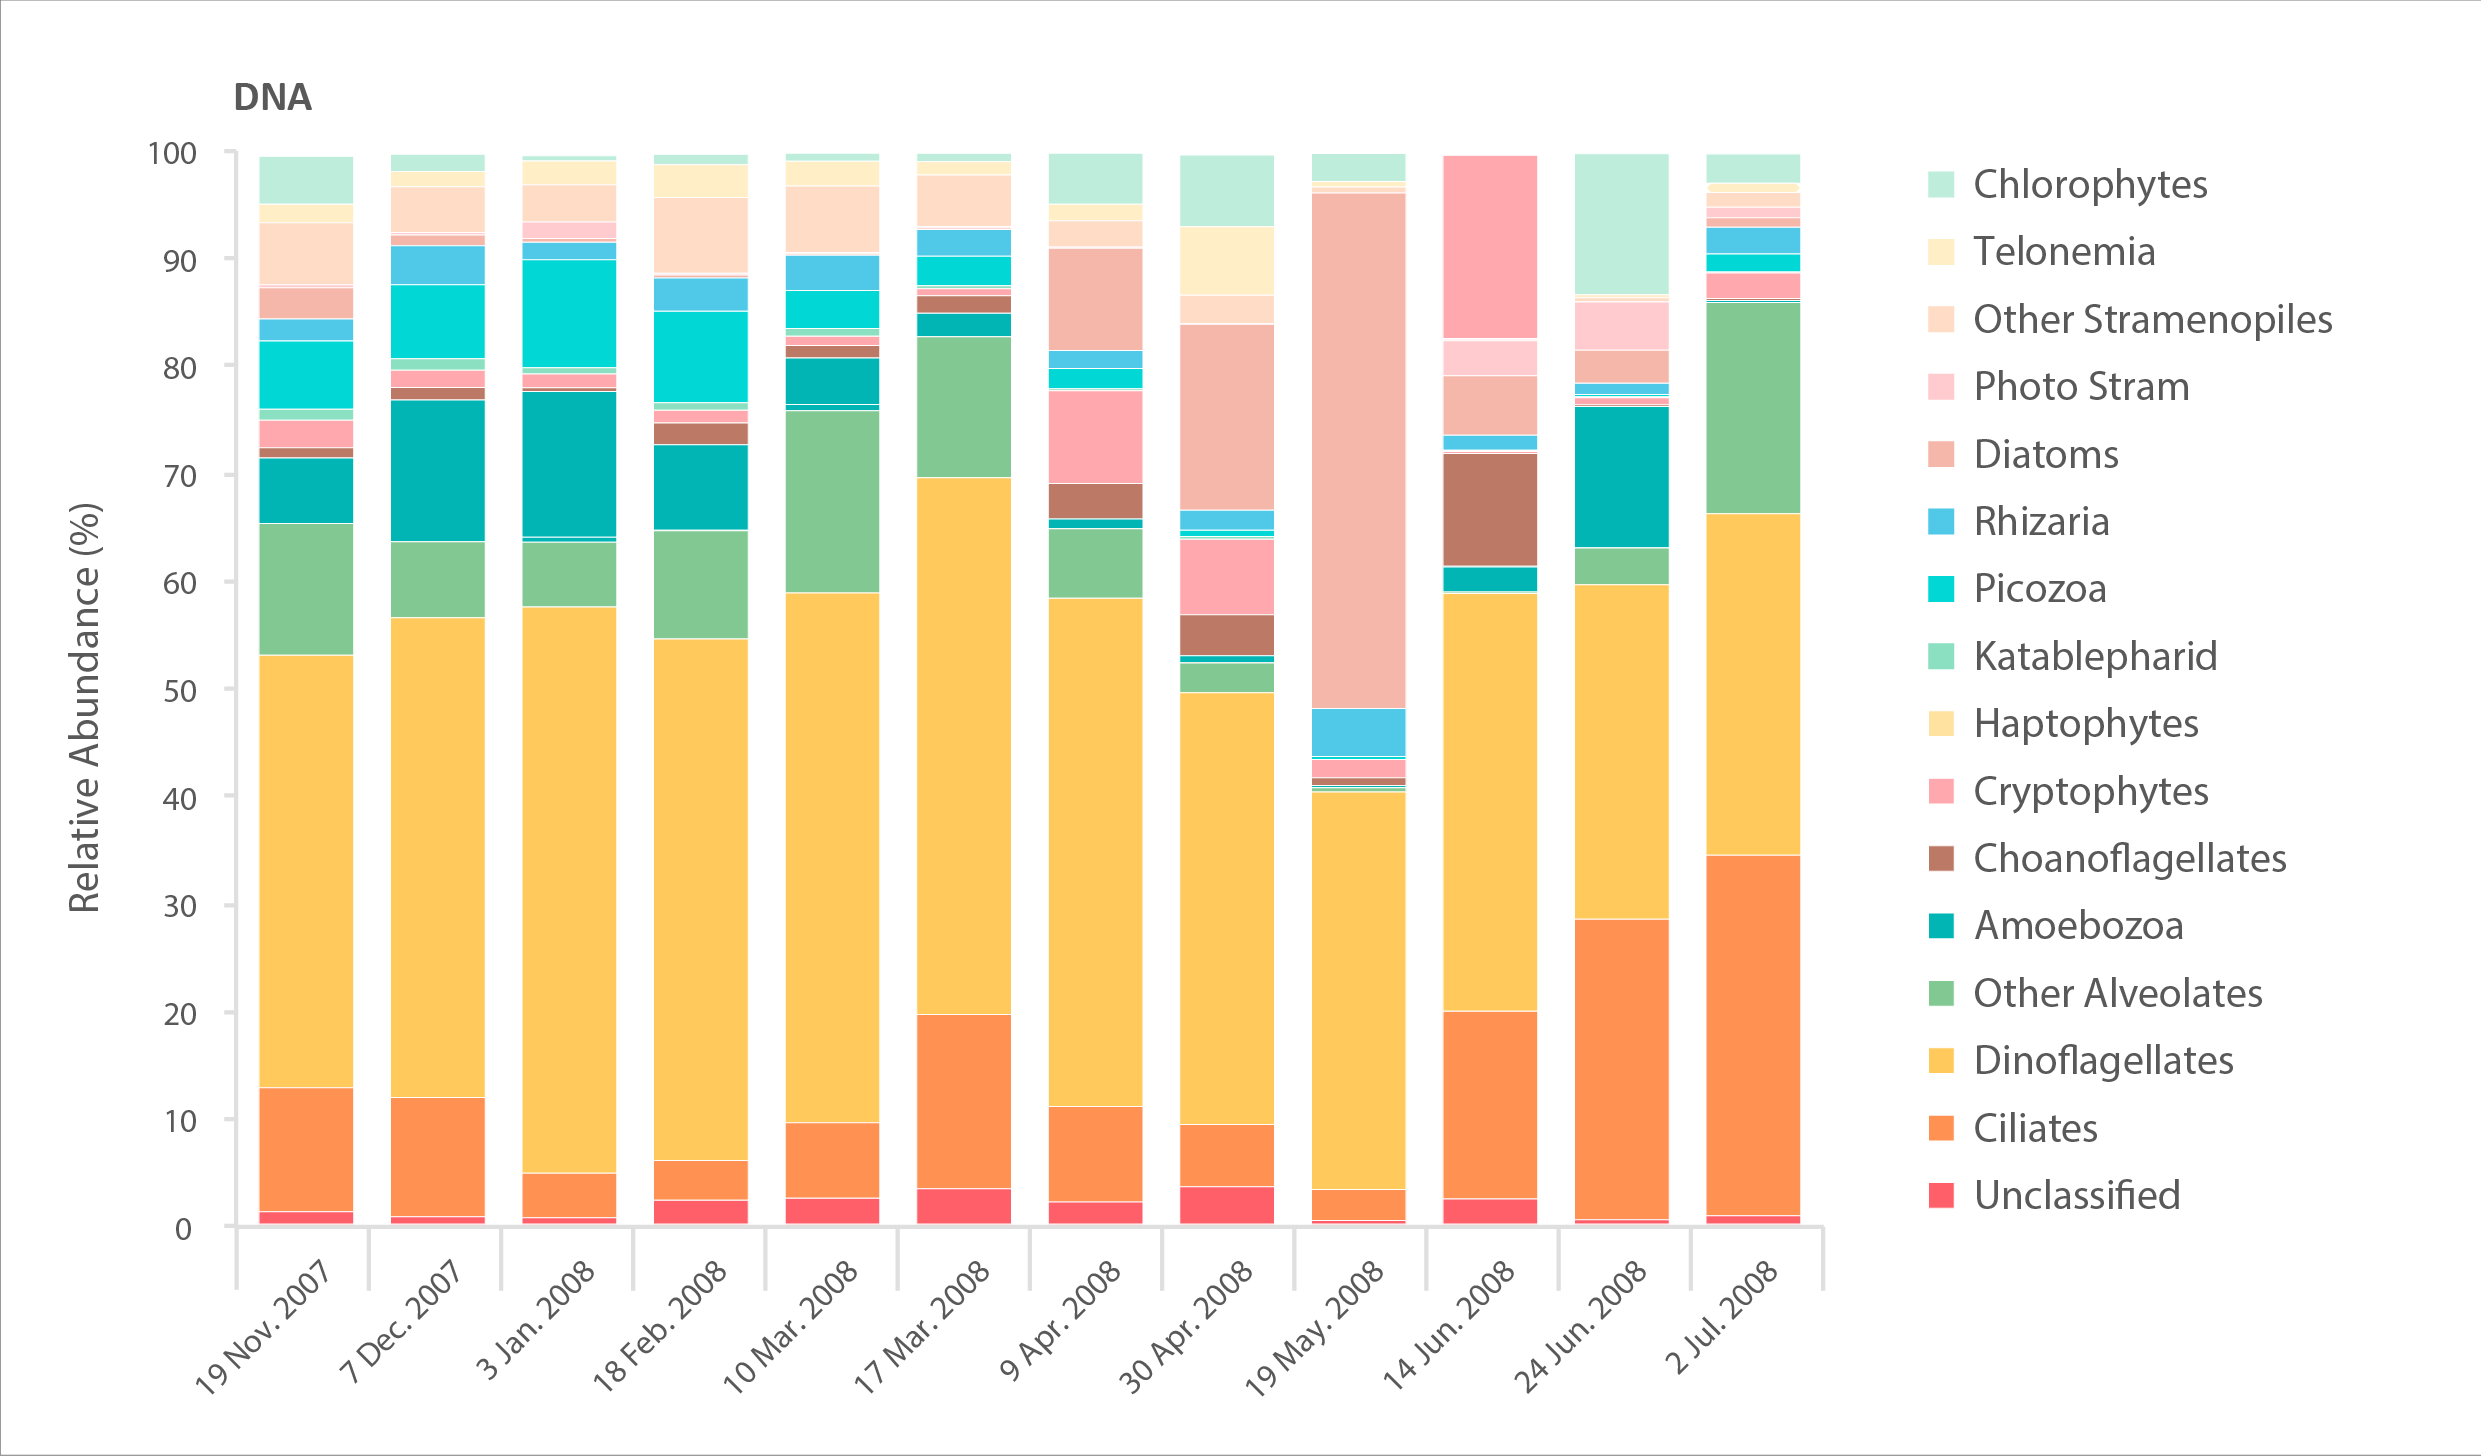
Relative abundance of major eukaryote taxonomic groups found by high throughput sequencing of the small-subunit (18S) rRNA gene. Time series collected by sampling every 2-6 weeks in Amundsen Gulf of the Beaufort Sea over the winter-spring transition in 2007–2008. Sampling DNA gives information about presence/absence, while sampling RNA gives information about the state of activity of different taxa. STATE OF THE ARCTIC MARINE BIODIVERSITY REPORT - <a href="https://arcticbiodiversity.is/findings/plankton" target="_blank">Chapter 3</a> - Page 72 - Figures 3.2.3
-
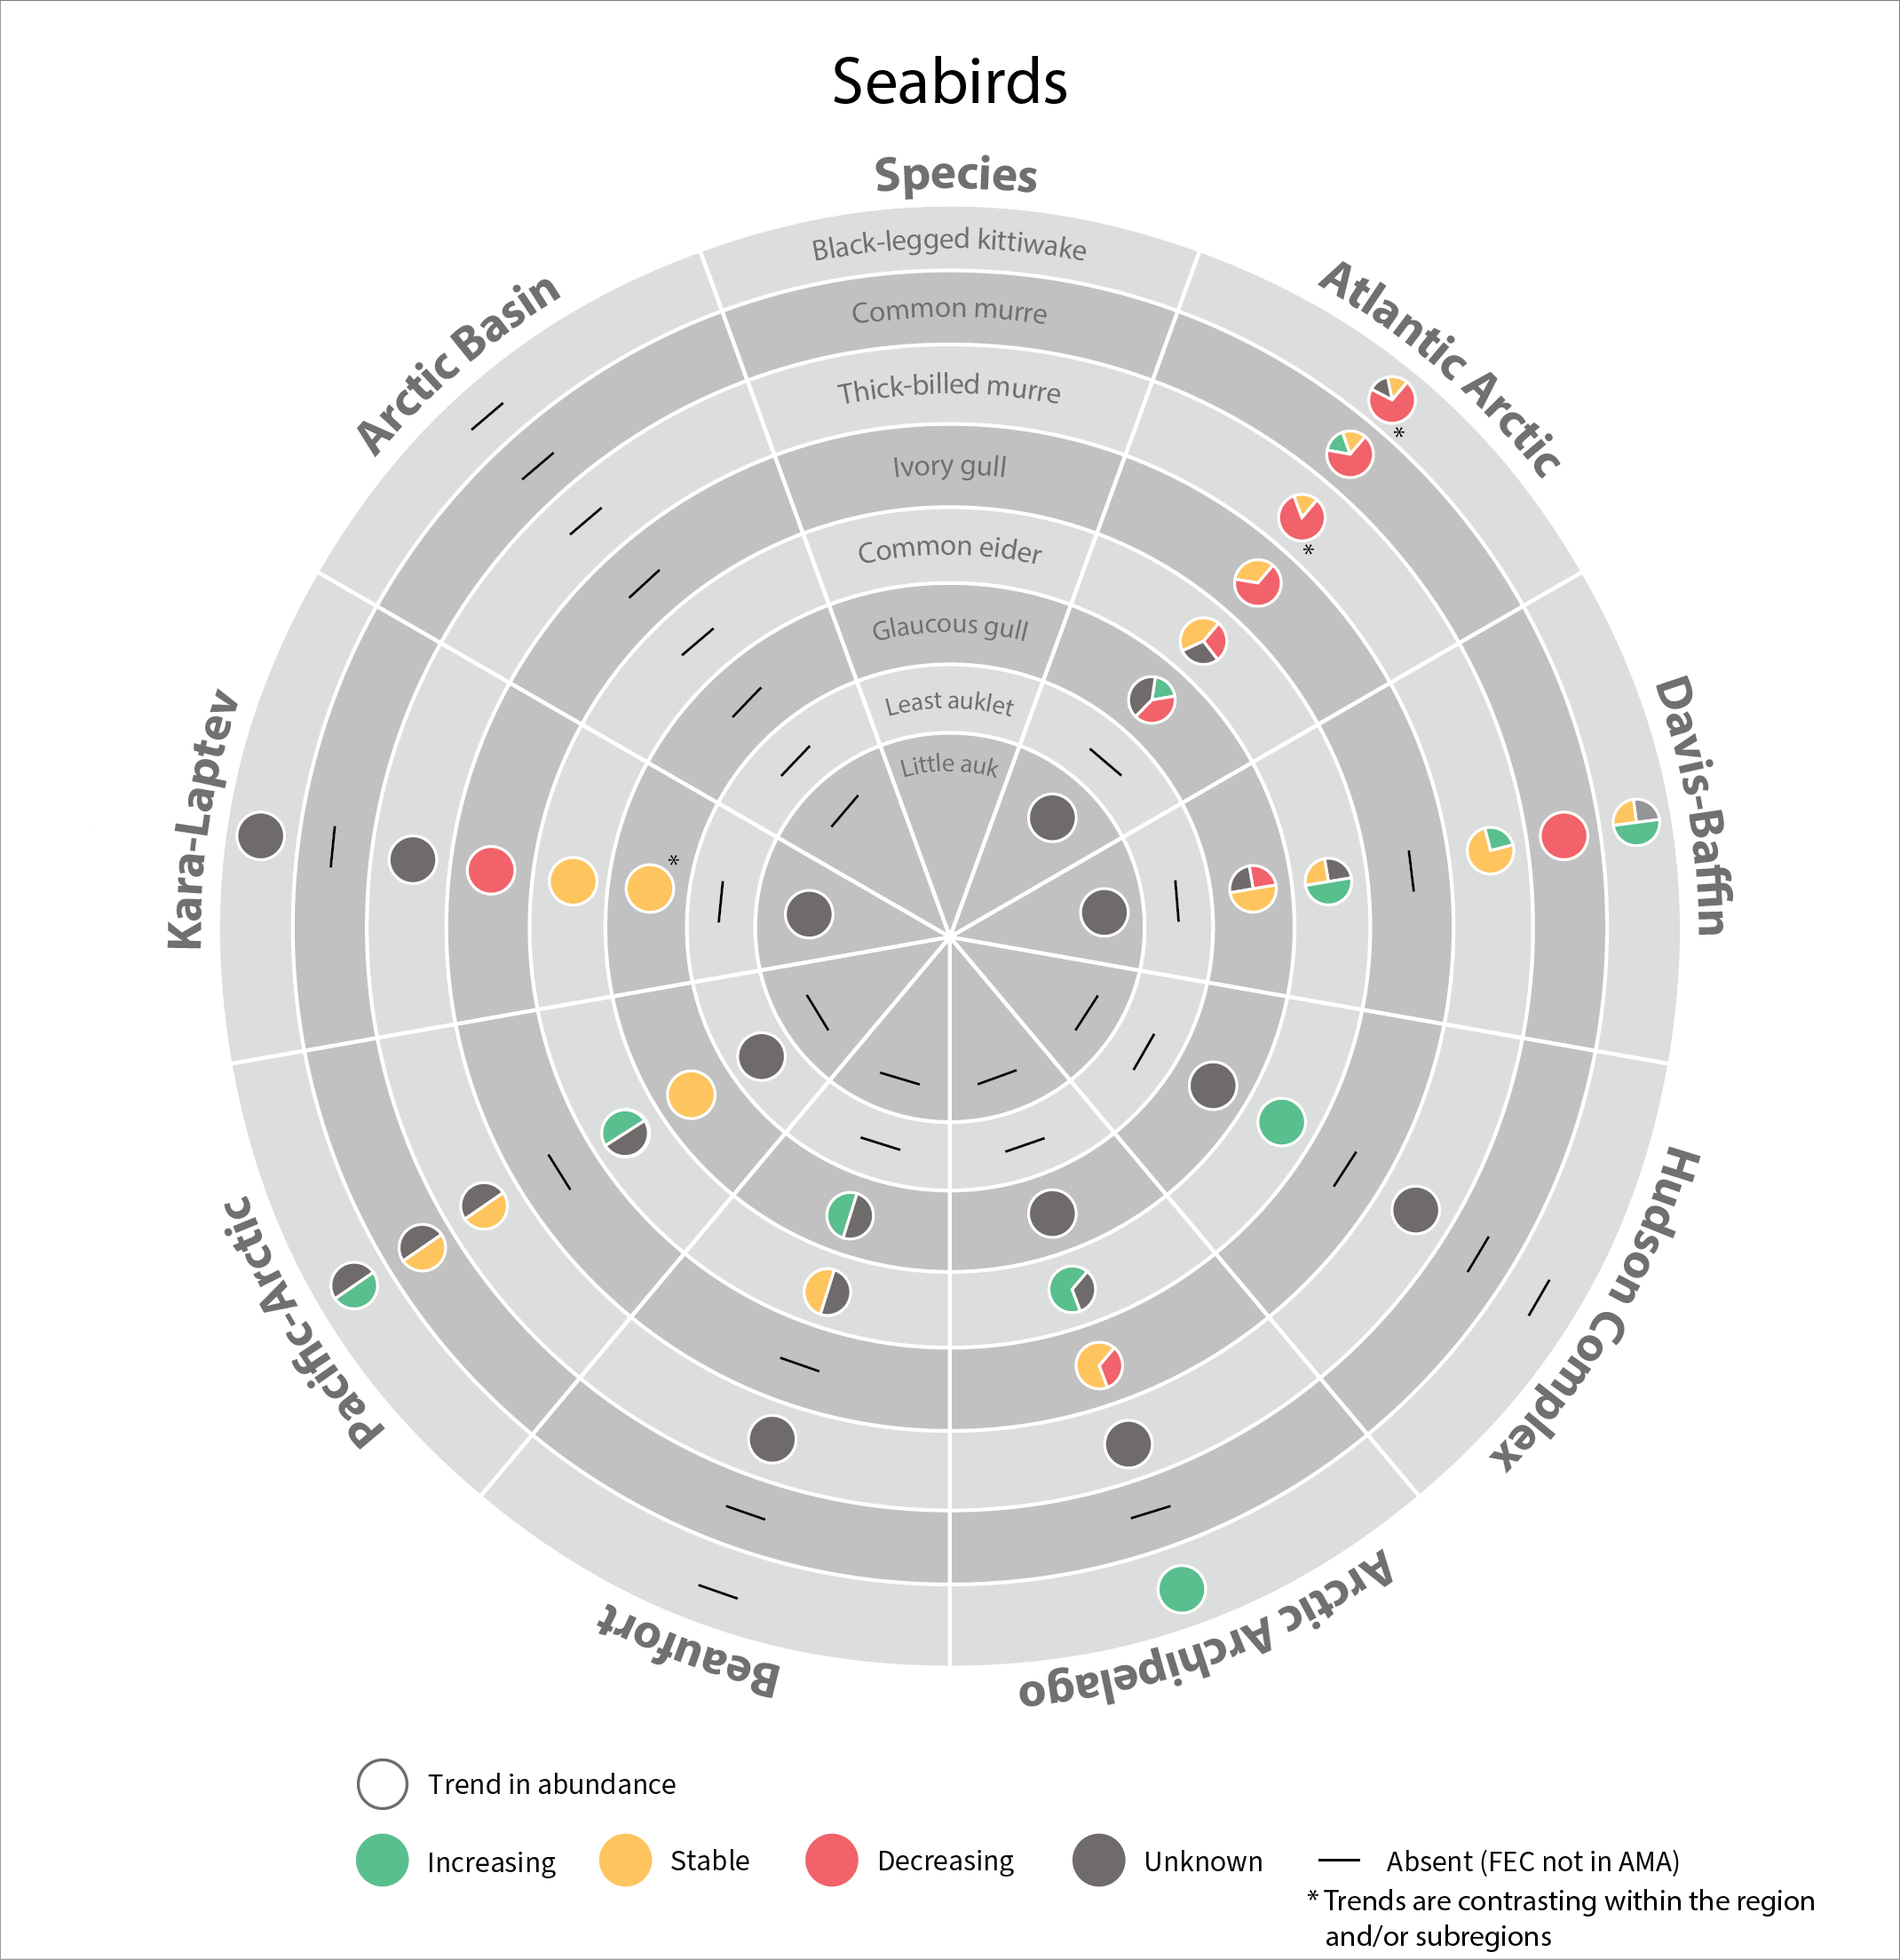
In 2017, the SAMBR synthesized data about biodiversity in Arctic marine ecosystems around the circumpolar Arctic. SAMBR highlighted observed changes and relevant monitoring gaps using data compiled through 2015. In 2021 an update was provided on the status of seabirds in circumpolar Arctic using data from 2016–2019. Most changes reflect access to improved population estimates, orimproved data for monitoring trends,independent of recognized trends in population size.
-
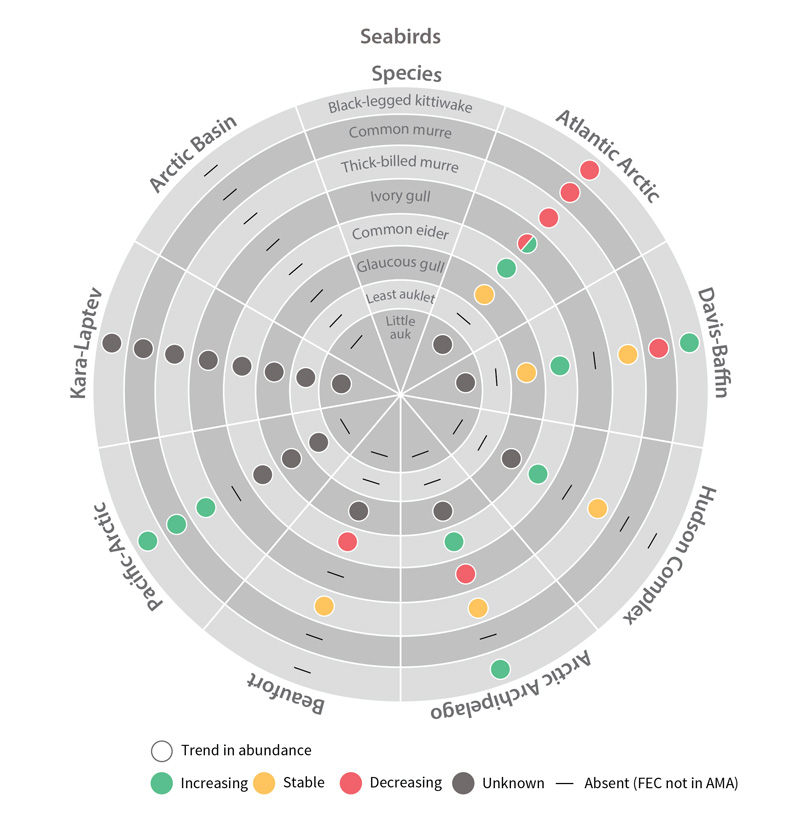
Trends in abundance of seabird Focal Ecosystem Components across each Arctic Marine Area. STATE OF THE ARCTIC MARINE BIODIVERSITY REPORT - Chapter 4 - Page 181 - Figure 4.5
-
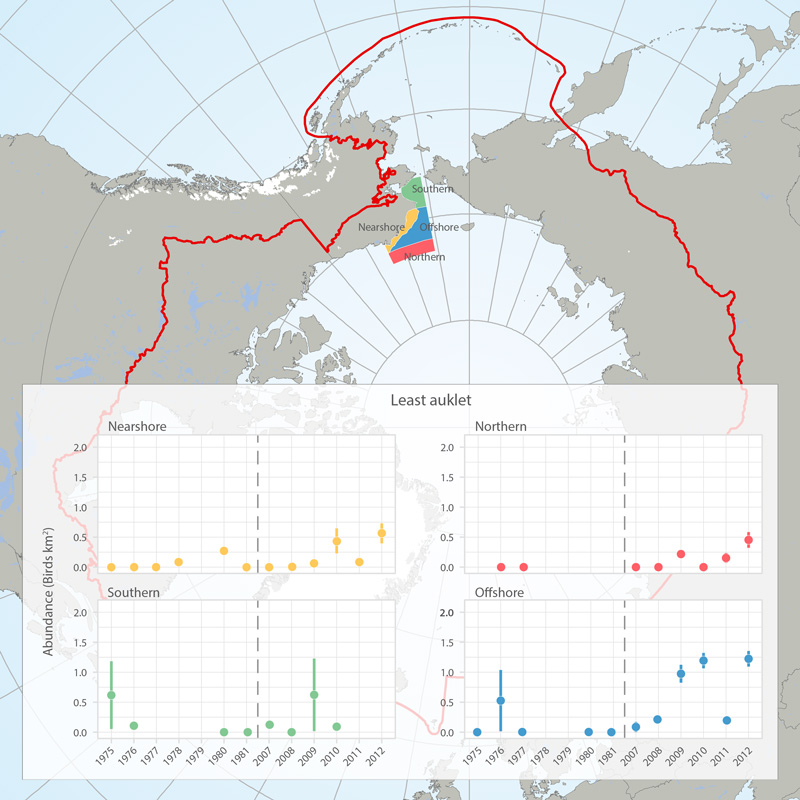
Abundance (birds/km2) of least auklets in four regions (see map) of the eastern Chukchi Sea, 1975-1981 and 2007-2012, based on at-sea surveys (archived in the North Pacific Pelagic Seabird Database). Figures provided by Adrian Gall, ABR, Inc. and reprinted with permission. STATE OF THE ARCTIC MARINE BIODIVERSITY REPORT - <a href="https://arcticbiodiversity.is/findings/seabirds" target="_blank">Chapter 3</a> - Page 138 - Box fig. 3.5.1 The shapefile outlines 4 regions of the eastern Chukchi Sea that were surveyed for seabirds during the open-water seasons of 1976-2012. We compared the density of seabirds in these regions among two time periods (1975-1981 and 2008-2012) to assess changes in seabird abundance over the past 4 decades. We also include a figure showing abundance of Least Auklets 1975-2012. Data are from the North Pacific Pelagic Seabird Database, maintained by the USGS (http://alaska.usgs.gov/science/biology/nppsd/index.php).
-
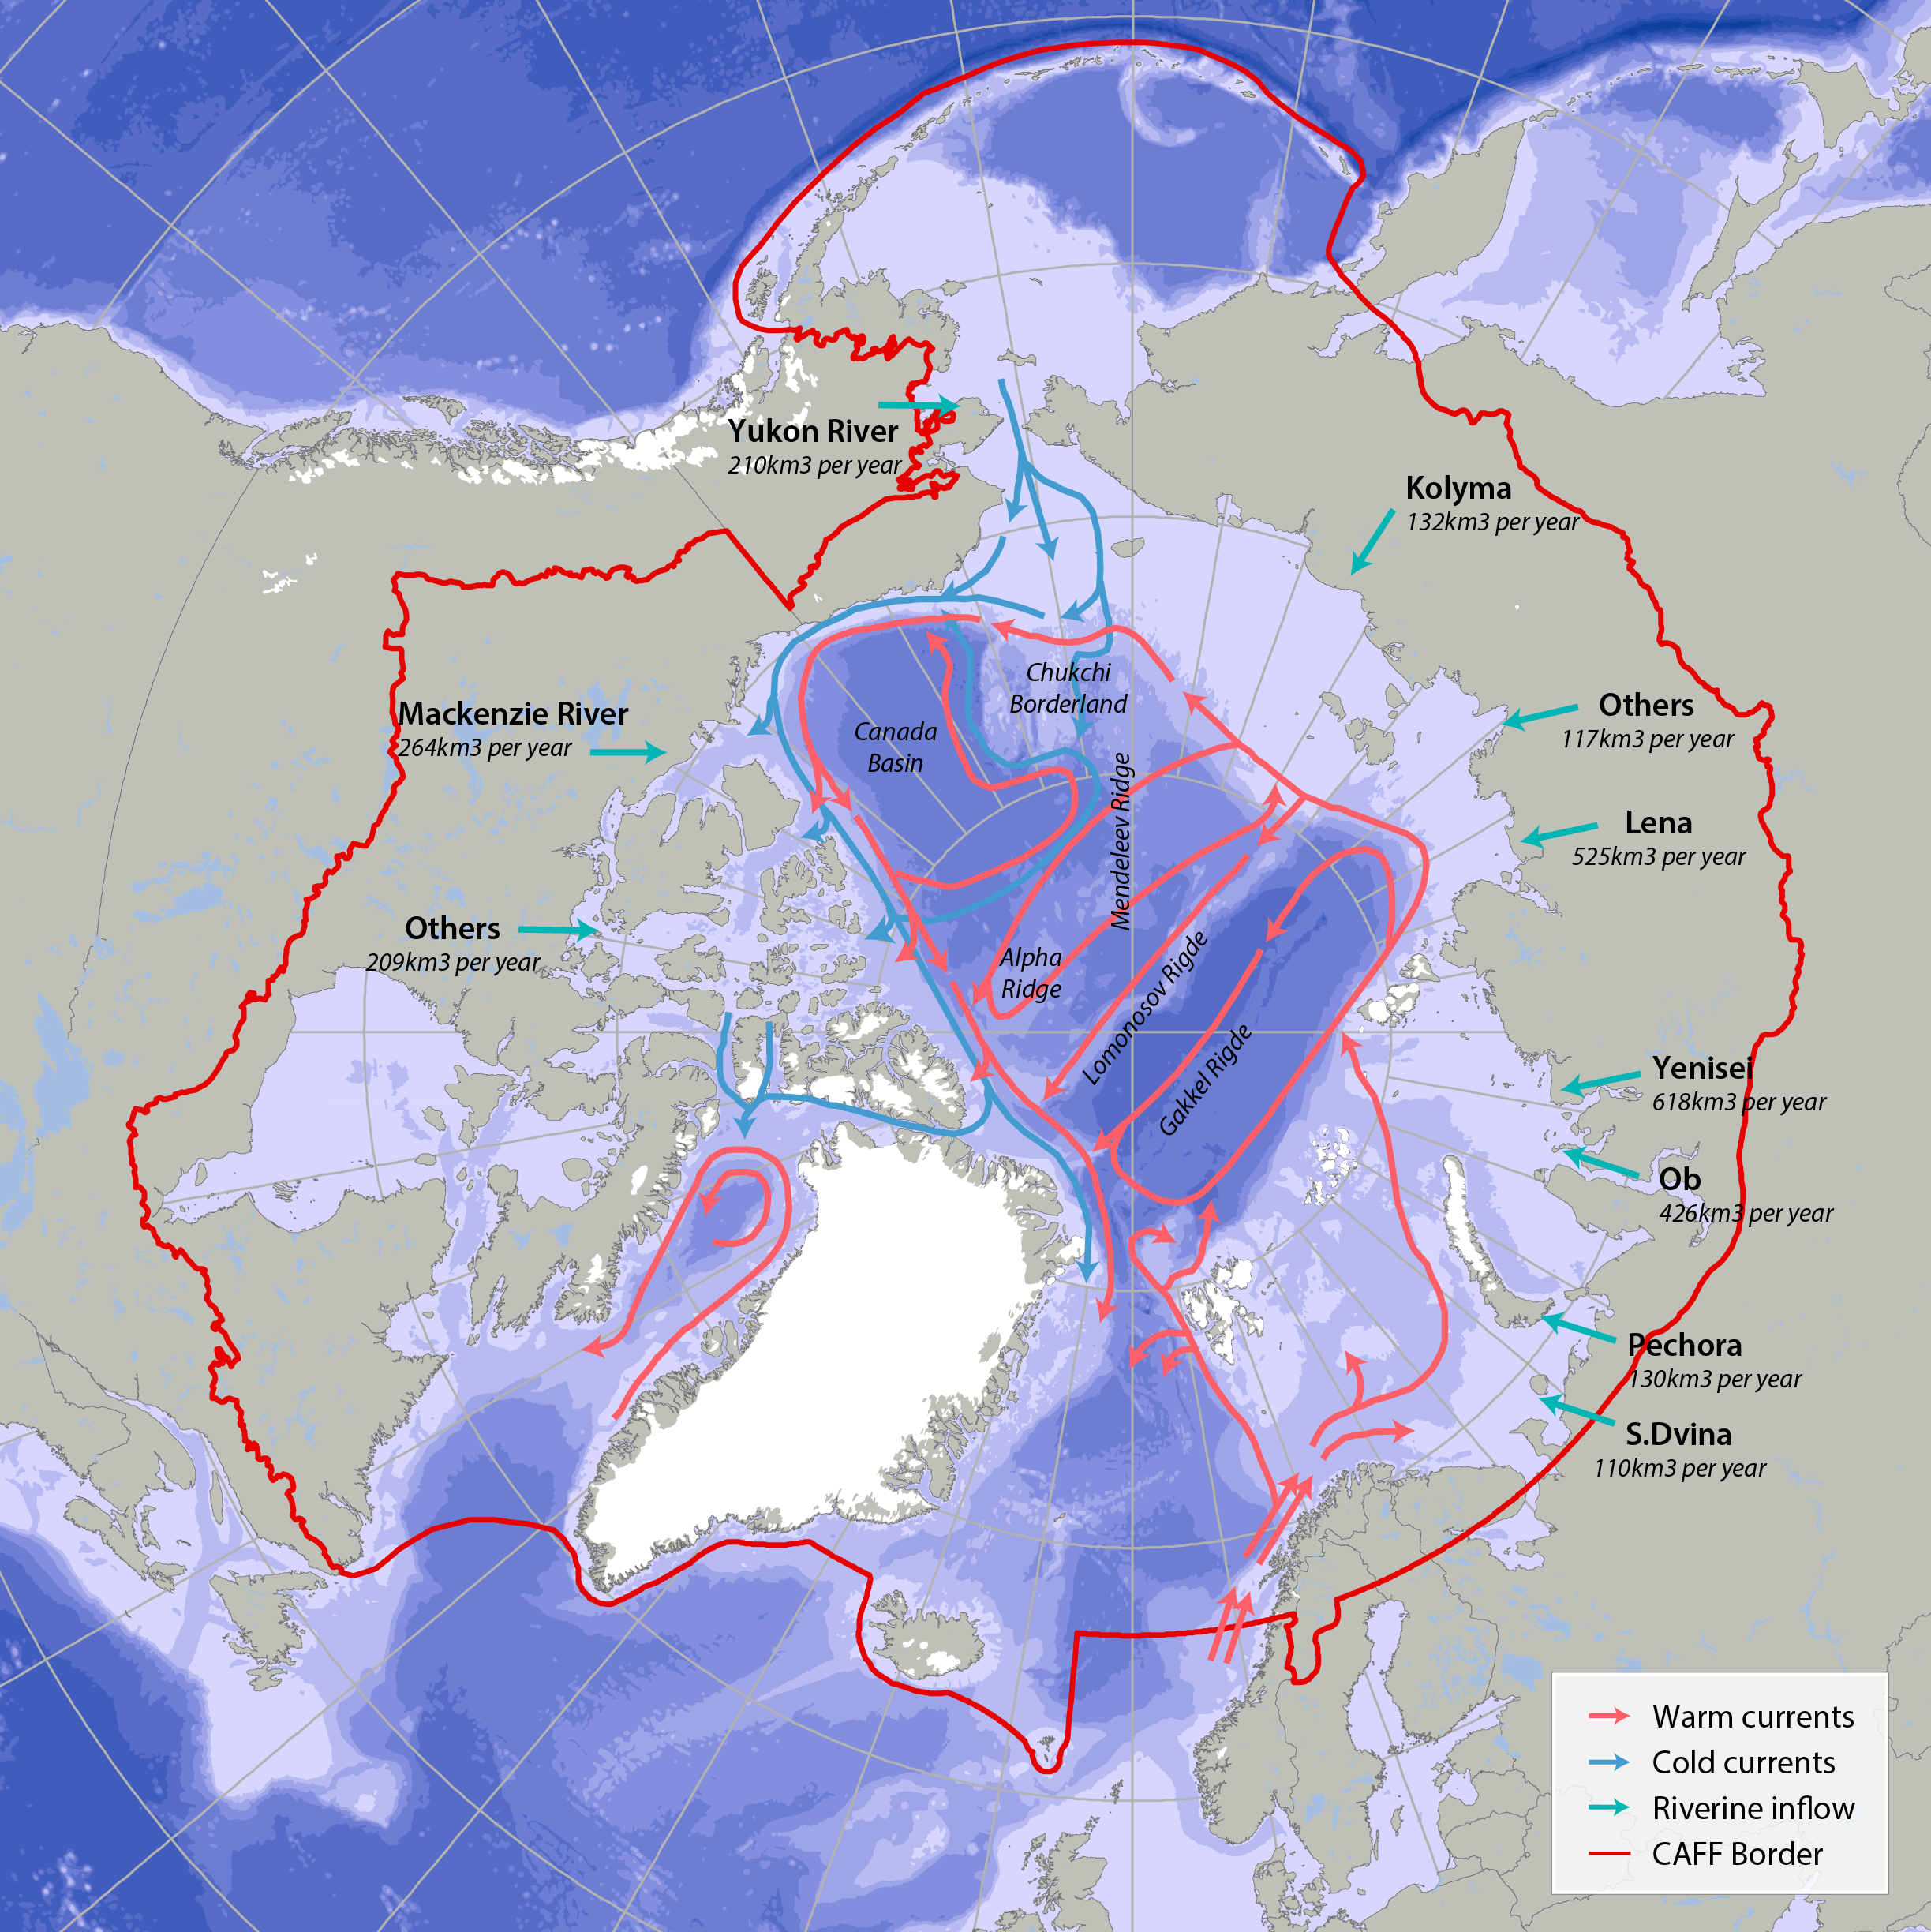
Bathymetric features, warm currents (red arrows), cold currents (blue arrows) and riverine inflow in the Arctic. Adapted from Jakobsen et al. (2012). Simplified Arctic Ocean currents (Fig. 2.1) show that the main circulation patterns follow the continental shelf breaks and margins of the basins in the Arctic Ocean. Different global models predict different types of changes, which can cause changes to Arctic ecosystems (AMAP 2013, Meltofte 2013). STATE OF THE ARCTIC MARINE BIODIVERSITY REPORT - <a href="https://arcticbiodiversity.is/marine" target="_blank">Chapter 2</a> - Page 22 - Figure 2.1
-
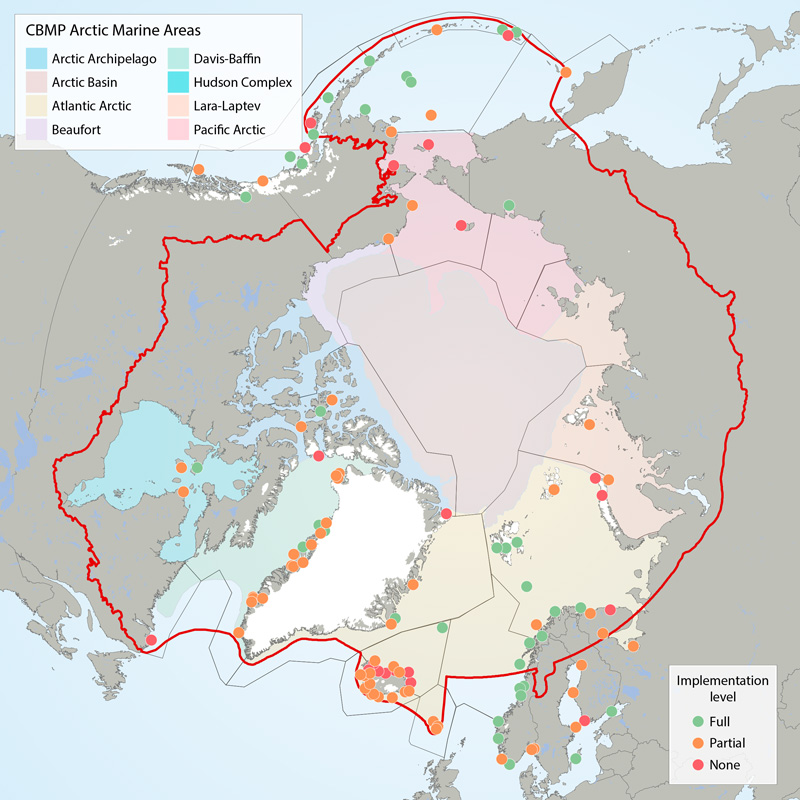
Boundaries of the 22 ecoregions (grey lines) as defined in the CSMP (Irons et al. 2015) and the Arctic Marine Areas (colored polygons with names in legend). Filled circles show locations of seabird colony sites recommended for monitoring (‘key sites’). The current level of monitoring plan implementation are green = fully implemented, amber = partially implemented, red = not implemented. The CSMP provides implementation maps for each forage guild. STATE OF THE ARCTIC MARINE BIODIVERSITY REPORT - <a href="https://arcticbiodiversity.is/findings/seabirds" target="_blank">Chapter 3</a> - Page 132 - Figure 3.5.1 This graphic displays the status of seabird monitoring at key sites in CBMP areas across the Arctic.
 CAFF - Arctic Biodiversity Data Service (ABDS)