 CAFF - Arctic Biodiversity Data Service (ABDS)
inlandWaters
Type of resources
Available actions
Topics
Keywords
Contact for the resource
Provided by
Representation types
Update frequencies
status
-
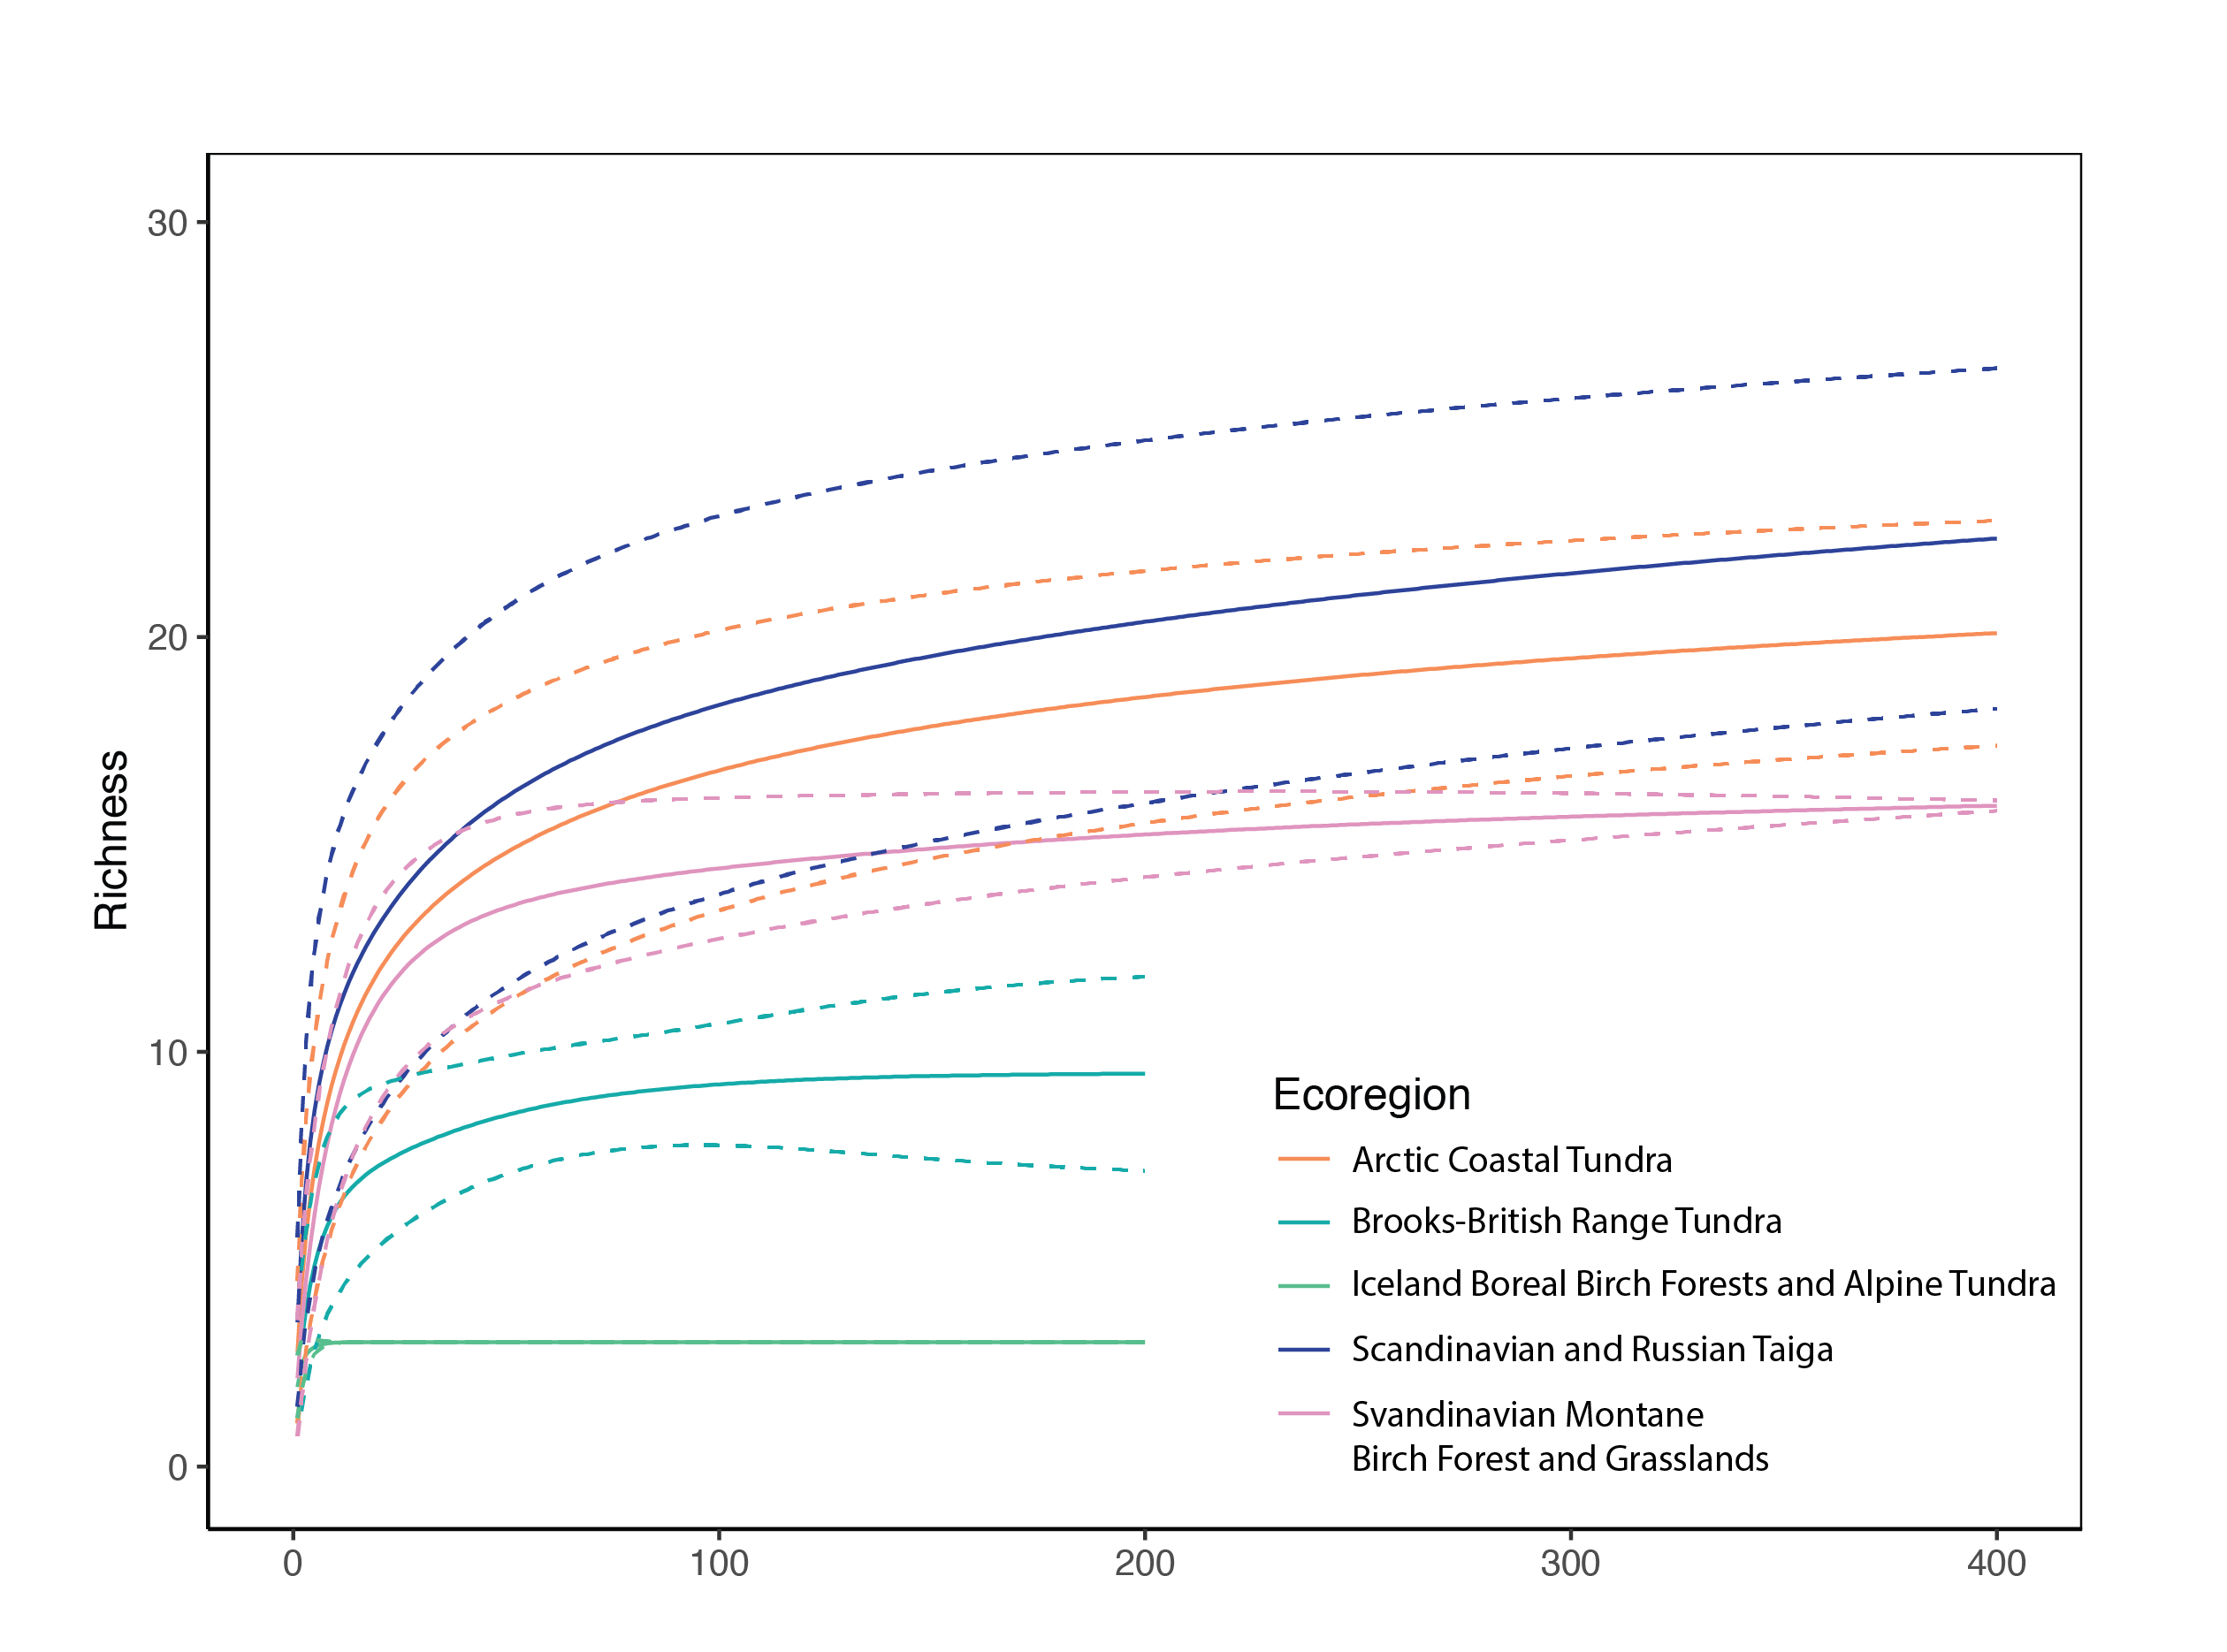
Provides richness estimates and 95% confidence bounds for five ecoregions. State of the Arctic Freshwater Biodiversity Report - Chapter 4 - Page 77 - Figure 4-38
-

Figure 4 17 Results of circumpolar assessment of lake phytoplankton,(a) the location of phytoplankton stations, underlain by circumpolar ecoregions; (b) ecoregions with many phytoplankton stations, colored on the basis of alpha diversity rarefied to 35 stations; (c) all ecoregions with phytoplankton stations, colored on the basis of alpha diversity rarefied to 10 stations; (d) ecoregions with at least two stations in a hydrobasin, colored on the basis of the dominant component of beta diversity (species turnover, nestedness, approximately equal contribution, or no diversity) when averaged across hydrobasins in each ecoregion. State of the Arctic Freshwater Biodiversity Report - Chapter 4 - Page 56 - Figure 4-17
-
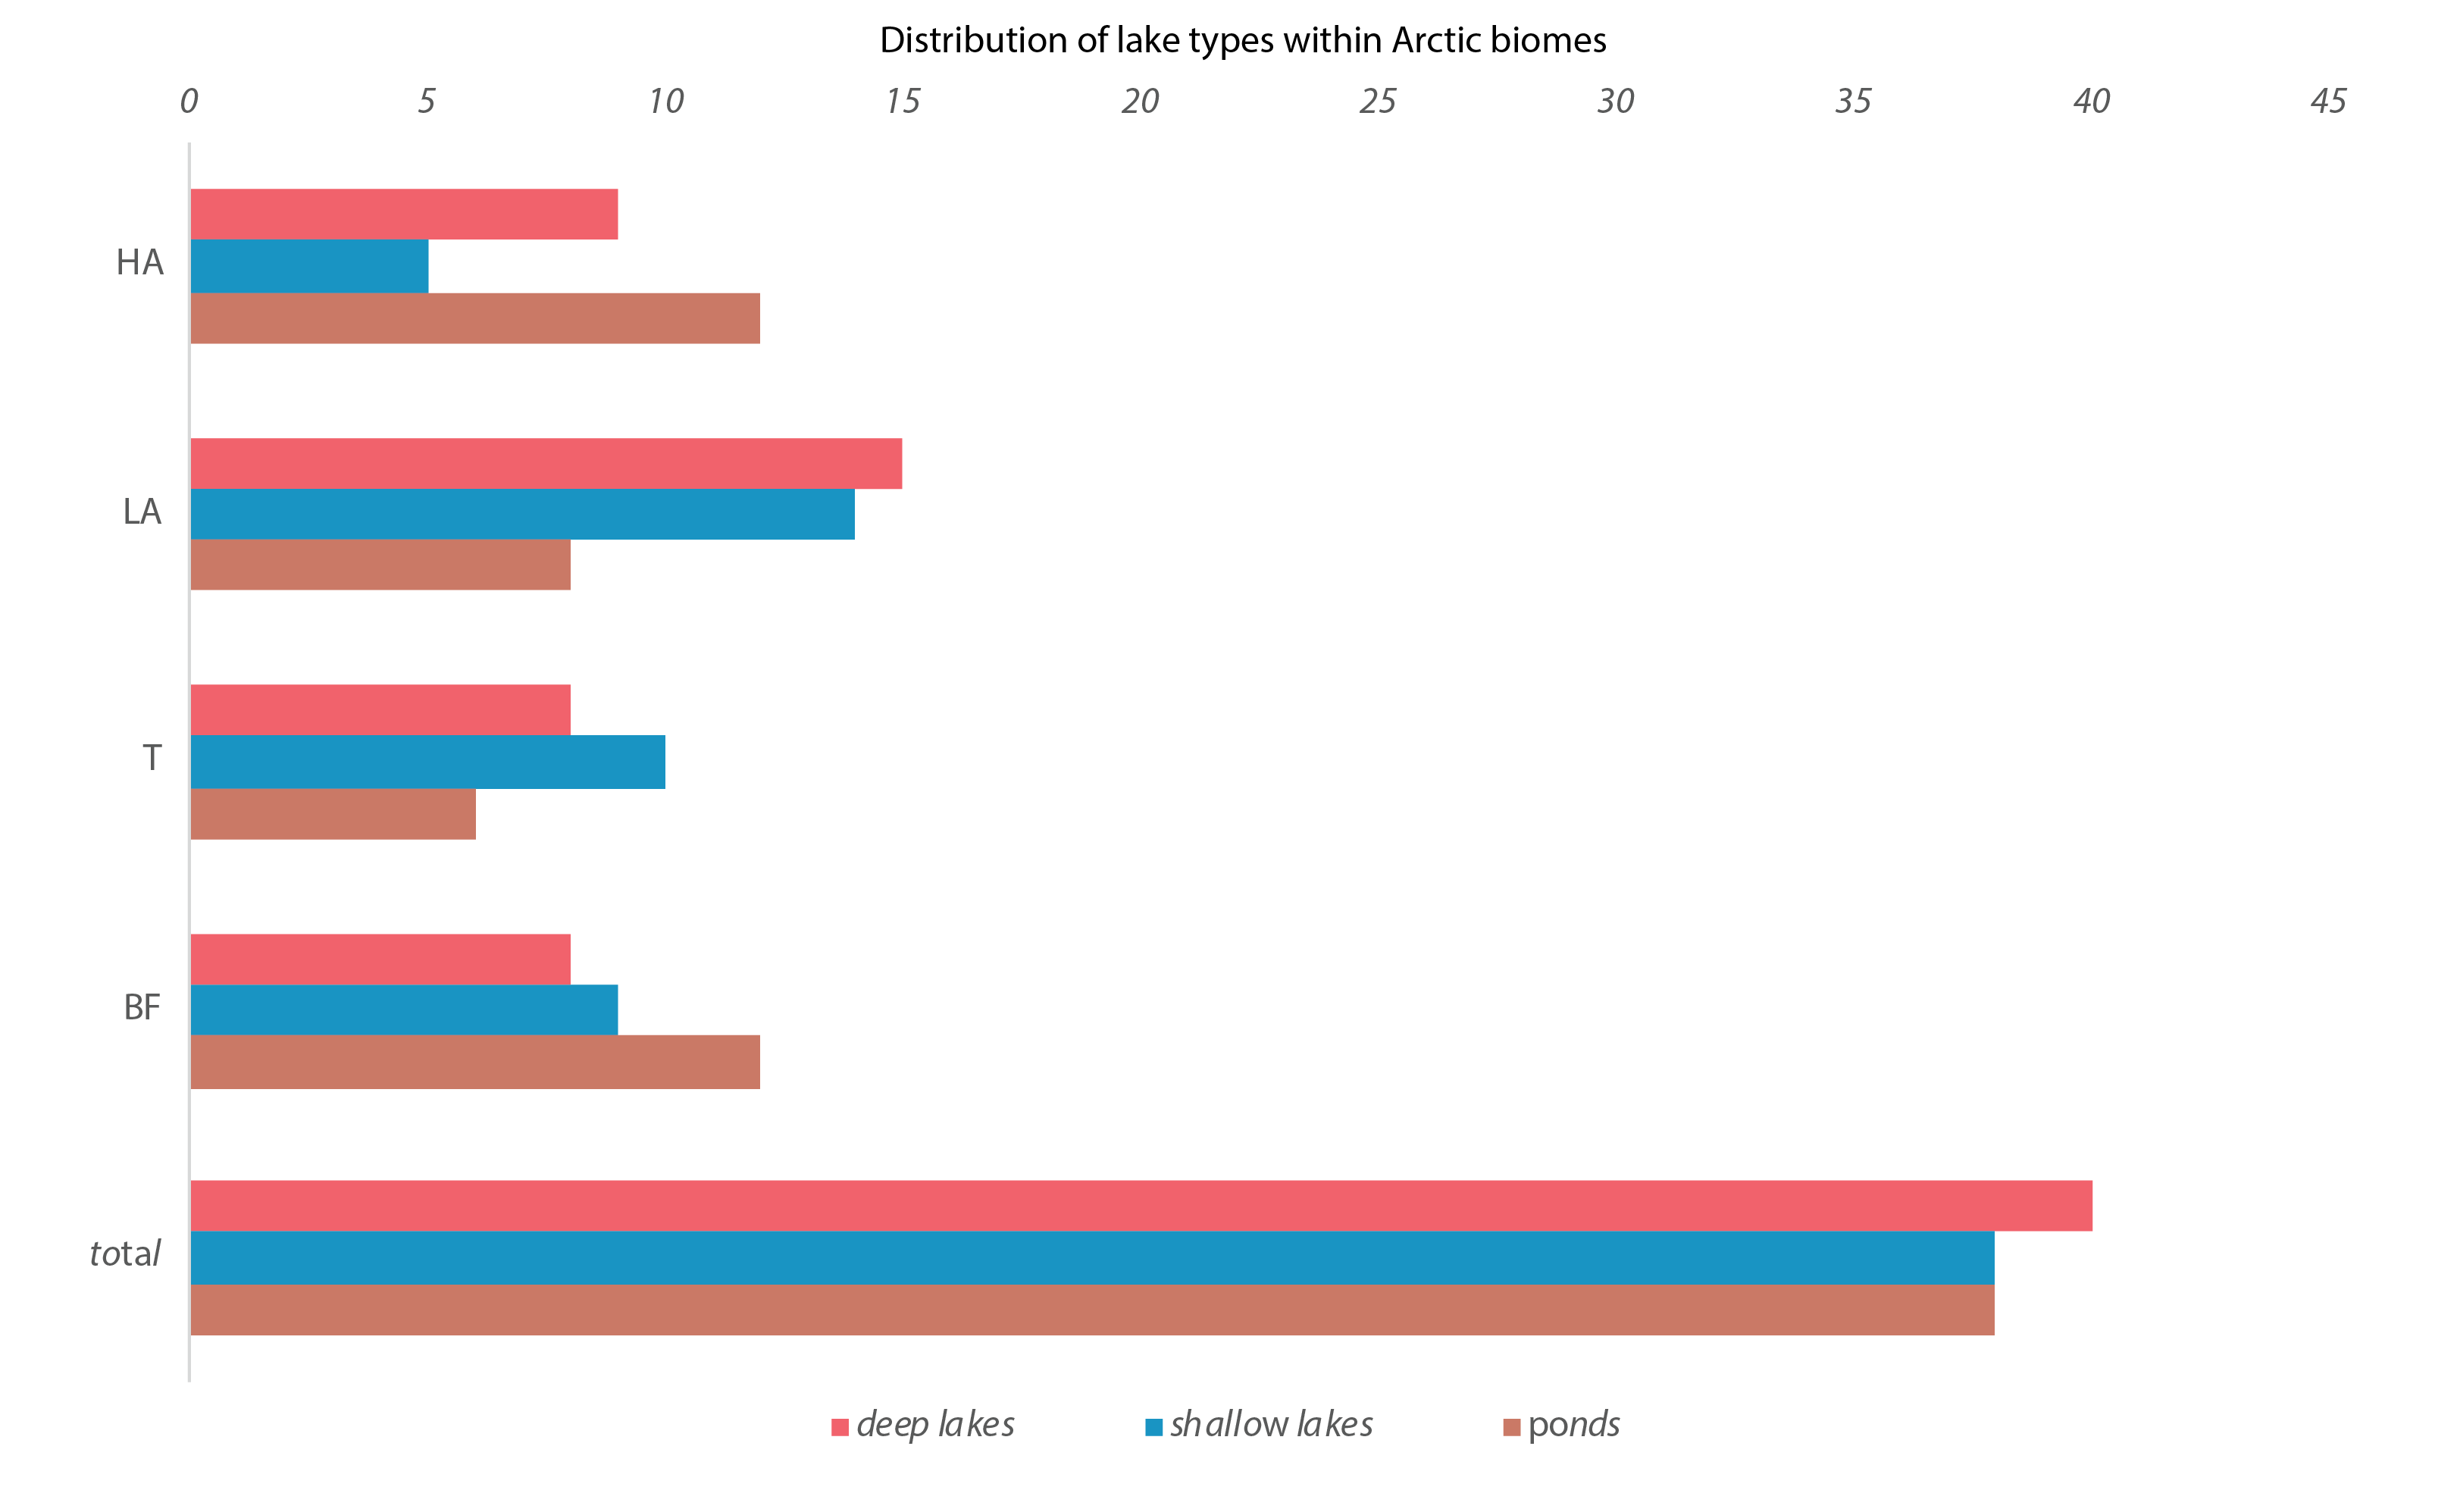
Figure 4-13 Number of deep lakes (red), shallow lakes (blue), and ponds (brown) in each geographical zone (BF, T, LA, HA). BF = Boreal Forest, T =Transition Zone, LA = Low Arctic, HA = High Arctic. State of the Arctic Freshwater Biodiversity Report - Chapter 4 - Page 40 - Figure 4-13
-
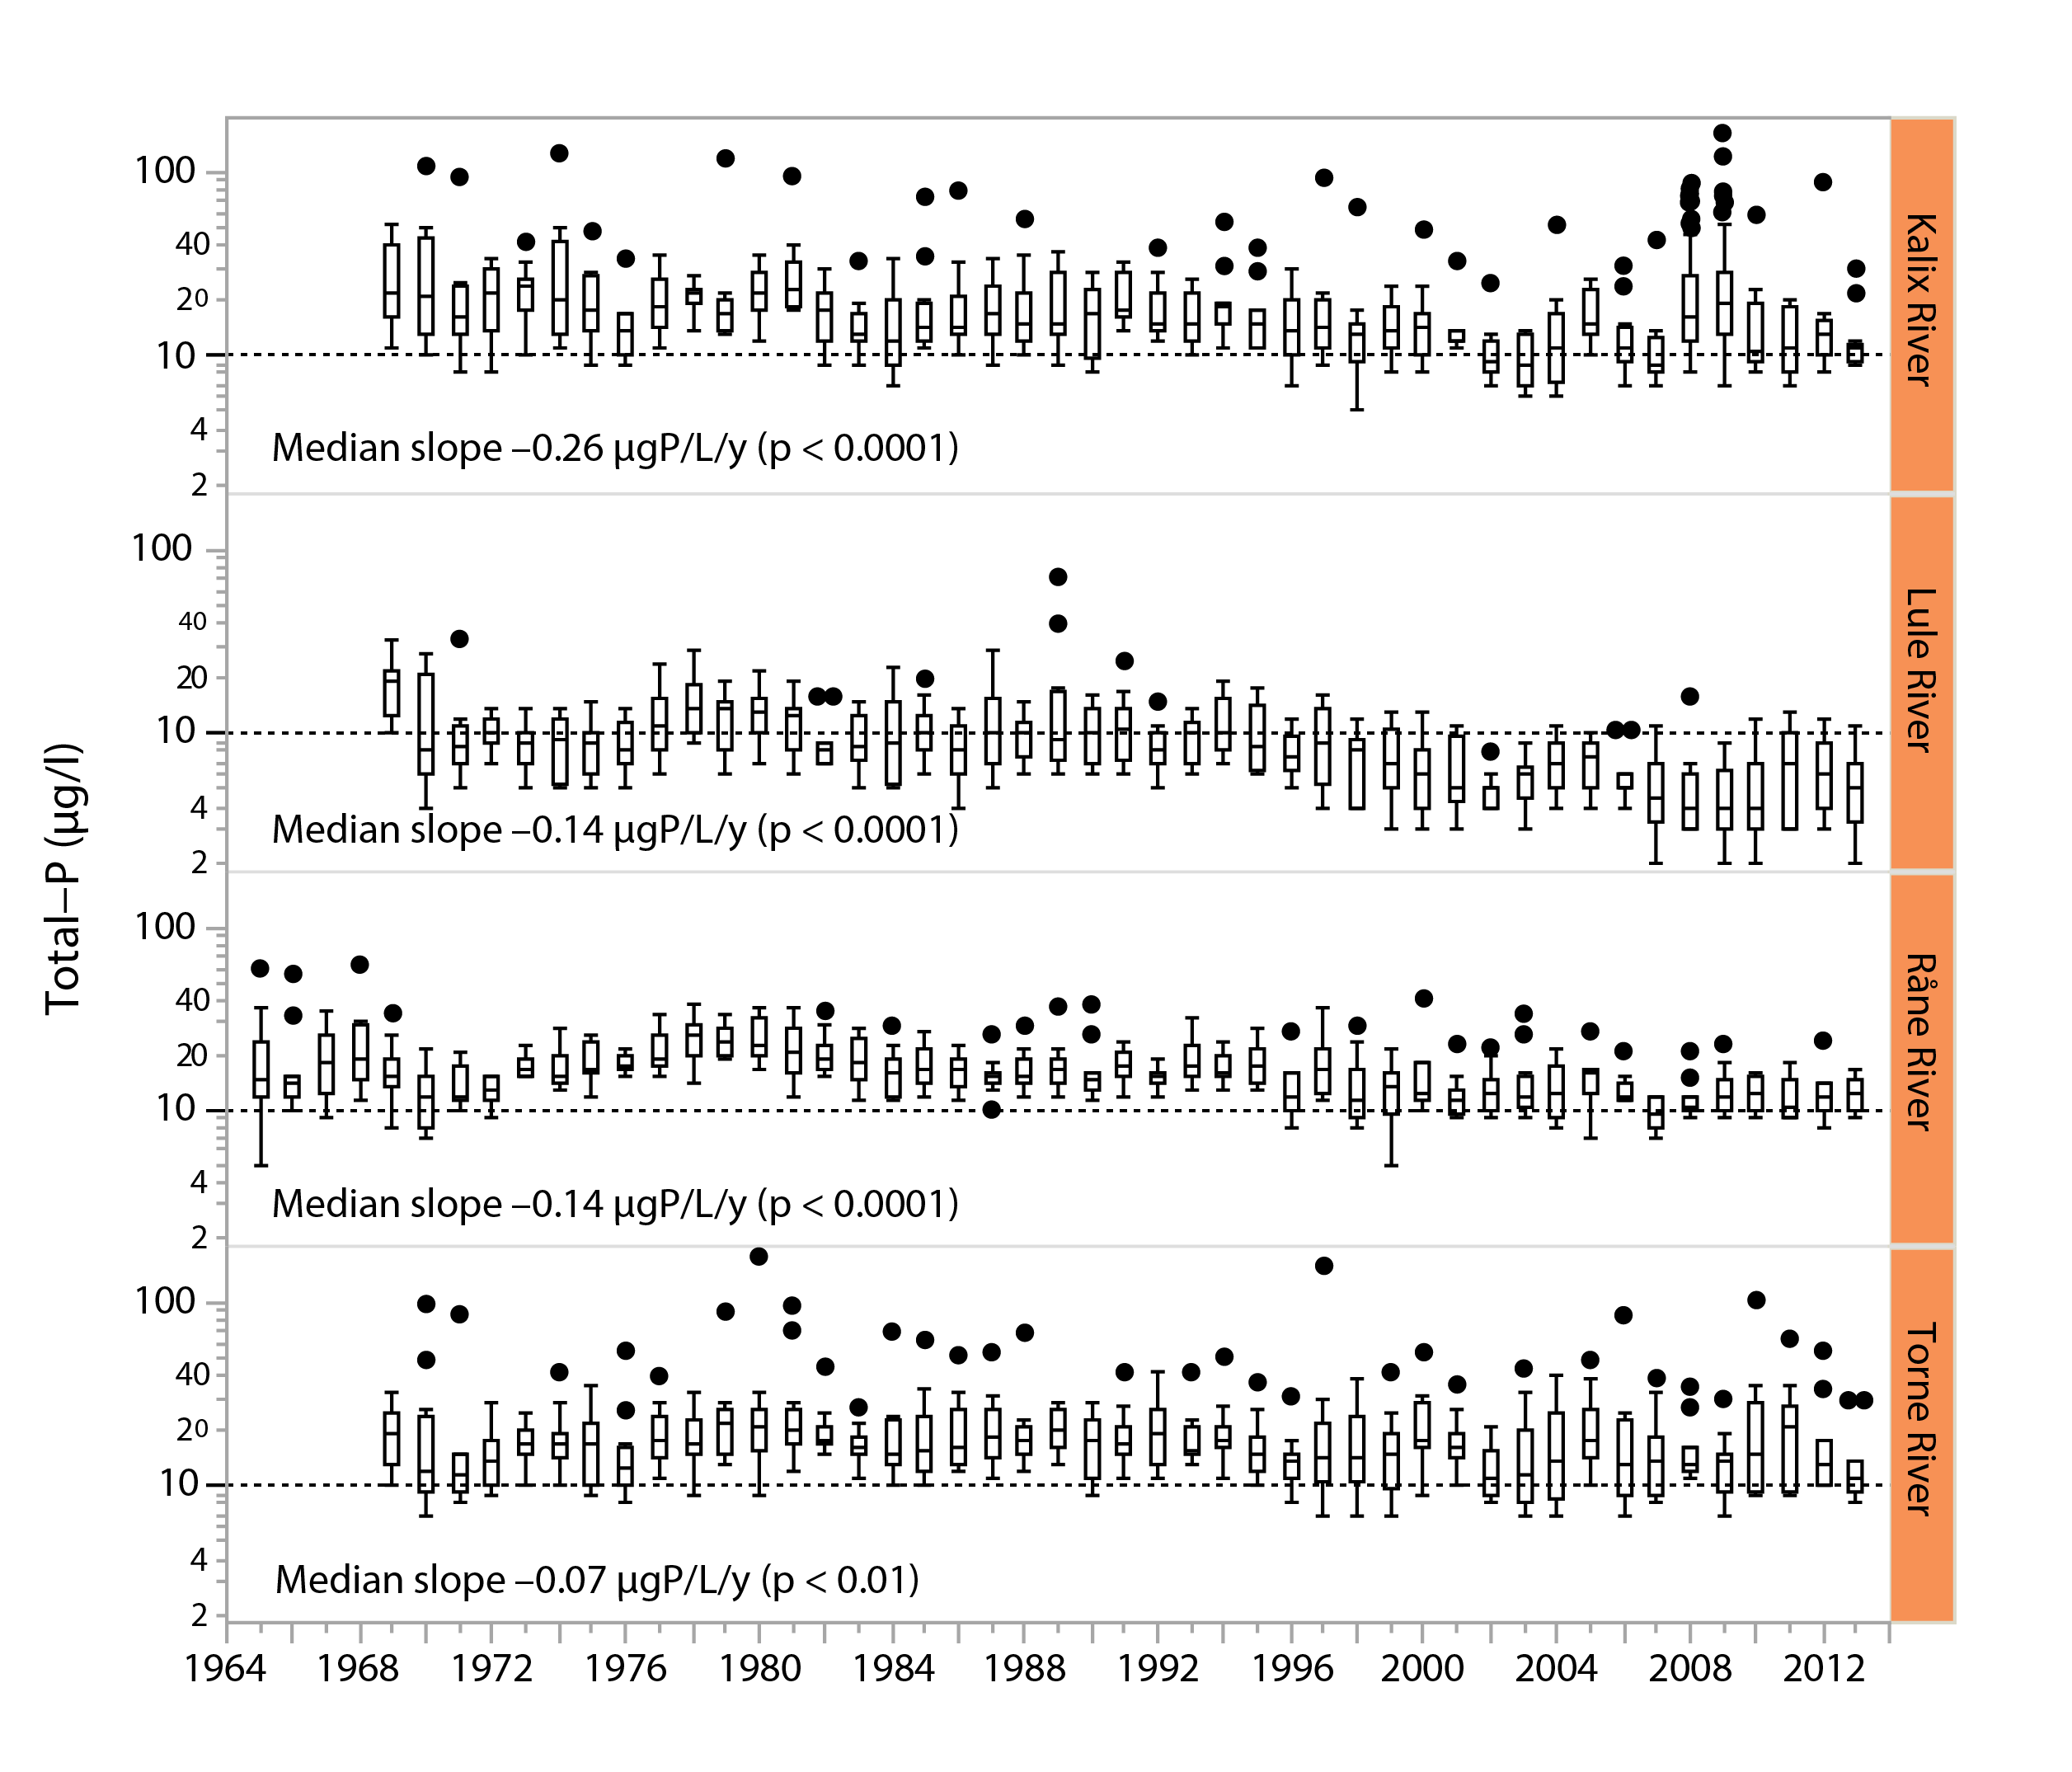
Figure 3-3 Long-term trends in total phosphorus water concentrations (μg/L) in four major, unregulated rivers that drain the subarctic Arctic/alpine ecoregion of the Scandinavian peninsula, the Kalix river, The Lule river, the Råne river, and the Torne river. Slopes and p-values are given in the different panels. Boxes indicate medians and 25th and 75th percentiles, while whiskers give the 10th and 90th percentiles. State of the Arctic Freshwater Biodiversity Report - Chapter 3 - Page 21 - Figure 3-3
-
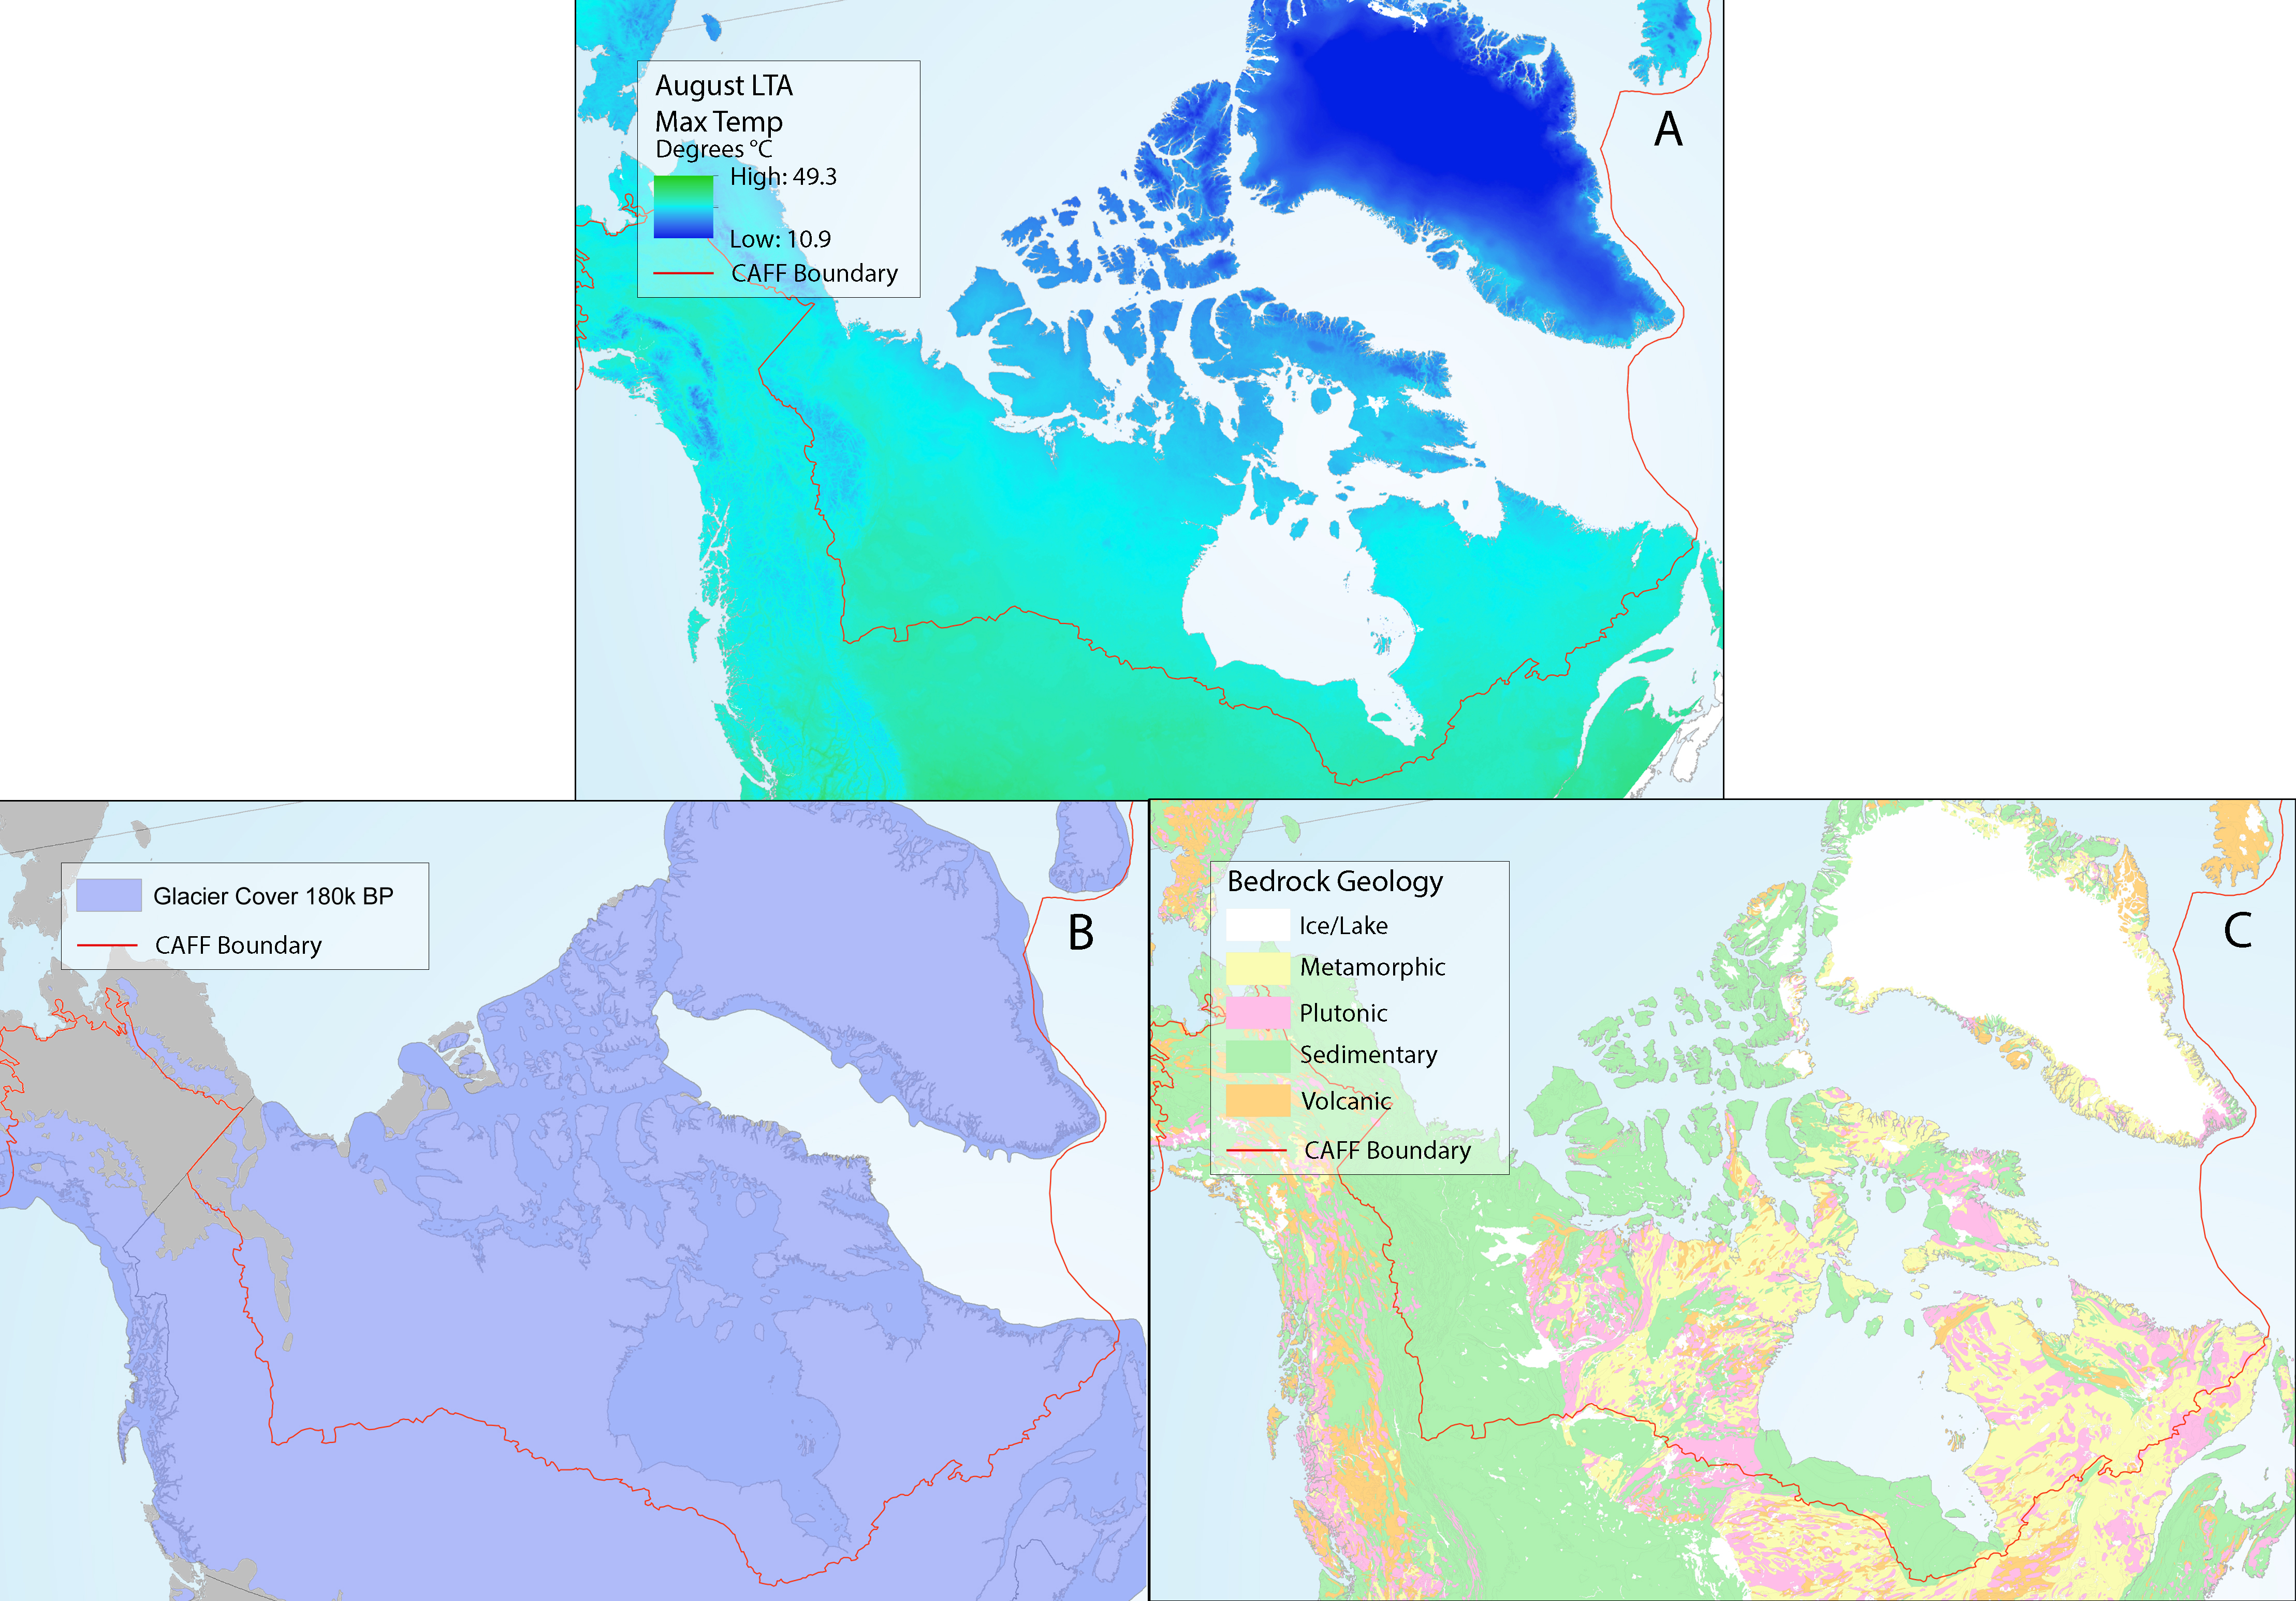
Abiotic drivers in North America, including (a) long-term average maximum August air temperature, (b) spatial distribution of ice sheets in the last glaciation of the North American Arctic region, and (c) geological setting of bedrock geology underlying North America. Panel (a) source Fick and Hijmans (2017). Panel (b) adapted from: Physical Geology by Steve Earle, freely available at http://open.bccampus.ca. Panel (c) source: Geogratis. State of the Arctic Freshwater Biodiversity Report - Chapter 5 - Page 86 - Figure 5-3
-
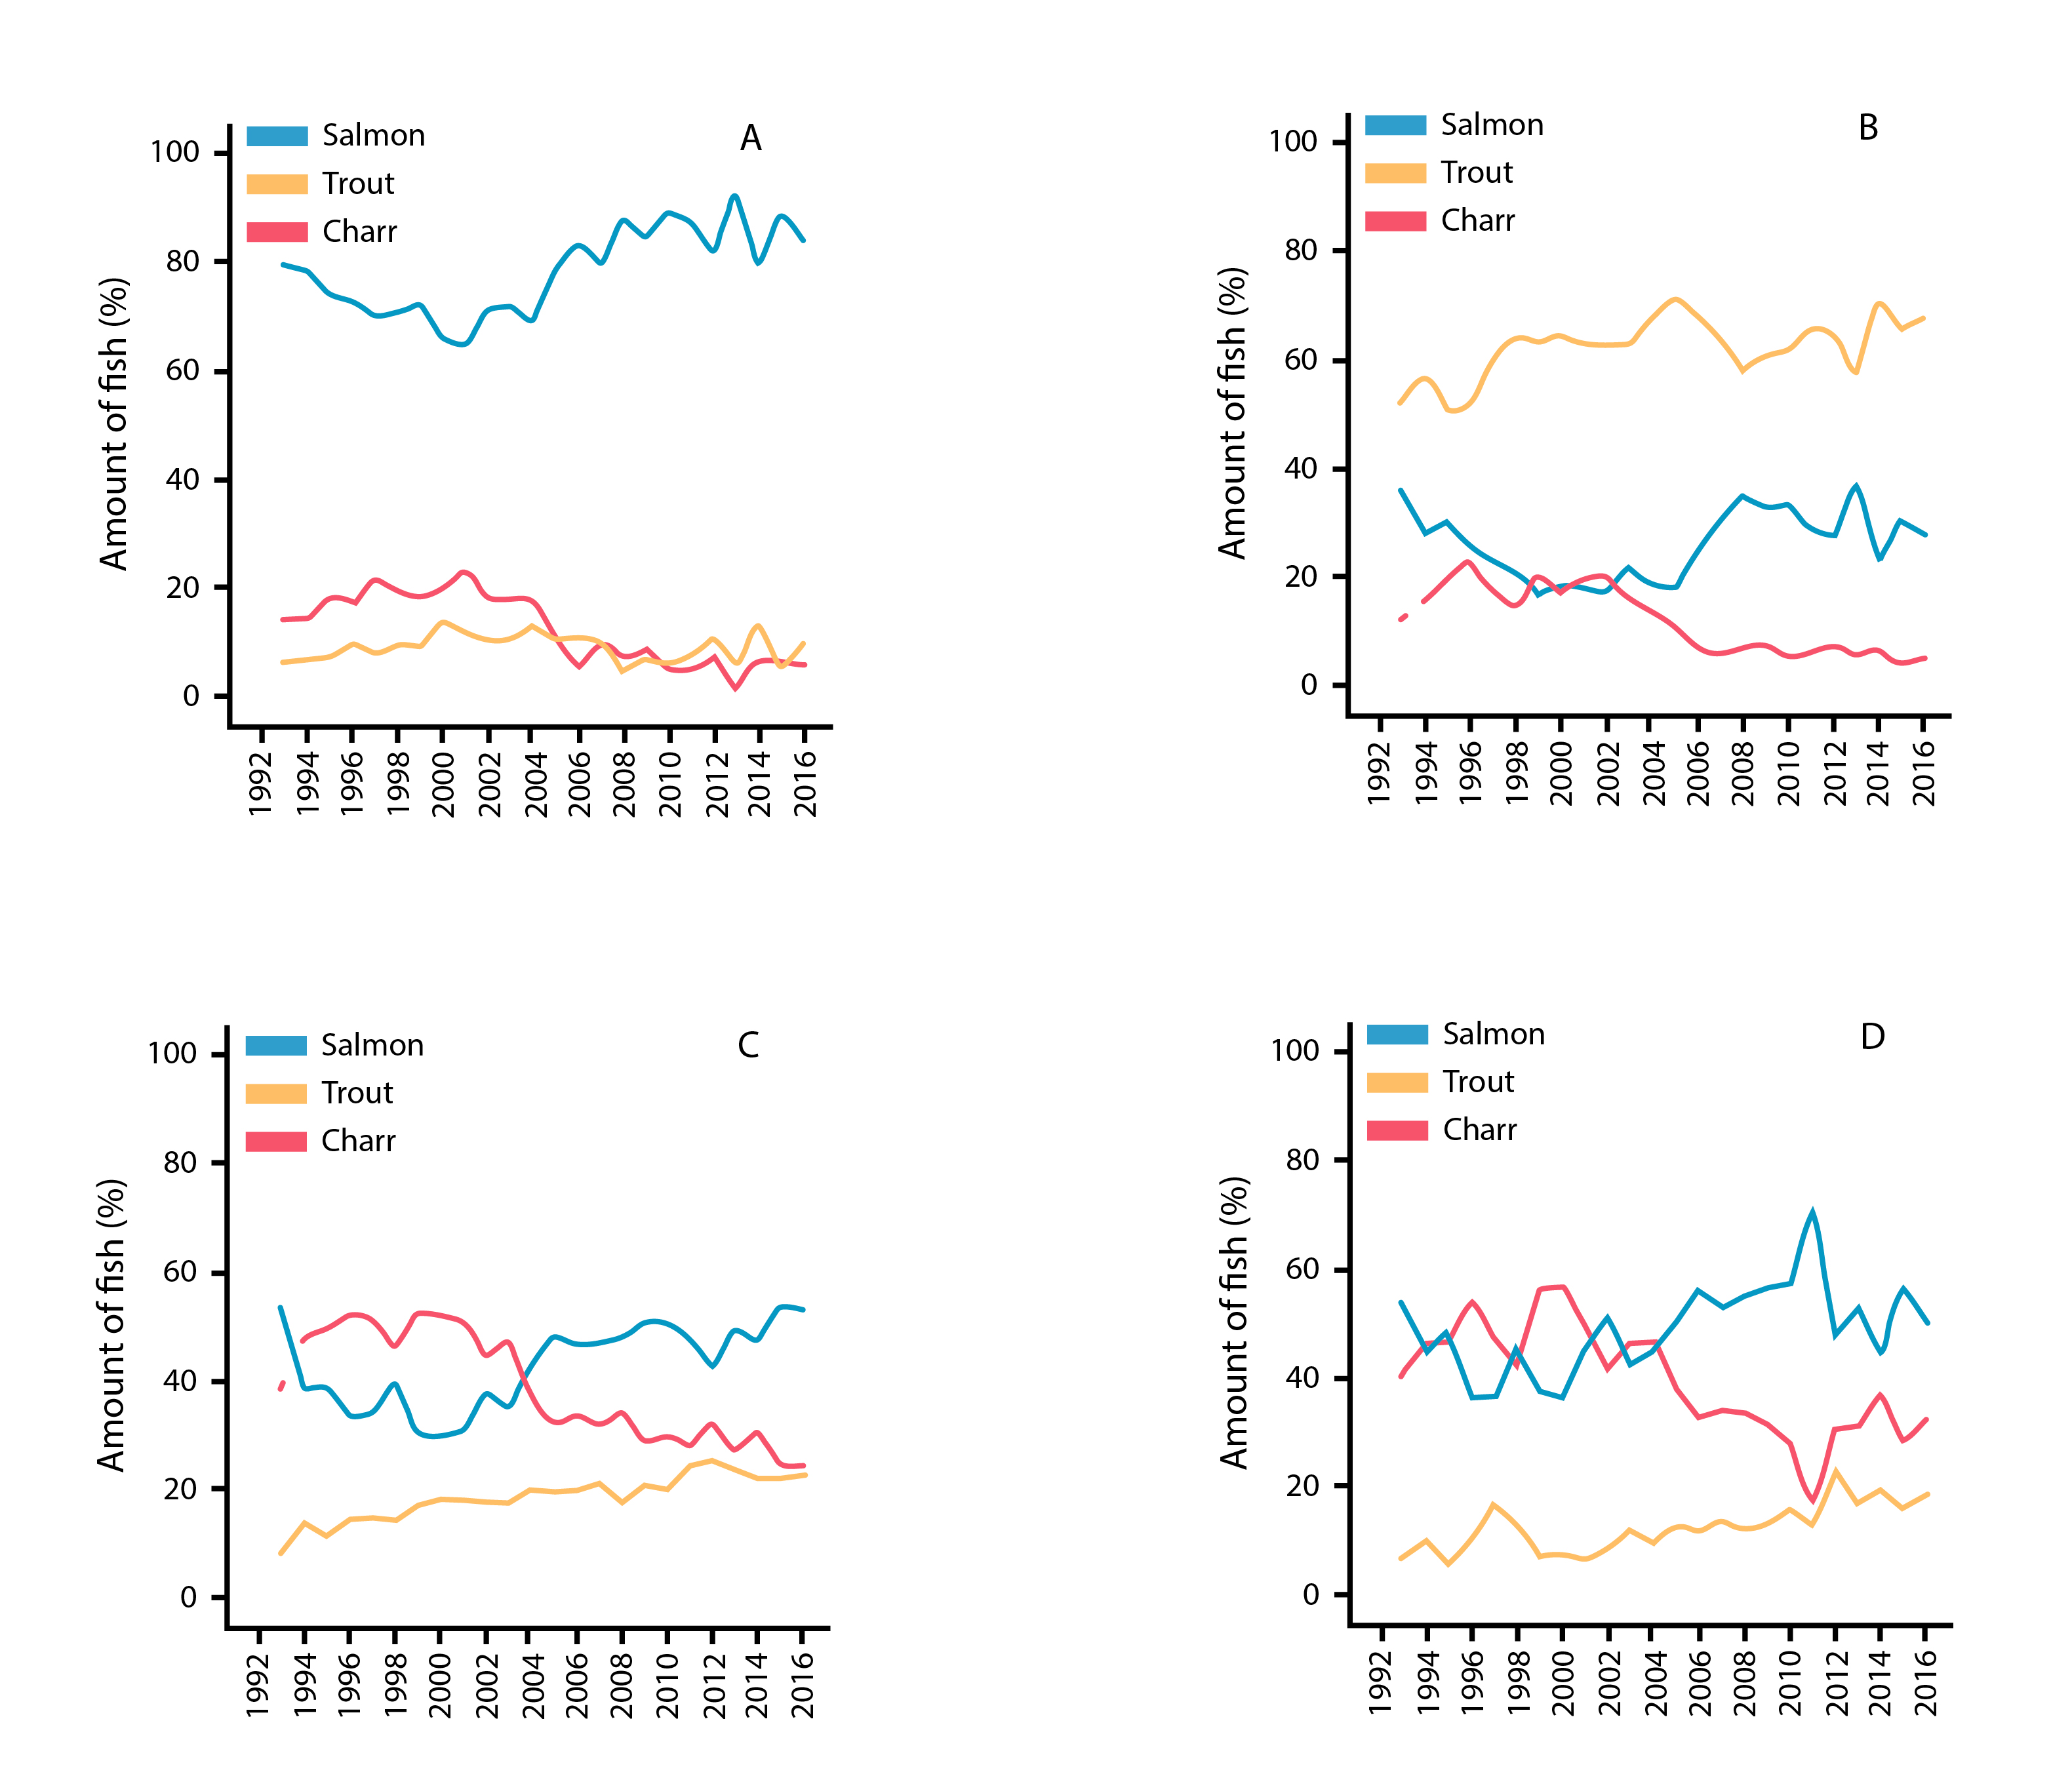
Temporal patterns in % abundance of Atlantic salmon, brown trout, and anadromous Arctic charr from catch statistics in Iceland rivers monitored from 1992 to 2016, showing results from (a) west, (b) south, (c) north, and (d) east Iceland. State of the Arctic Freshwater Biodiversity Report - Chapter 4 - Page 81 - Figure 4-41
-
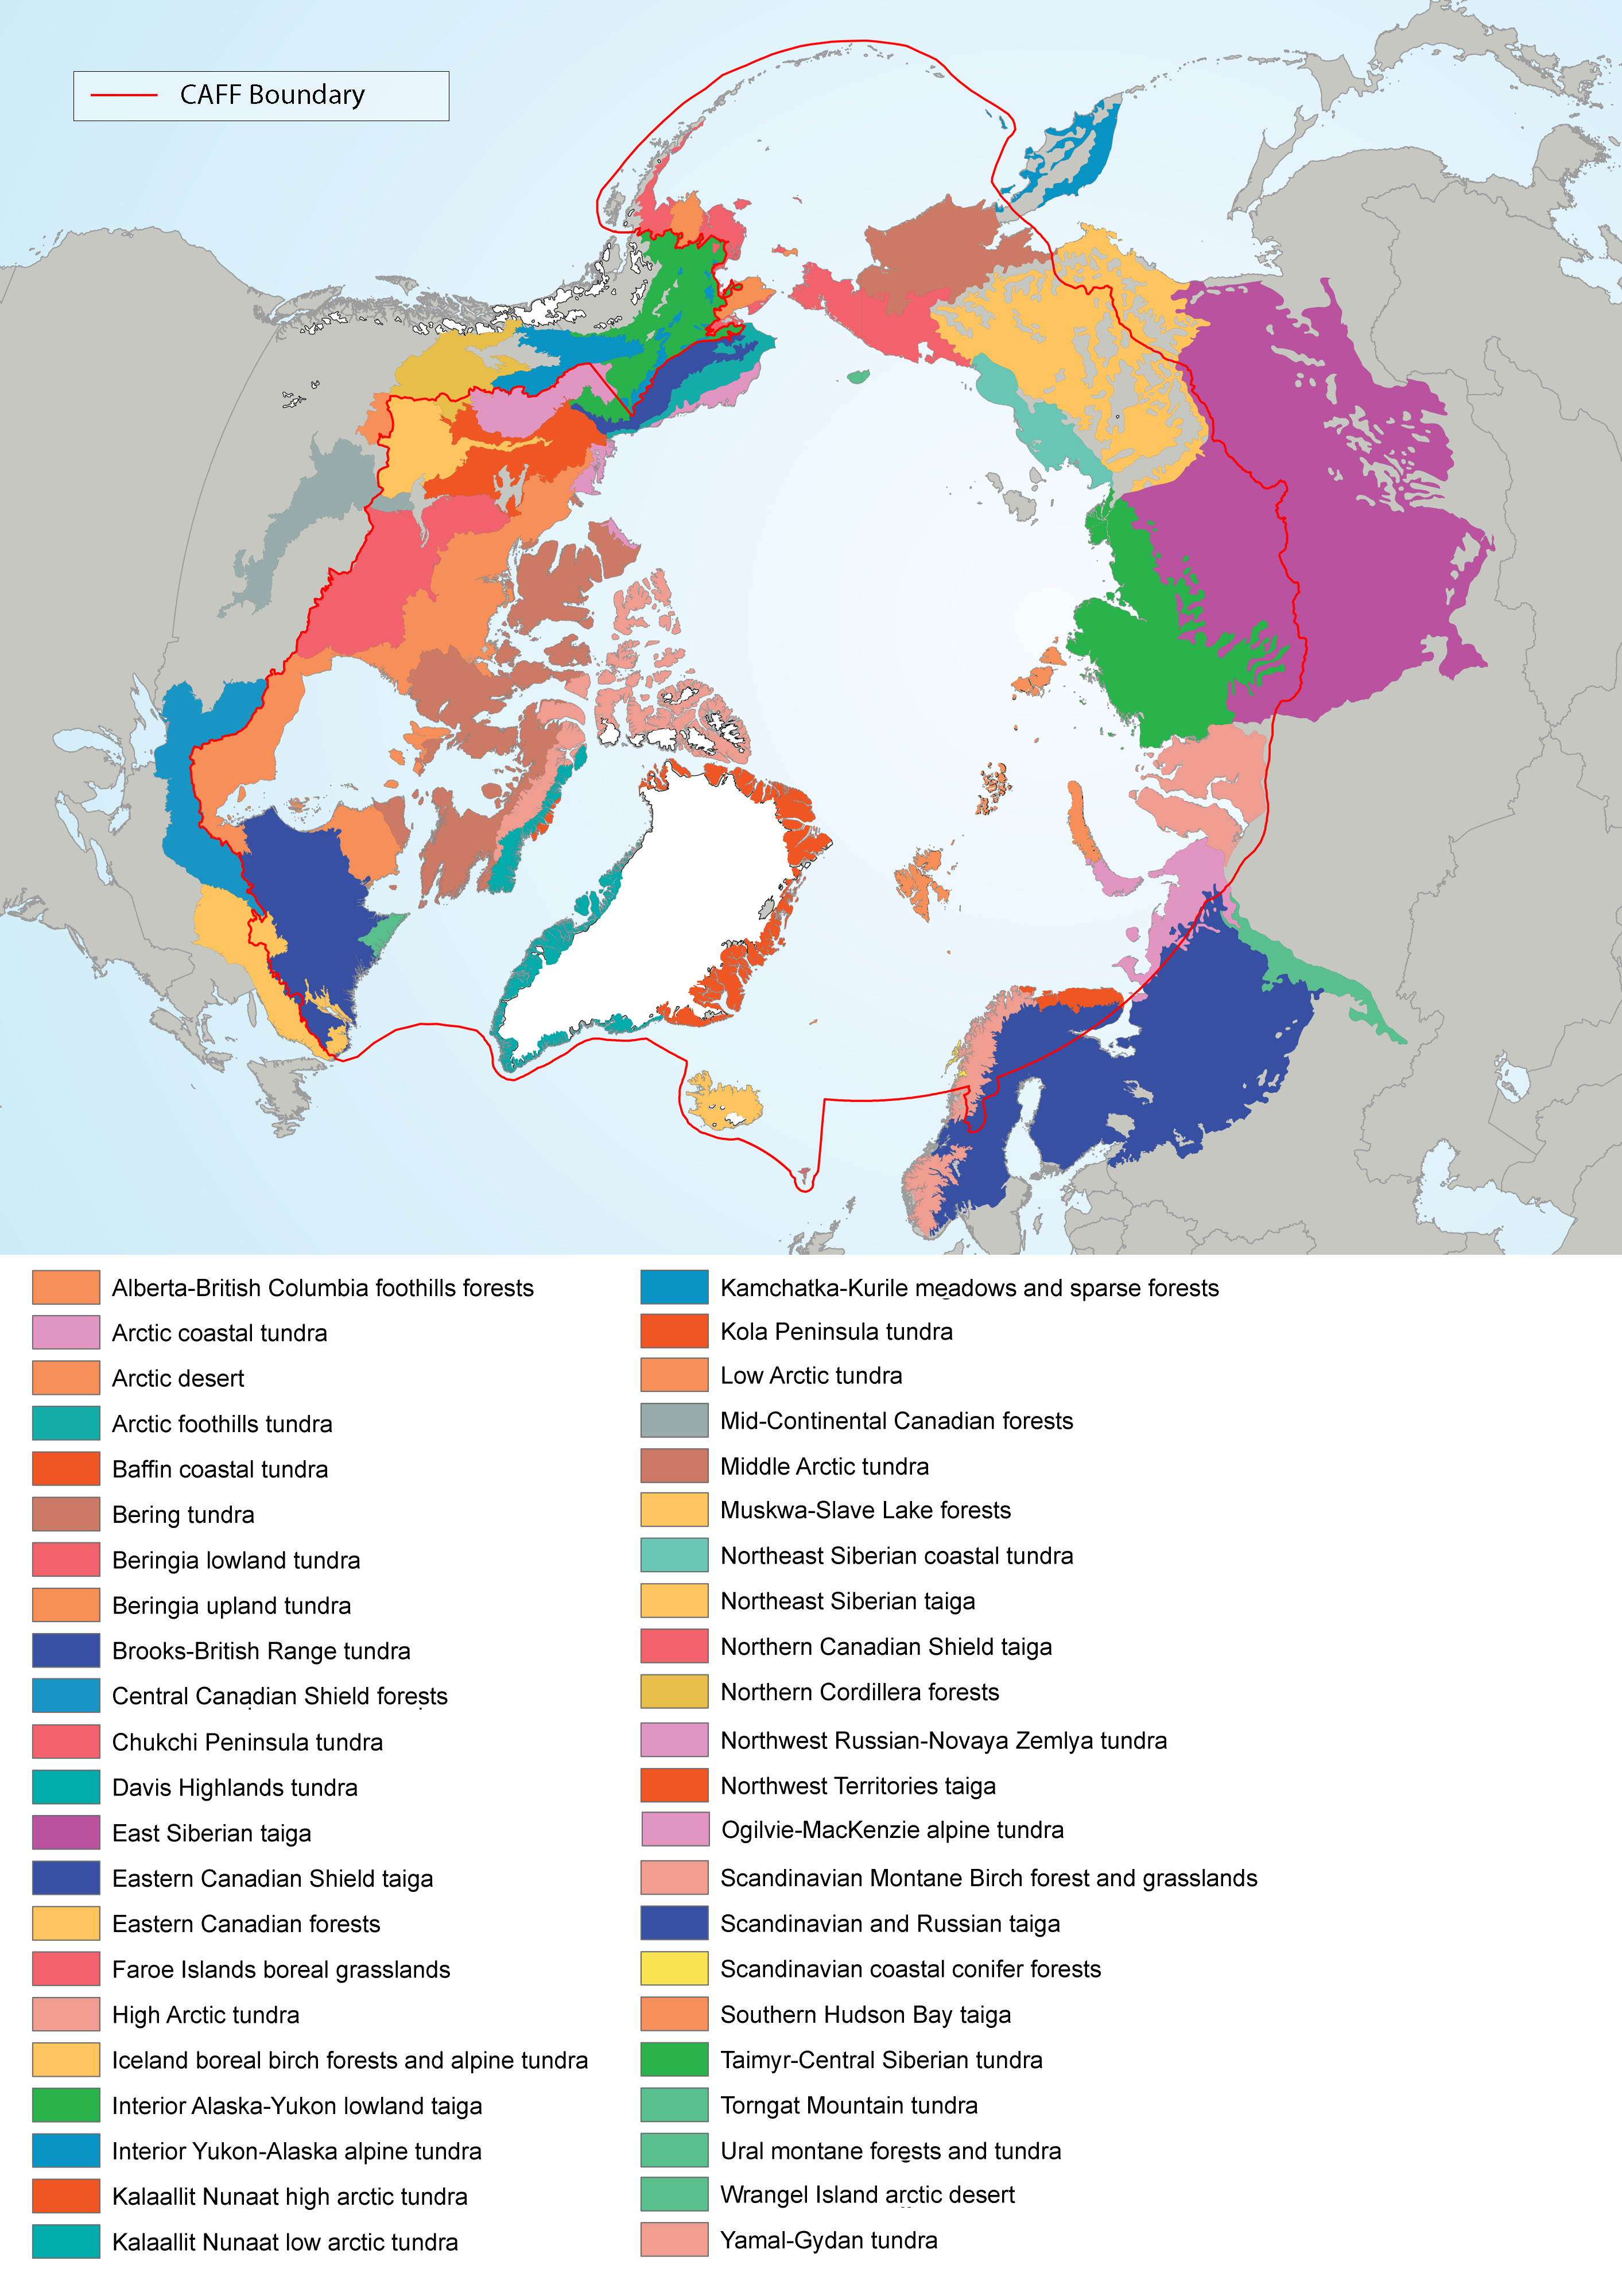
Figure 4-5 Terrestrial ecoregions that are included within the circumpolar region within the CAFF boundary and/or the ABA boundaries. Source: Terrestrial Ecoregions of the World (TEOW; Olson et al. 2001). State of the Arctic Freshwater Biodiversity Report - Chapter 4 - Page 28 - Figure 4-5
-
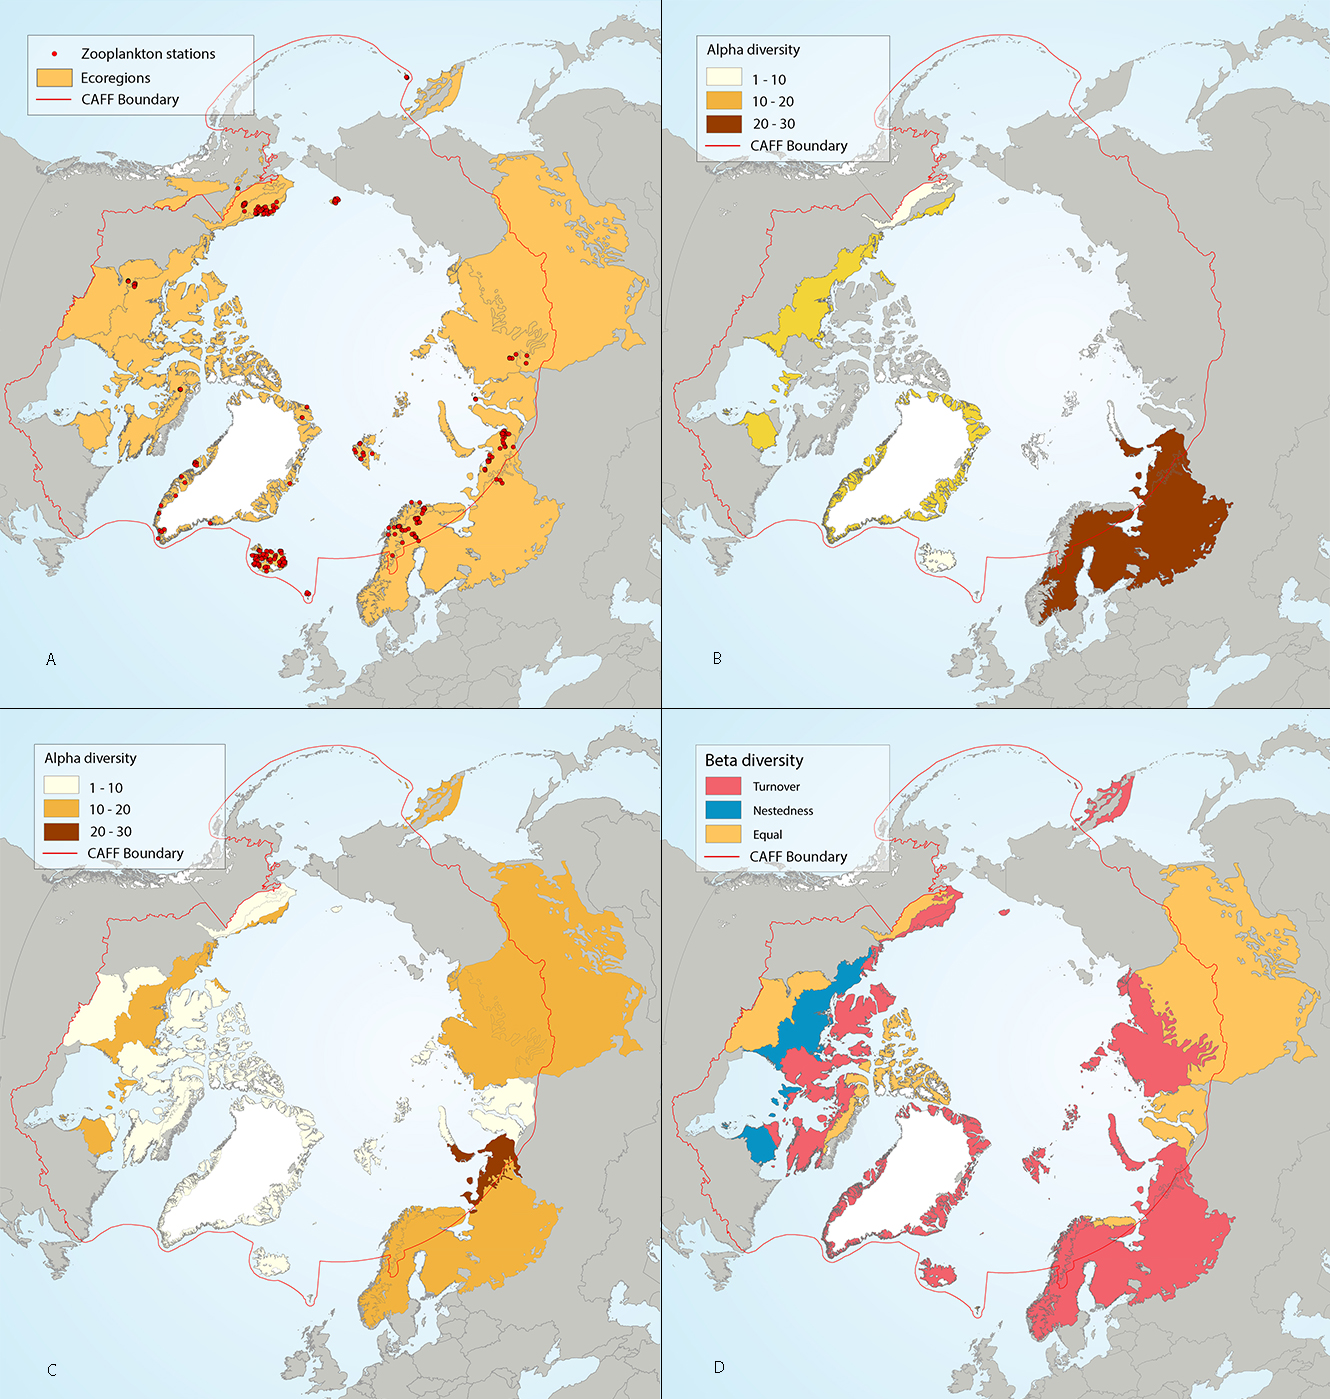
Results of circumpolar assessment of lake zooplankton, focused just on crustaceans, and indicating (a) the location of crustacean zooplankton stations, underlain by circumpolar ecoregions; (b) ecoregions with many crustacean zooplankton stations, colored on the basis of alpha diversity rarefied to 25 stations; (c) all ecoregions with crustacean zooplankton stations, colored on the basis of alpha diversity rarefied to 10 stations; (d) ecoregions with at least two stations in a hydrobasin, colored on the basis of the dominant component of beta diversity (species turnover, nestedness, approximately equal contribution, or no diversity) when averaged across hydrobasins in each ecoregion. State of the Arctic Freshwater Biodiversity Report - Chapter 4 - Page 58 - Figure 4-25
-
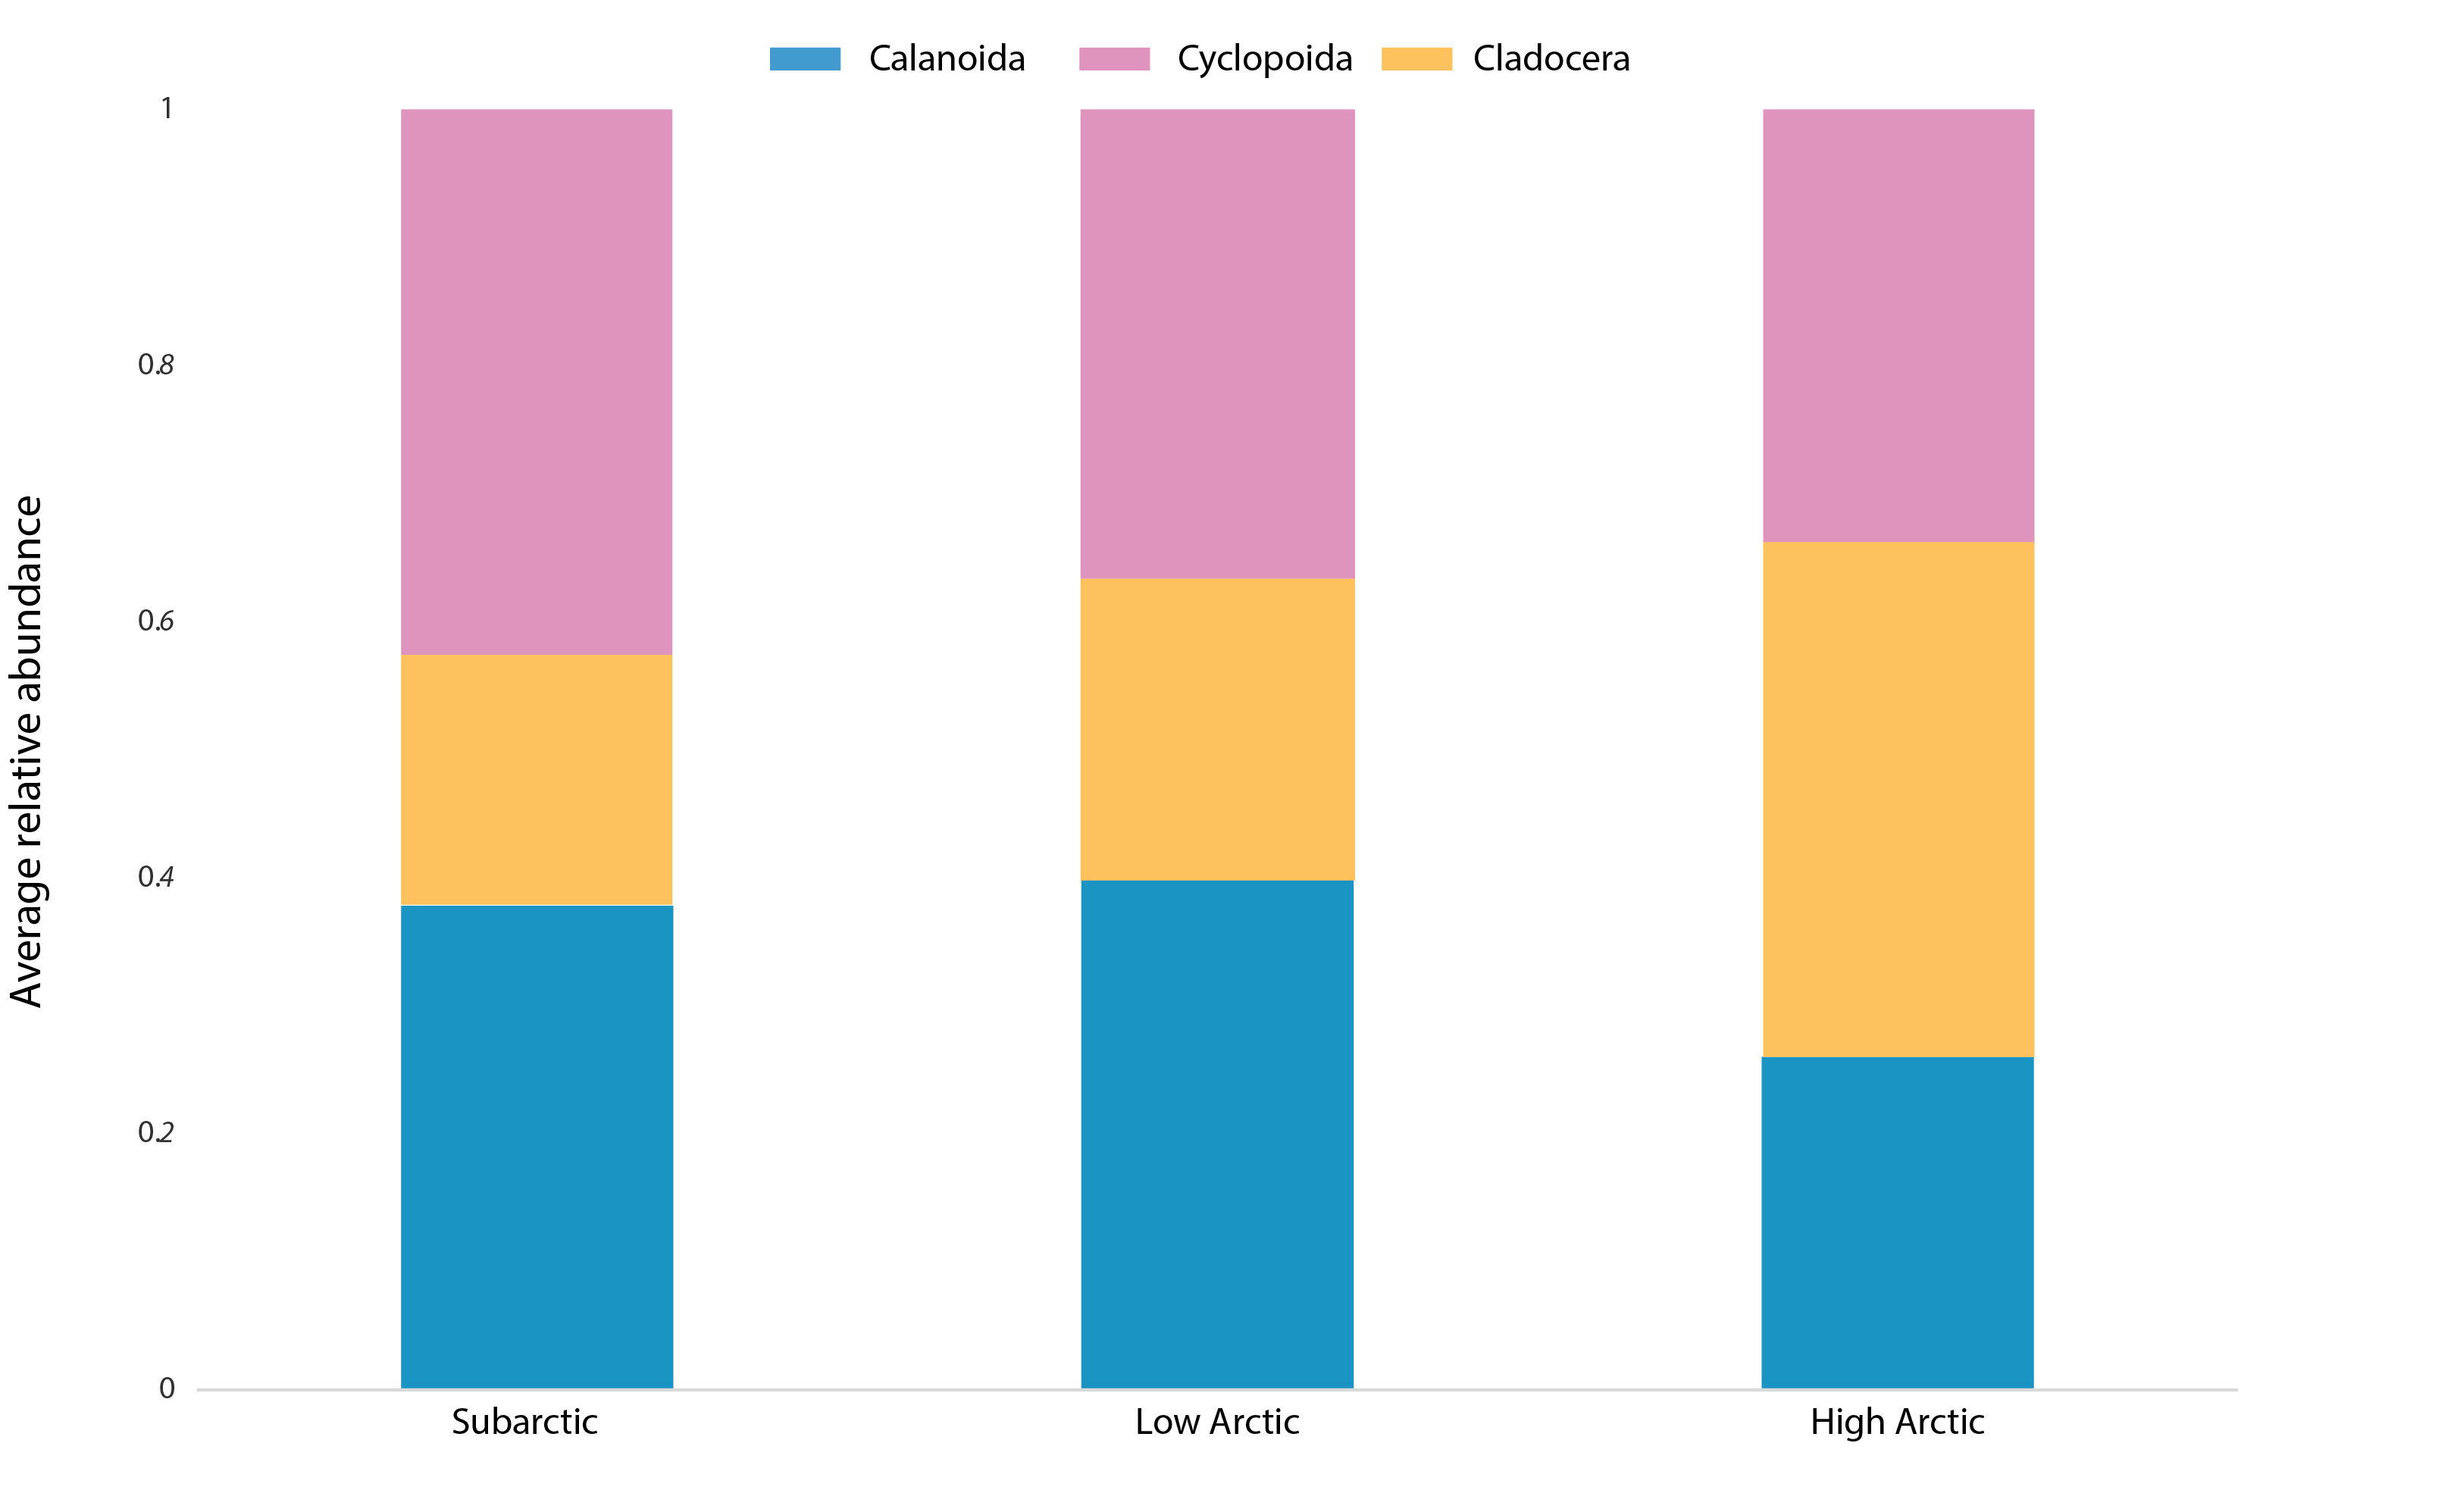
Average relative abundance of the main zooplankton groups (calanoid copepods, cyclopoid copepods, cladocerans) for the sub-Arctic (n=150), low- Arctic (n=154), and high-Arctic (n=55) regions. Samples with a single taxon have been excluded. State of the Arctic Freshwater Biodiversity Report - Chapter 4 - Page 61 - Figure 4-28
-
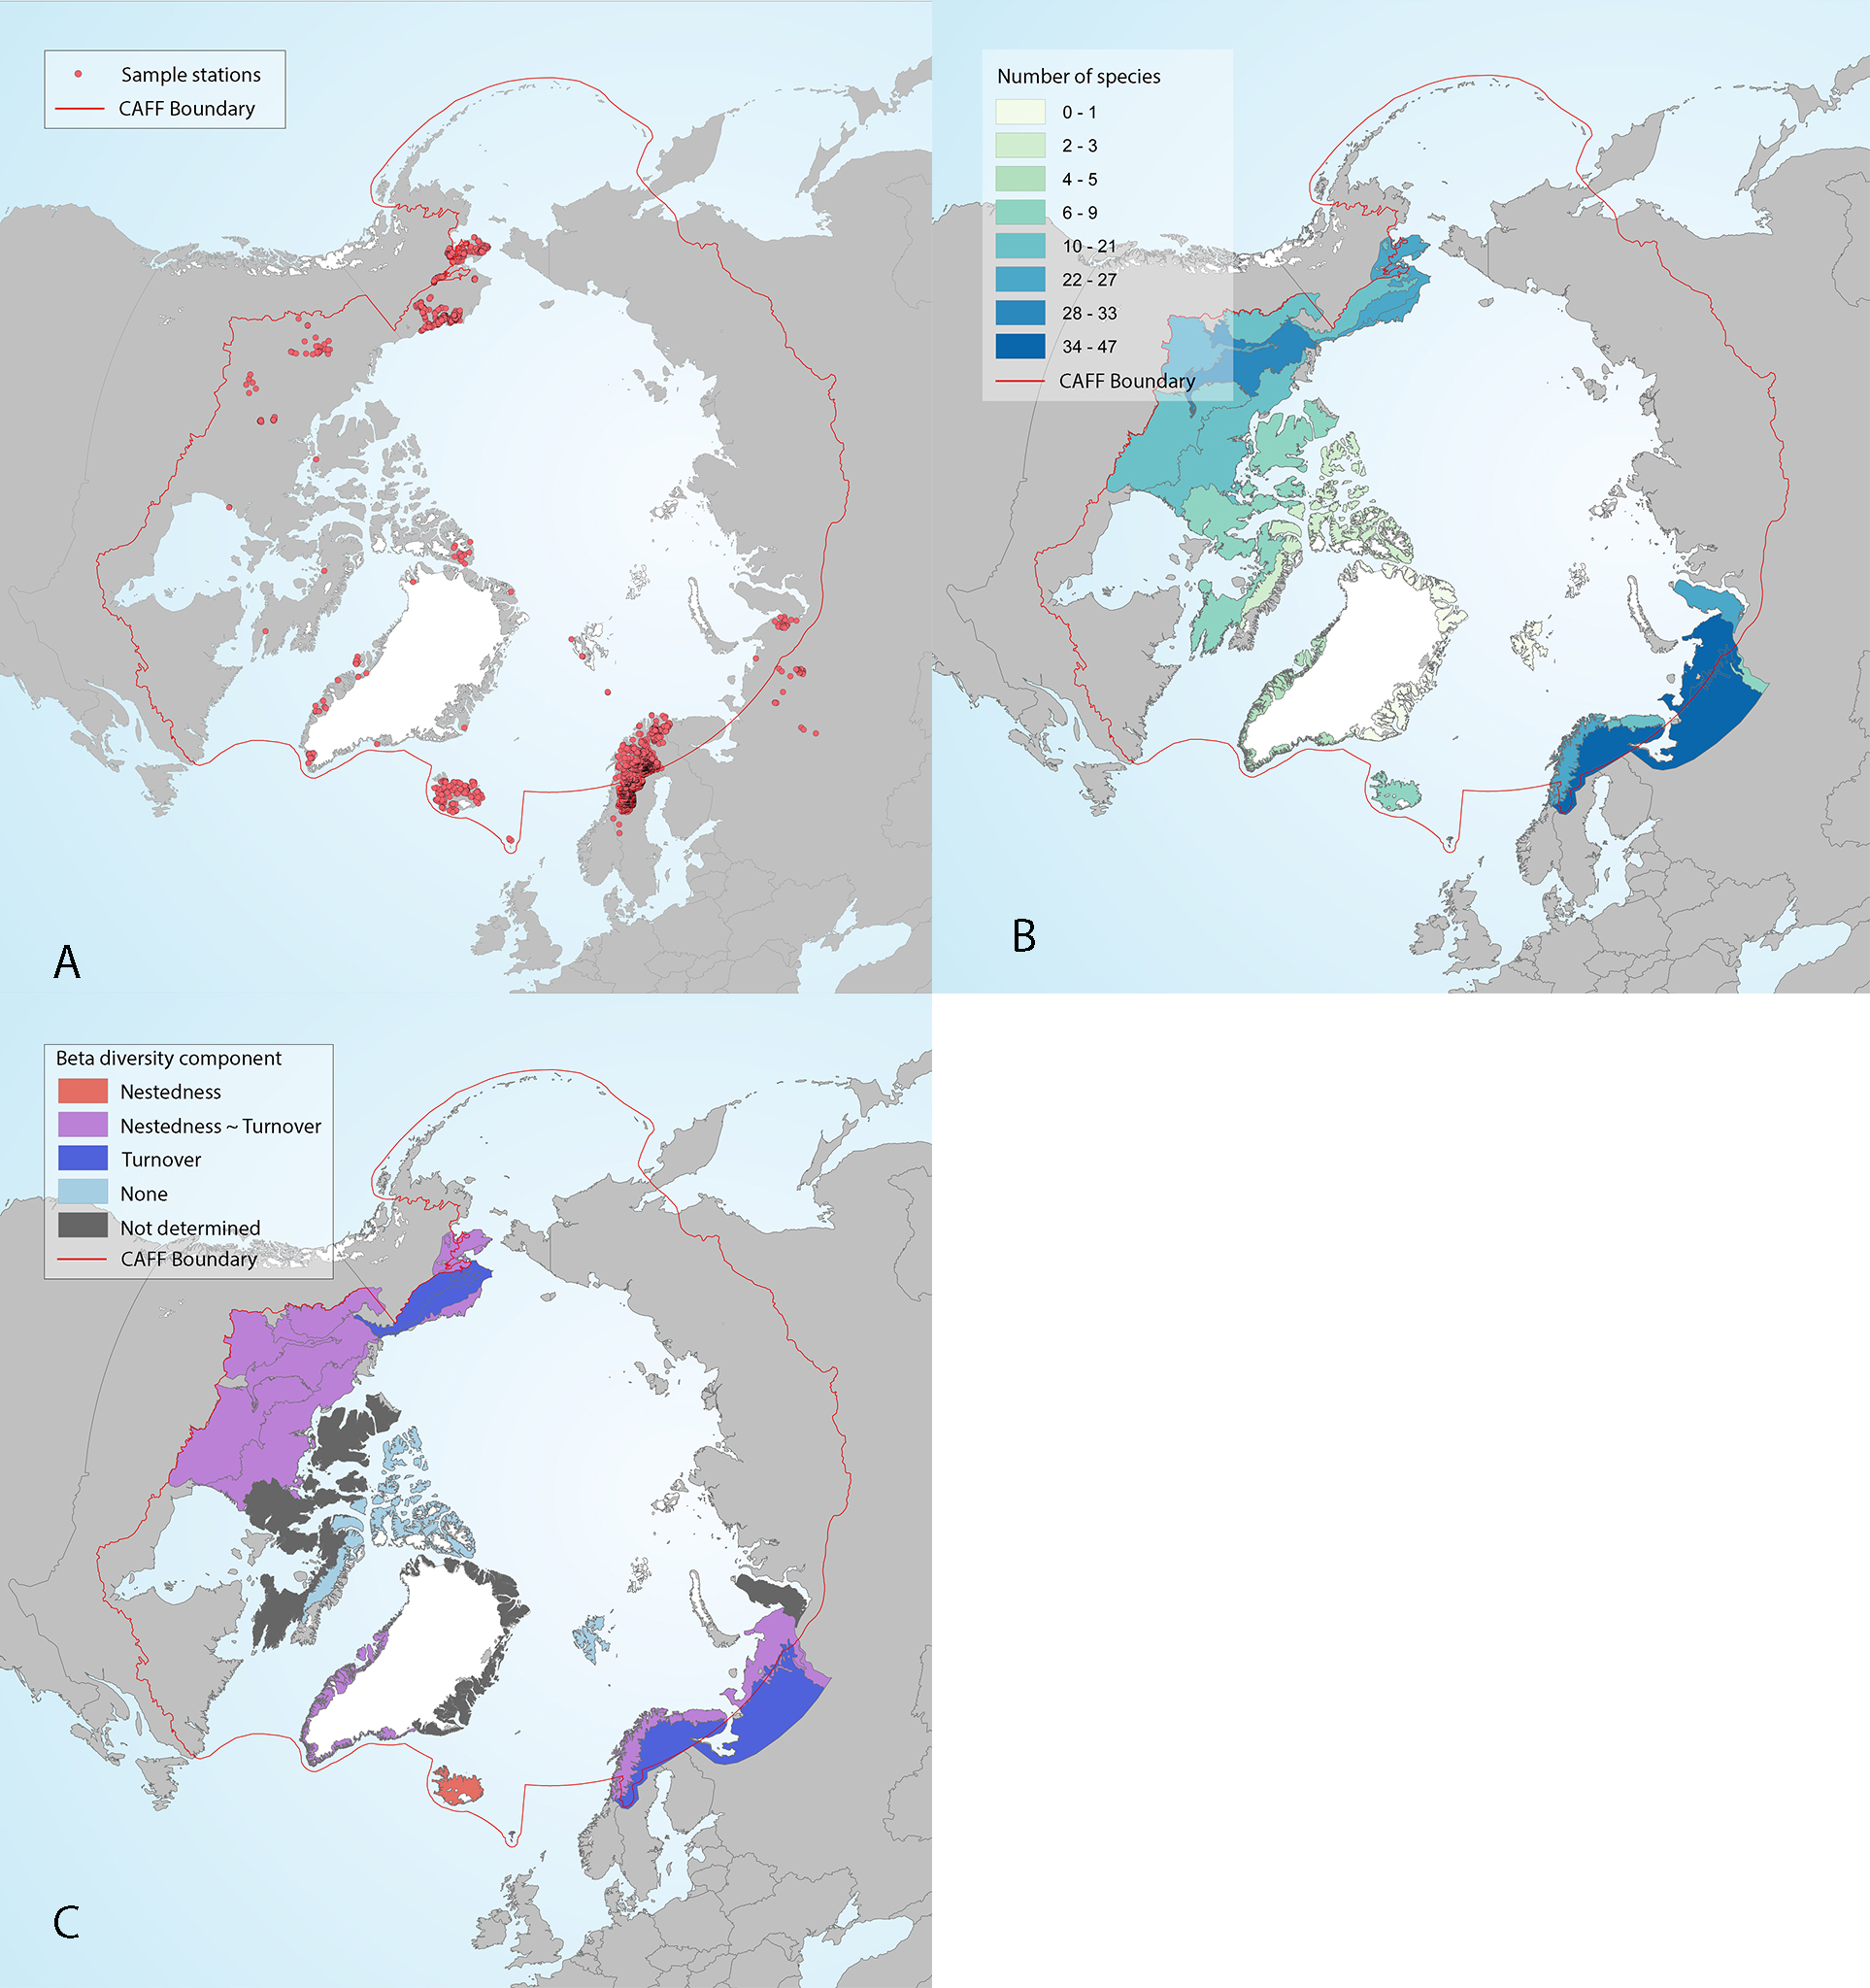
Figure 4 -36 Freshwater fish sampling stations (A), ecoregion alpha diversity in each of the sampled ecoregions, as quantified by estimates of species richness from reference texts (Muus and Dahlstrøm 1971, Scott and Crossman 1973, Mecklenburg et al. 2002) and expert knowledge (academic and government scientists and traditional knowledge) (B), and ecoregion beta diversity (C) characterized according to components of beta diversity as either nestedness, turnover, no diversity (none, beta = 0), or similar nestedness and turnover (nestedness ~ turnover) in the circumpolar Arctic. Ecoregions are shown only where sampling stations occur. Fish sampling stations included in this study assessed complete fish assemblages at each location. State of the Arctic Freshwater Biodiversity Report - Chapter 4 - Page 74 - Figure 4-36