 CAFF - Arctic Biodiversity Data Service (ABDS)
Fishes
Type of resources
Available actions
Topics
Keywords
Contact for the resource
Provided by
Representation types
Update frequencies
status
-
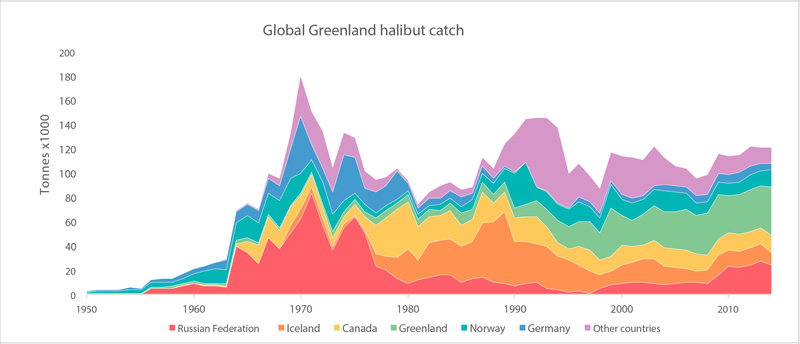
Global catches of Greenland halibut (FAO 2015). STATE OF THE ARCTIC MARINE BIODIVERSITY REPORT - <a href="https://arcticbiodiversity.is/findings/marine-fishes" target="_blank">Chapter 3</a> - Page 121 - Figure 3.4.8
-
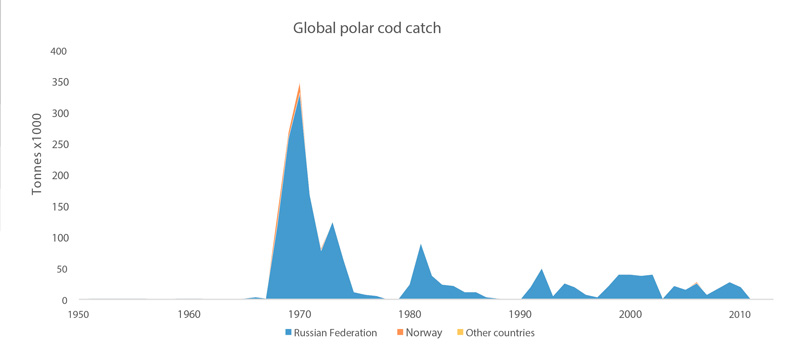
Global catches of polar cod from 1950 to 2011 (FAO 2015); 95% of the catches are from the Barents Sea. STATE OF THE ARCTIC MARINE BIODIVERSITY REPORT - <a href="https://arcticbiodiversity.is/findings/marine-fishes" target="_blank">Chapter 3</a> - Page 116 - Figure 3.4.4
-
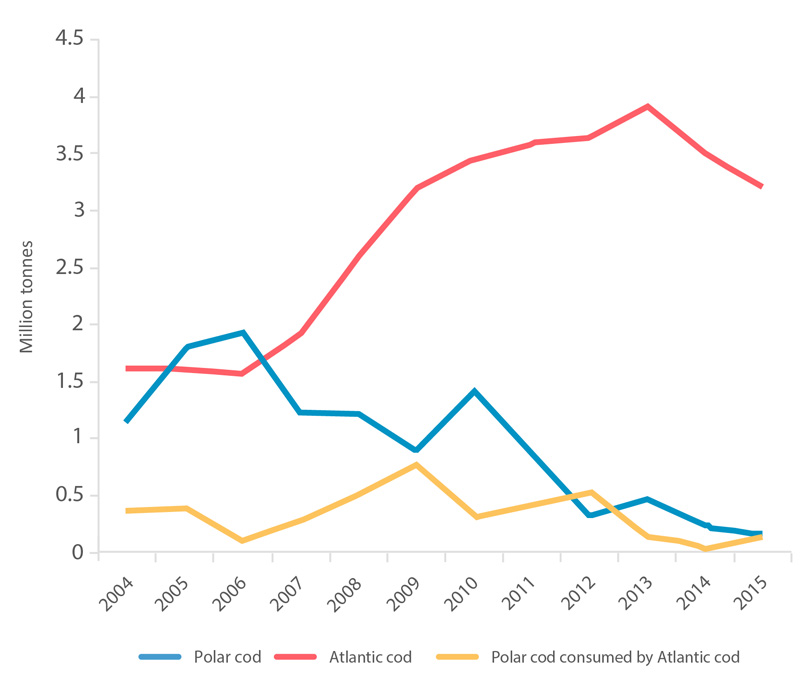
Estimated consumption of polar cod by Atlantic cod in the Barents Sea (yellow line) and biomass of the Atlantic cod stock in the Barents Sea (red line) (ICES 2016). The blue line is the biomass of the Barents Sea polar cod (Prozorkevich 2016). STATE OF THE ARCTIC MARINE BIODIVERSITY REPORT - <a href="https://arcticbiodiversity.is/findings/marine-fishes" target="_blank">Chapter 3</a> - Page 116 - Box figure 3.4.1
-
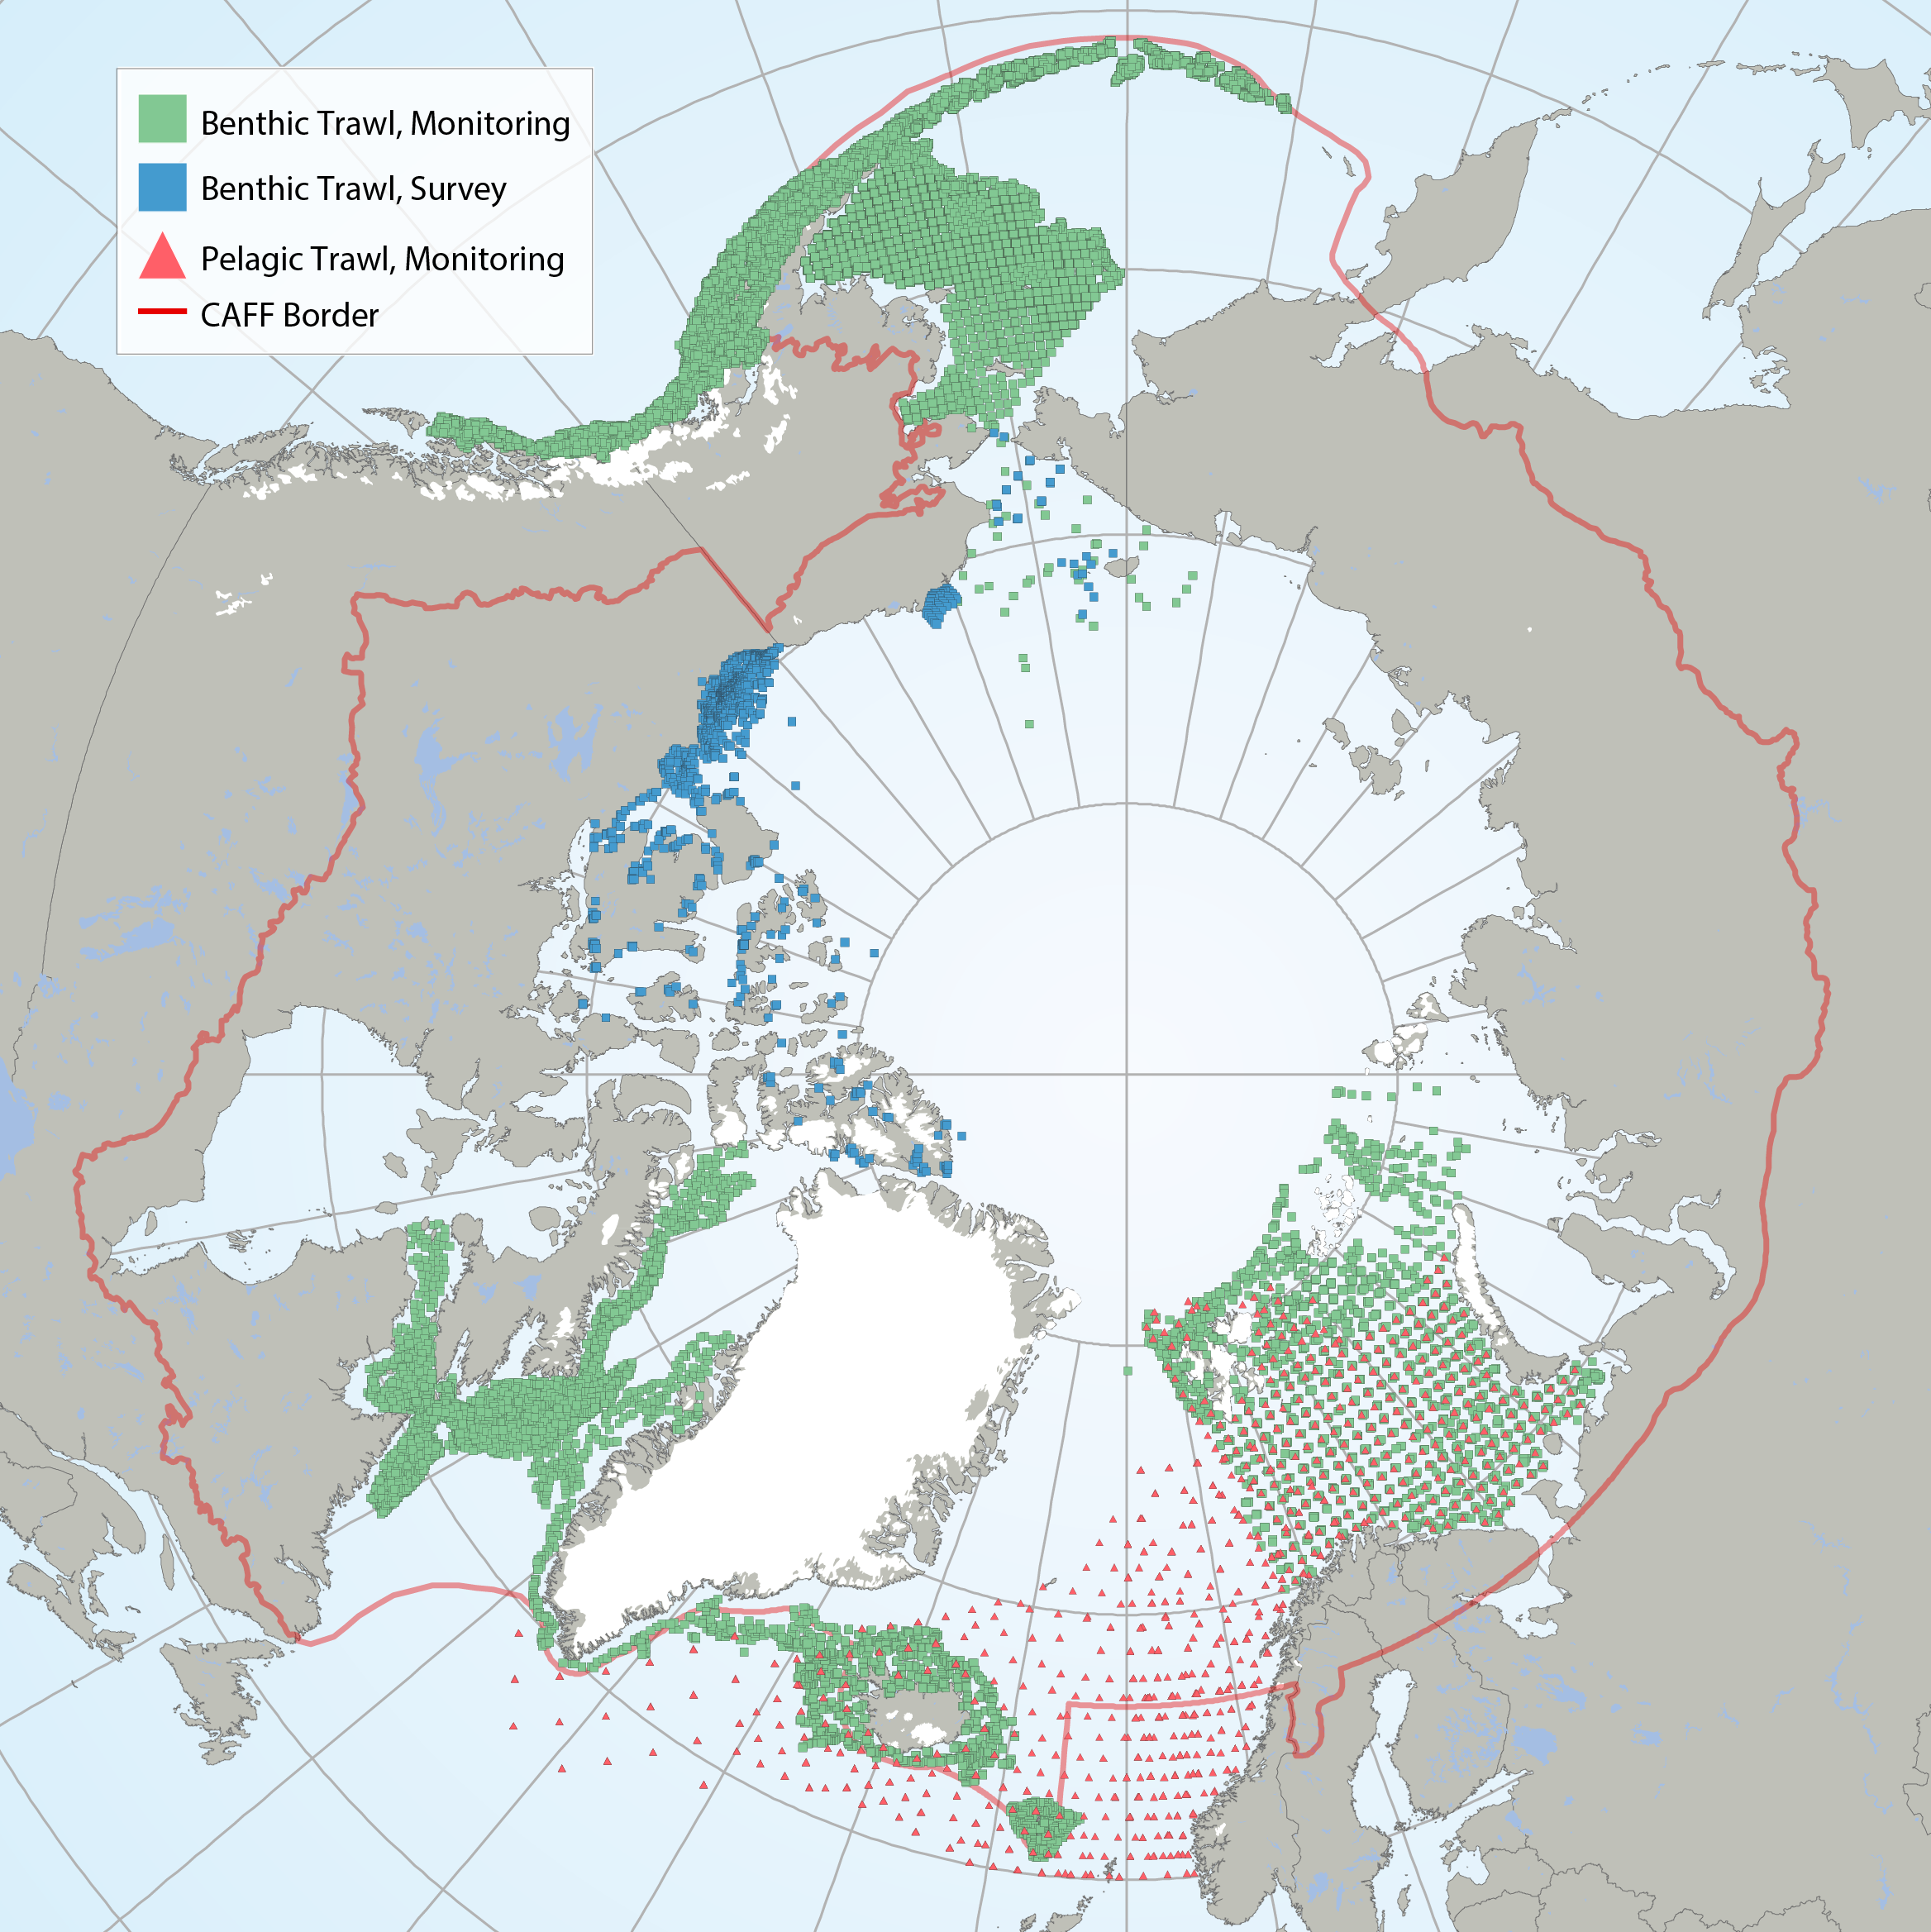
Map of contemporary marine fish data sources. Green squares indicate data from benthic trawl monitoring efforts, blue squares indicate data from benthic trawl surveys, while red triangles indicate data from pelagic trawl monitoring efforts. Red line indicates the CAFF boundary. STATE OF THE ARCTIC MARINE BIODIVERSITY REPORT - <a href="https://arcticbiodiversity.is/findings/marine-fishes" target="_blank">Chapter 3</a> - Page 112 - Figure 3.4.1
-
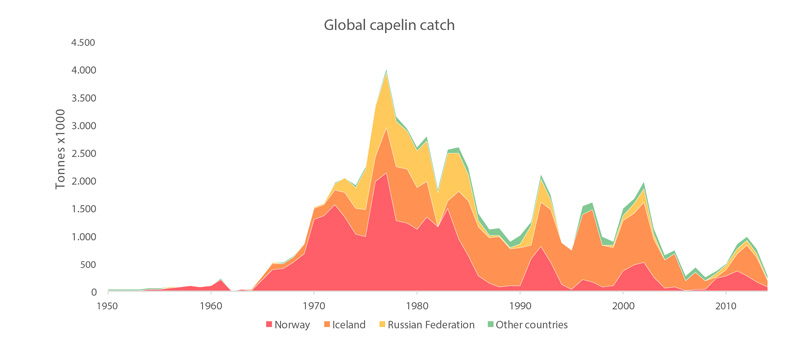
Global catches of all capelin species from 1950 to 2011 (FAO 2015). STATE OF THE ARCTIC MARINE BIODIVERSITY REPORT - <a href="https://arcticbiodiversity.is/findings/marine-fishes" target="_blank">Chapter 3</a> - Page 119 - Figure 3.4.6
-
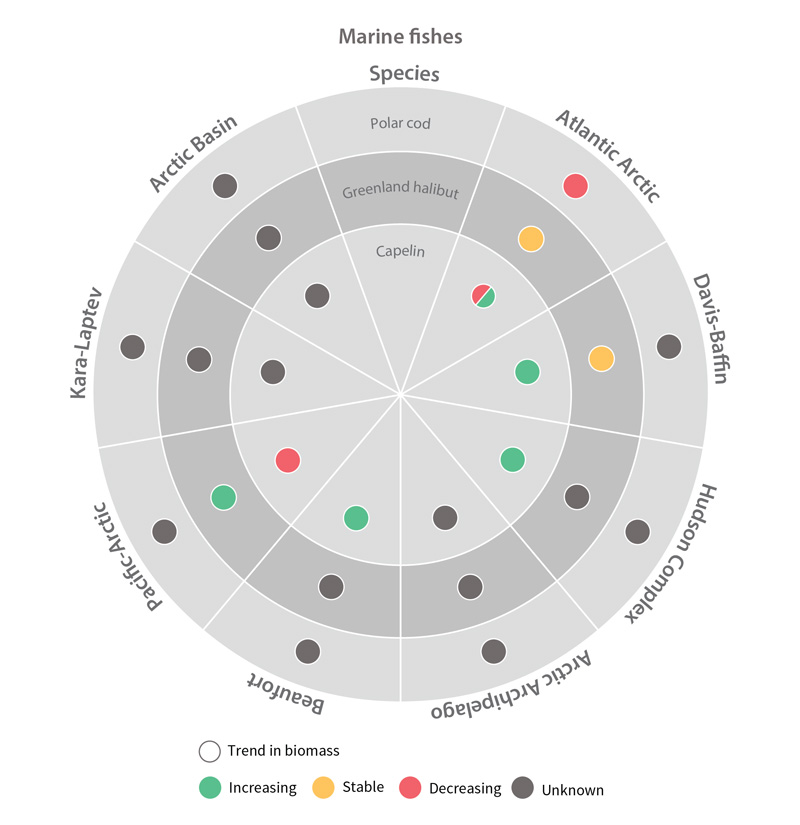
Trends in biomass of marine fish Focal Ecosystem Components across each Arctic Marine Area STATE OF THE ARCTIC MARINE BIODIVERSITY REPORT - Chapter 4 - Page 180 - Figure 4.4
-
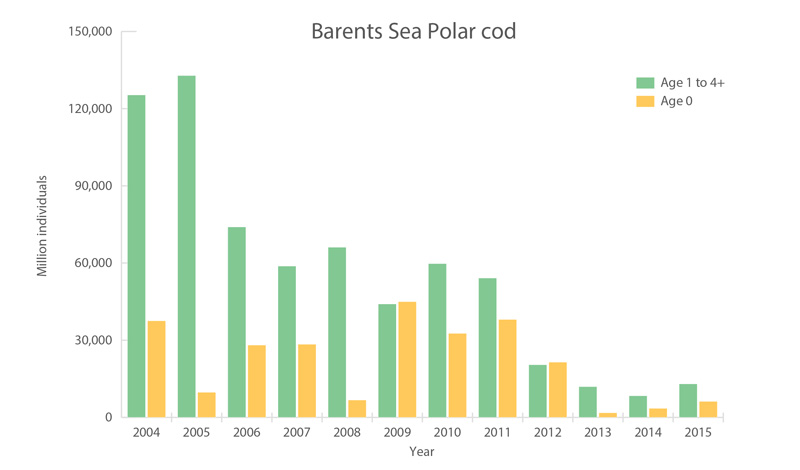
Polar cod in the Barents Sea. Acoustic estimate of polar cod 1-year-old and older (green) and pelagic trawl index of age 0-group abundance (yellow). Source: Joint IMR-PINRO ecosystem survey (Prozorkevich 2016). STATE OF THE ARCTIC MARINE BIODIVERSITY REPORT - <a href="https://arcticbiodiversity.is/findings/marine-fishes" target="_blank">Chapter 3</a> - Page 116 - Figure 3.4.3
-
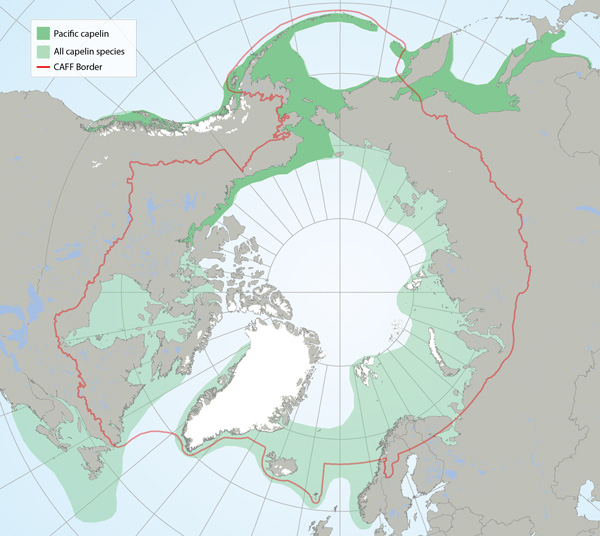
Distributions of all capelin species (light green) and Pacific capelin (Mallotus catervarius; dark green pattern) based on participation in research sampling, examination of museum voucher collections, the literature and molecular genetic analysis (Mecklenburg and Steinke 2015, Mecklenburg et al. 2016). Map shows the maximum distribution observed from point data and includes both common and rare locations STATE OF THE ARCTIC MARINE BIODIVERSITY REPORT - <a href="https://arcticbiodiversity.is/findings/marine-fishes" target="_blank">Chapter 3</a> - Page 117 - Figure 3.4.5
-
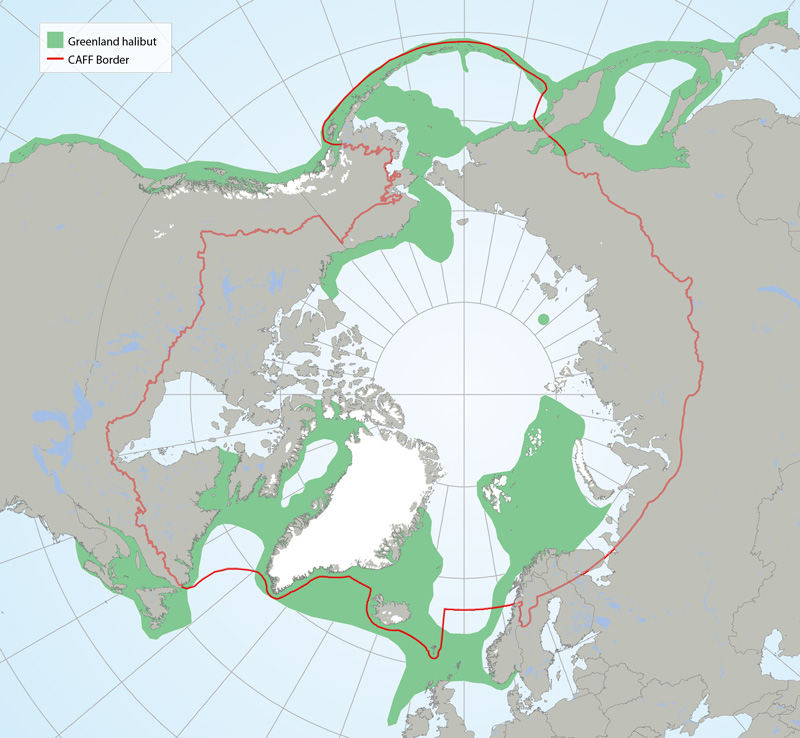
Distribution of Greenland halibut (Reinhardtius hippoglossoides) based on participation in research sampling, examination of museum voucher collections, literature and molecular genetic analysis (Mecklenburg et al. 2011, 2014, 2016, Mecklenburg and Steinke 2015). Map shows the maximum distribution observed from point data and includes both common and rare locations. STATE OF THE ARCTIC MARINE BIODIVERSITY REPORT - <a href="https://arcticbiodiversity.is/findings/marine-fishes" target="_blank">Chapter 3</a> - Page 120 - Figure 3.4.7
-
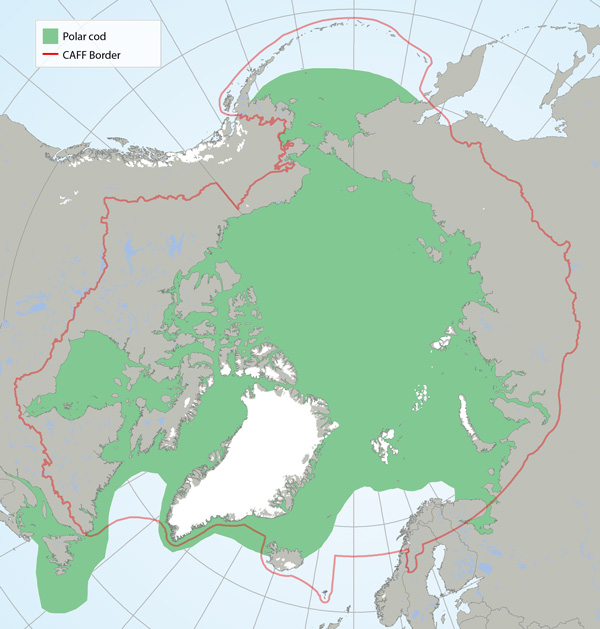
Distribution of polar cod (Boreogadus saida) based on participation in research sampling, examination of museum voucher collections and the literature (Mecklenburg et al. 2011, 2014, 2016; Mecklenburg and Steinke 2015). Map shows the maximum distribution observed from point data and includes both common and rare locations. STATE OF THE ARCTIC MARINE BIODIVERSITY REPORT - <a href="https://arcticbiodiversity.is/findings/marine-fishes" target="_blank">Chapter 3</a> - Page 114 - Figure 3.4.2