 CAFF - Arctic Biodiversity Data Service (ABDS)

Type of resources
Available actions
Topics
Keywords
Contact for the resource
Provided by
Years
Formats
Representation types
Update frequencies
status
Service types
Scale
-
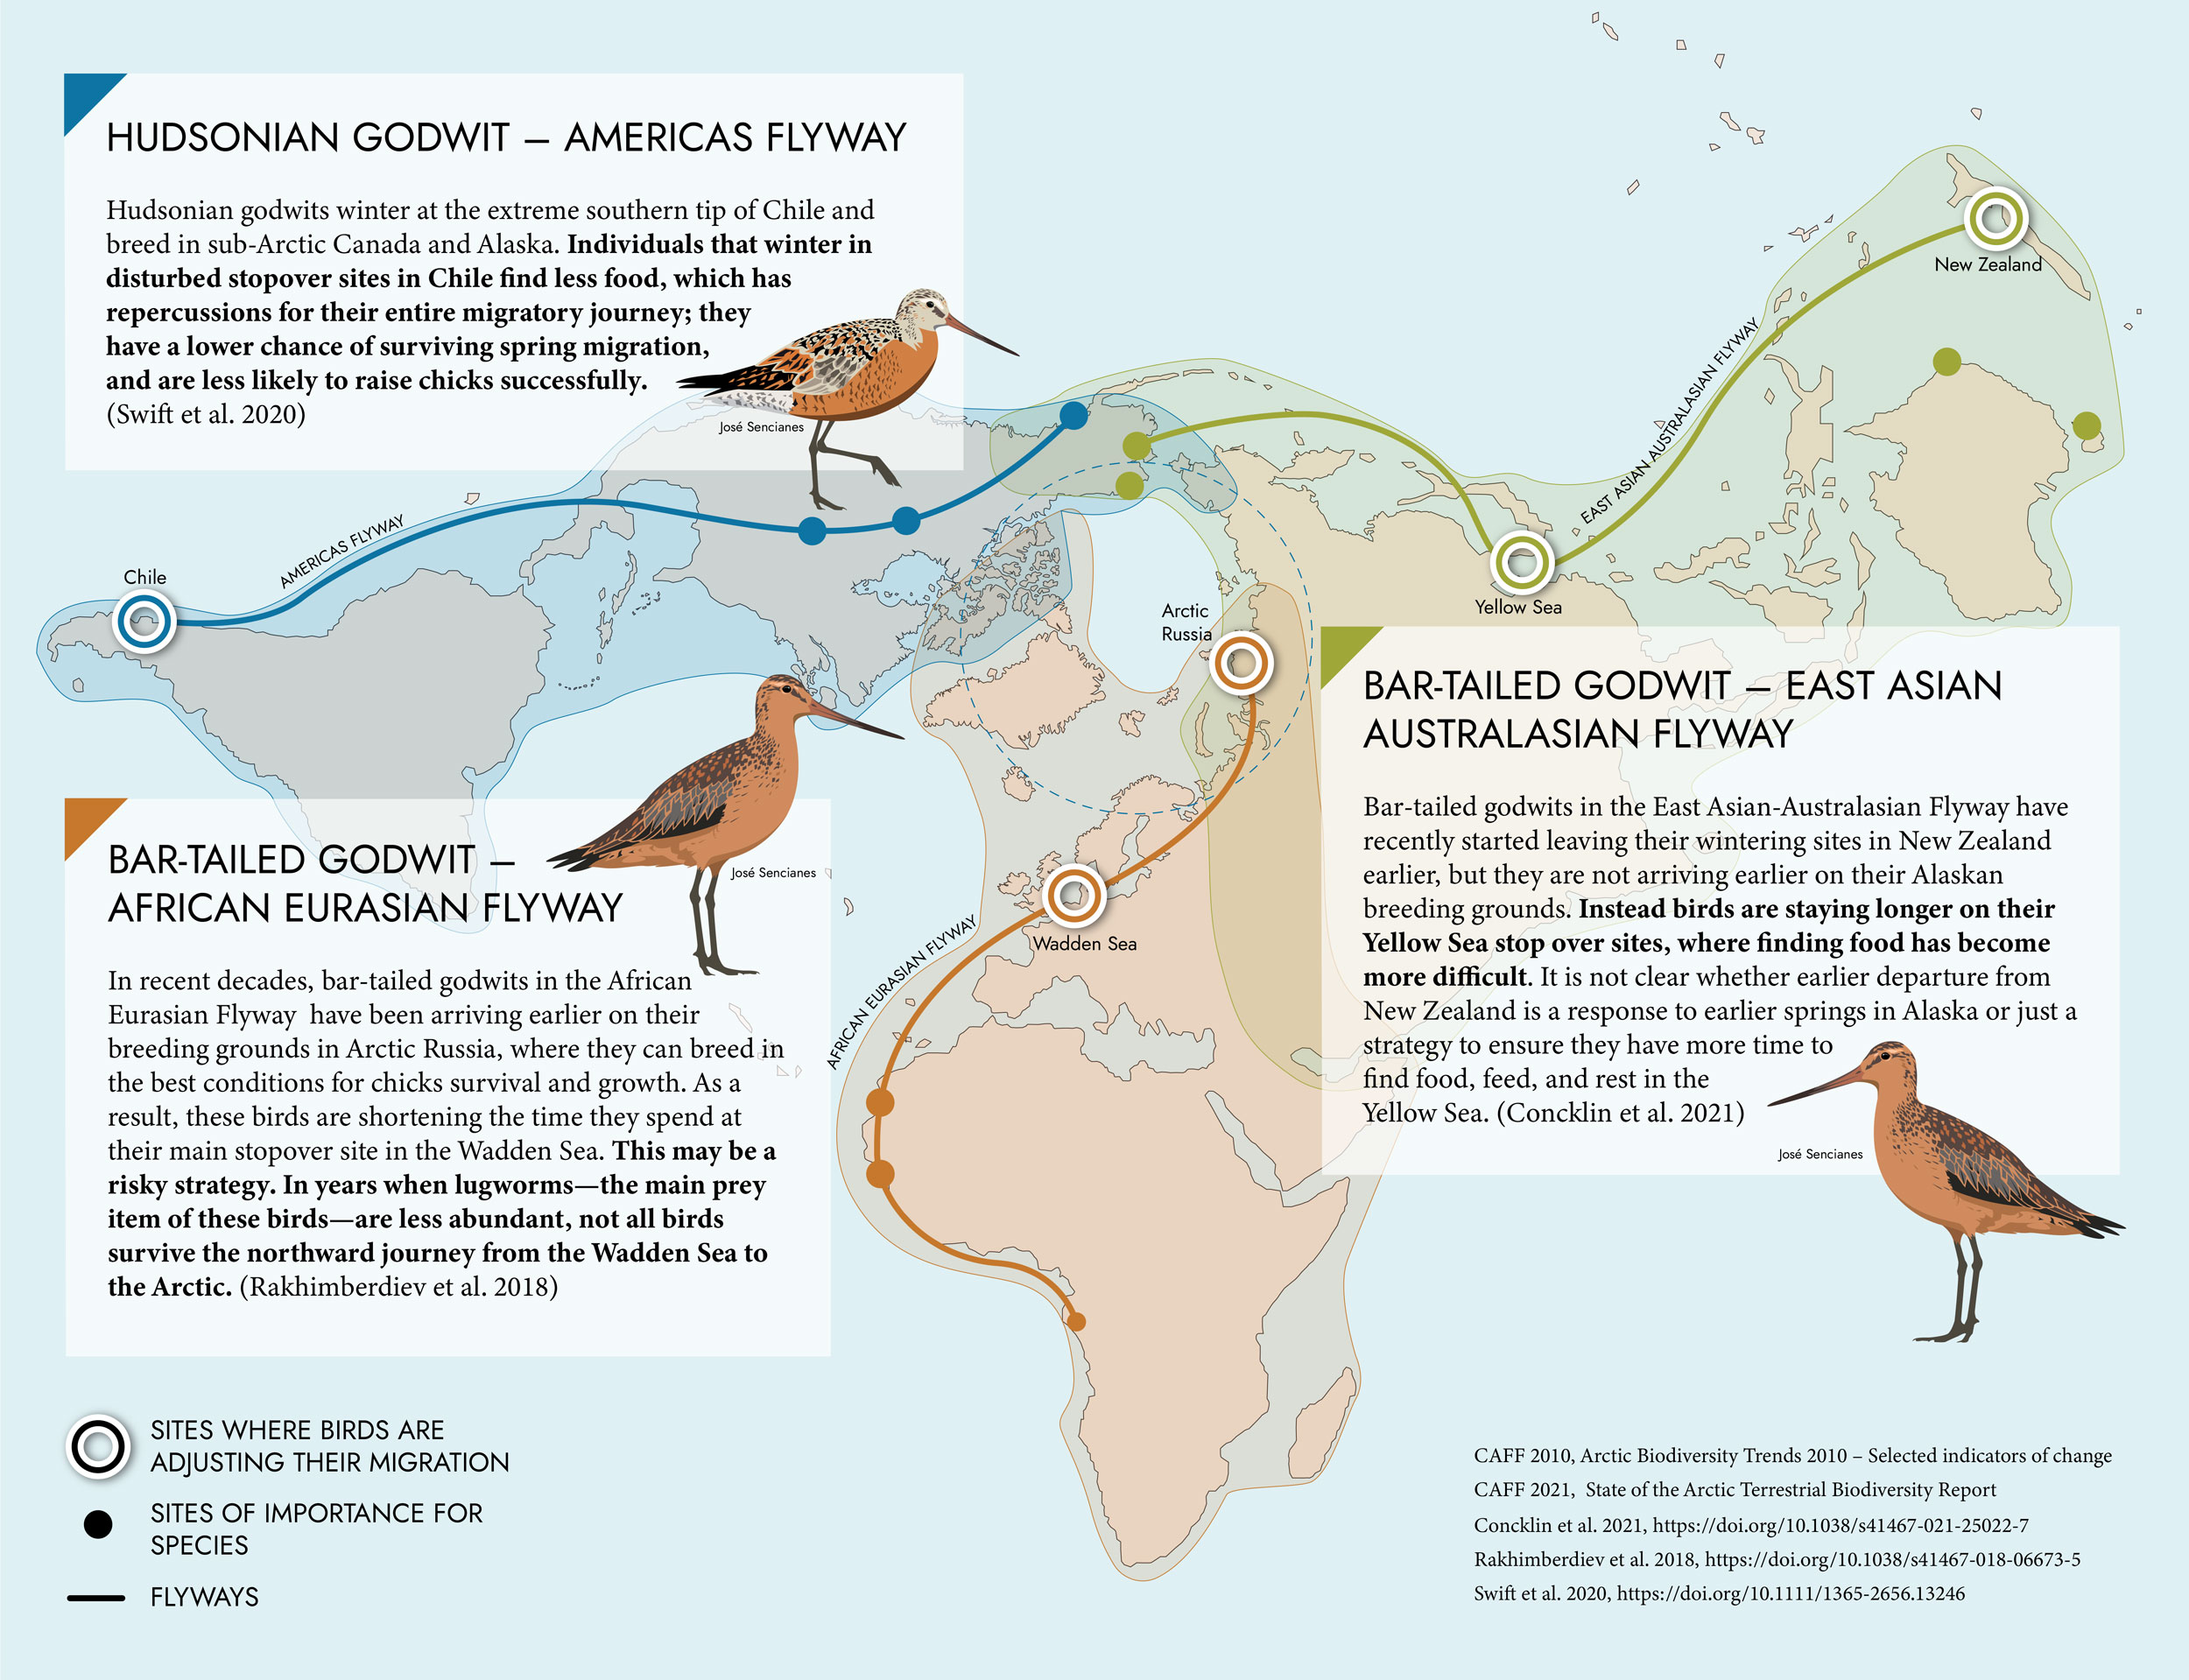
Shorebirds experience threats throughout their migratory journeys. Their Arctic breeding grounds are changing.
-
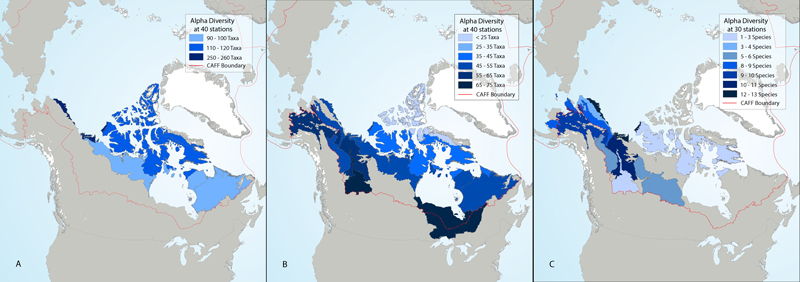
Rarefied alpha diversity of river (a) diatoms from benthic samples, (b) benthic macroinvertebrates, and (c) fish in ecoregions across North America. State of the Arctic Freshwater Biodiversity Report - Chapter 5- Page 84 - Figure 5-1
-
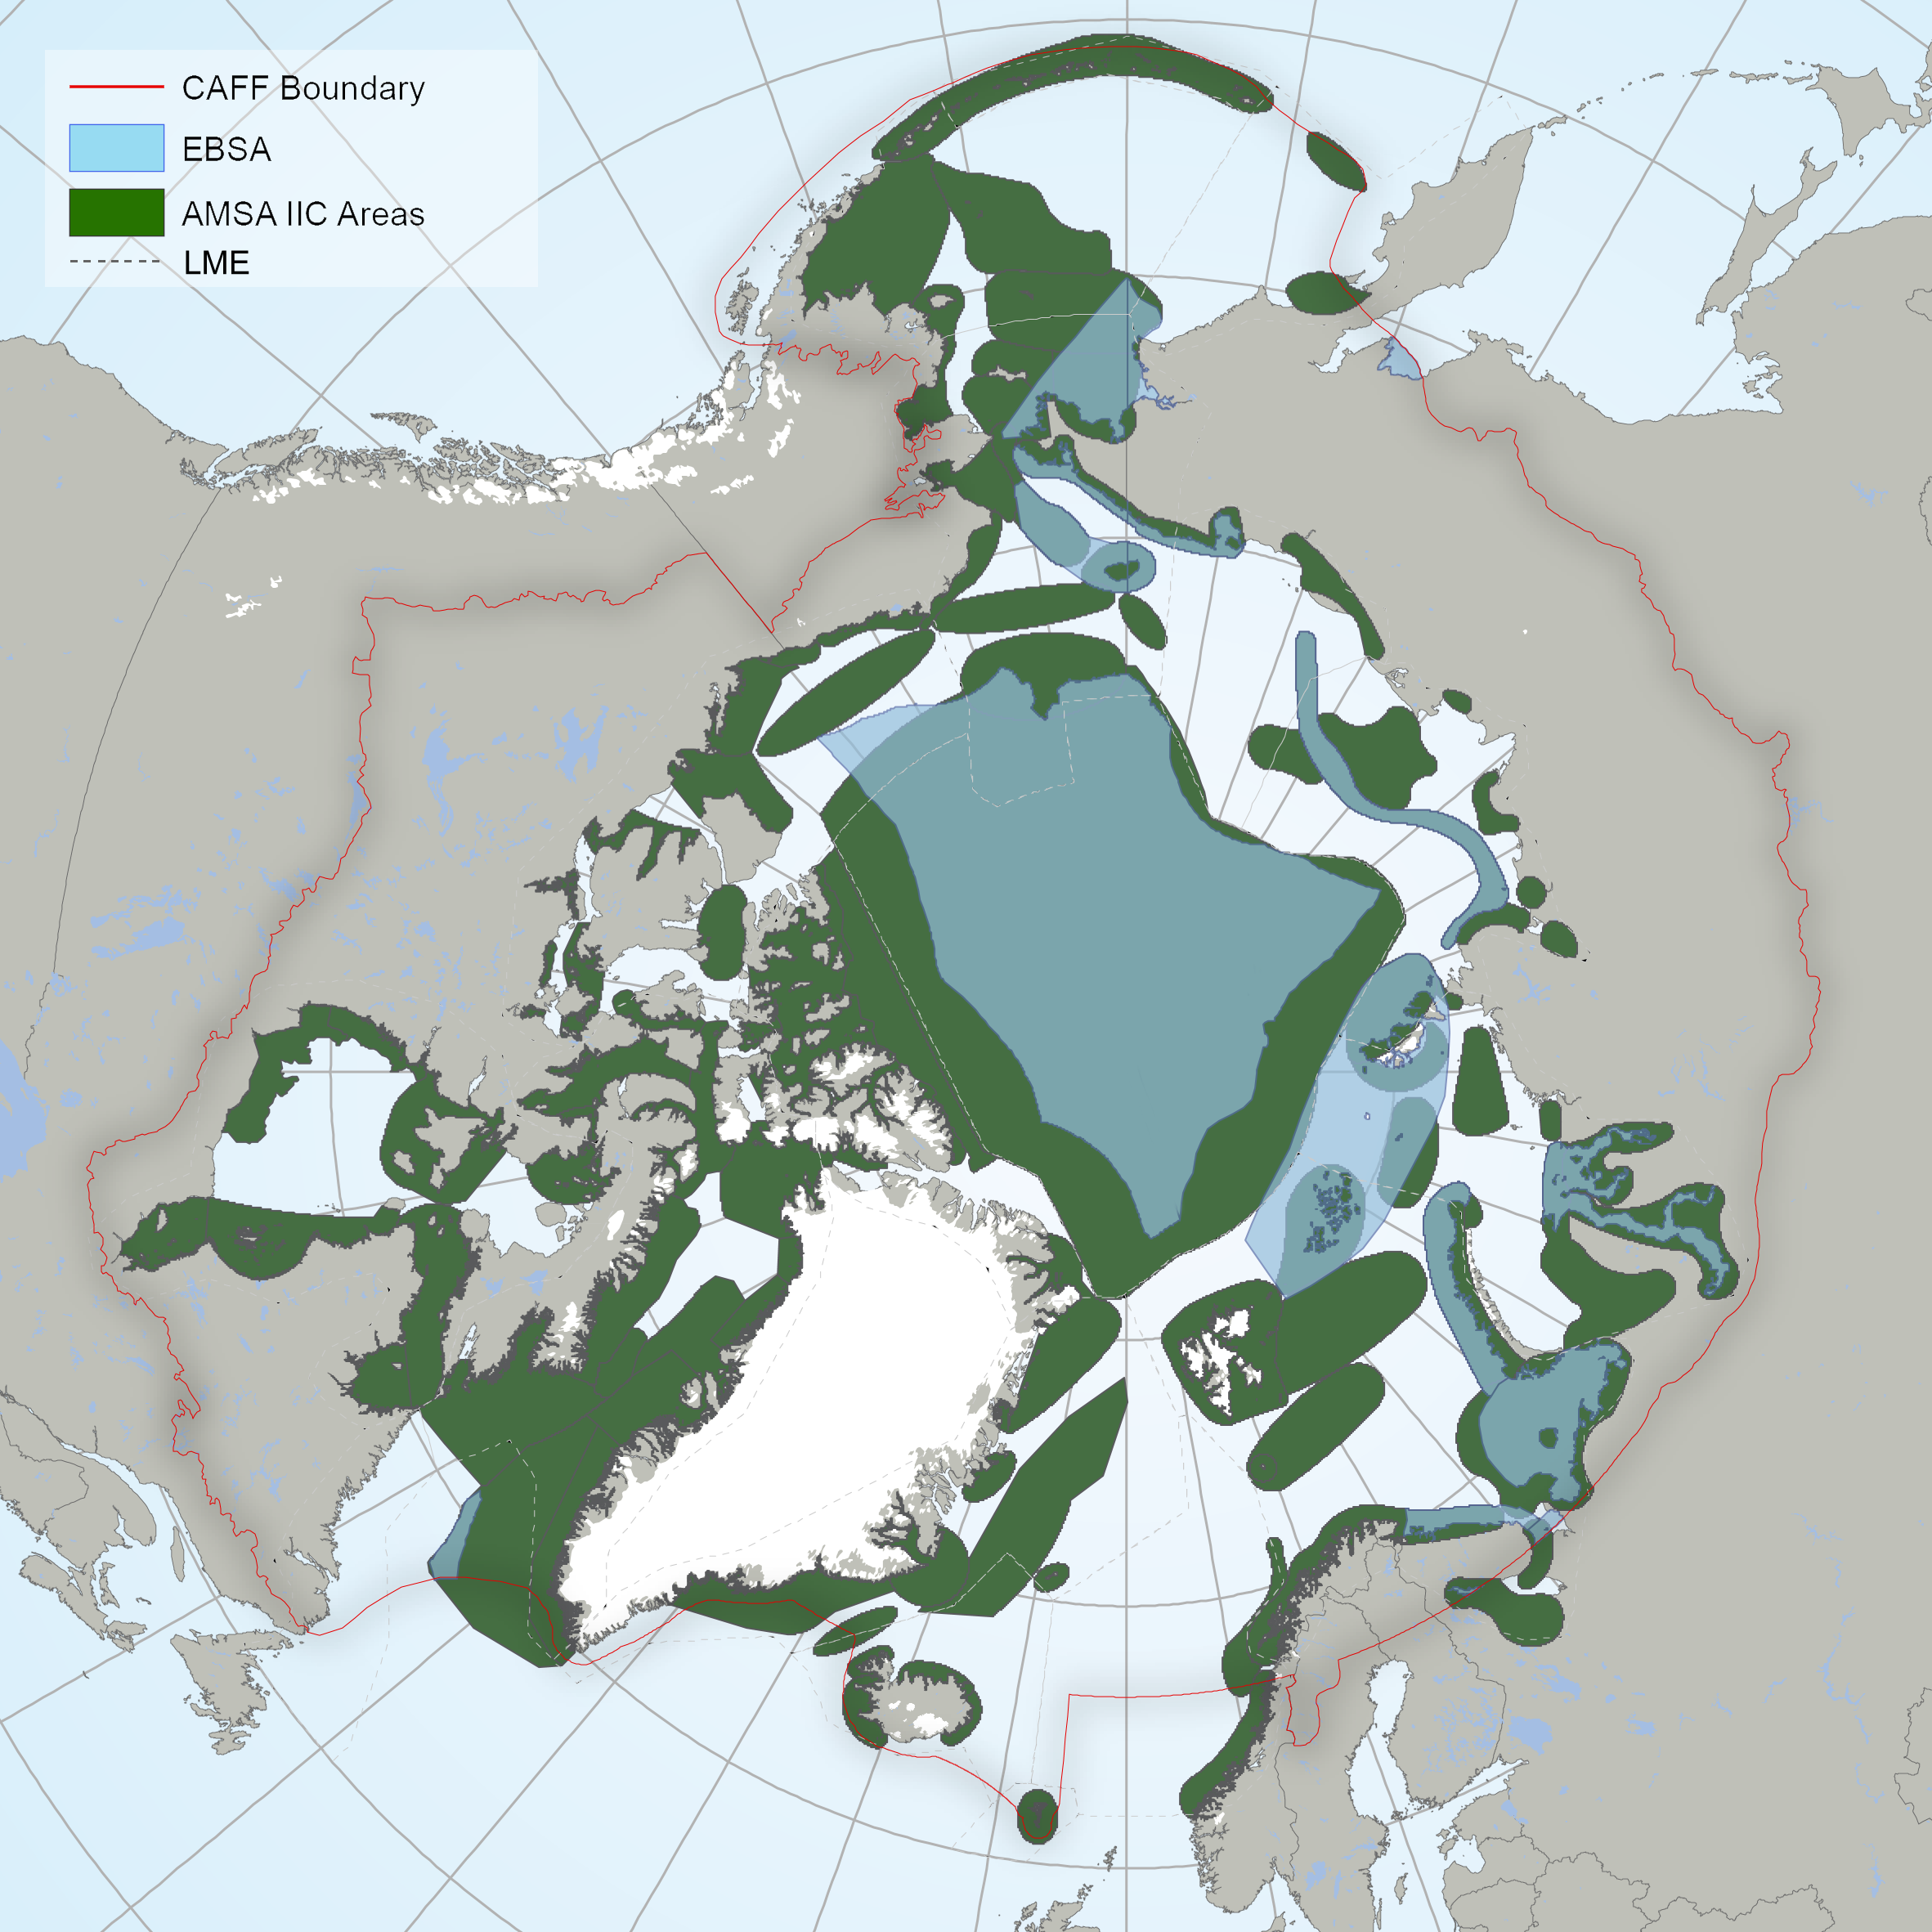
EBSAs (Source: CBD 2016) and marine “areas of heightened ecological and cultural significance” (Source: AMAP/CAFF/SDWG, 2013). In 2013, the Arctic Council identified “Areas of heightened ecological and cultural significance” using the International Maritime Organization criteria for Particularly Sensitive Sea Areas (PSSAs), which are similar to the CBD Ecologically and Biologically Significant Areas (EBSAs) criteria. The term “areas of heightened ecological and cultural significance” comes from Recommendation IIC of the Arctic Council’s 2009 Arctic Marine Shipping Assessment: ARCTIC PROTECTED AREAS - INDICATOR REPORT 2017
-
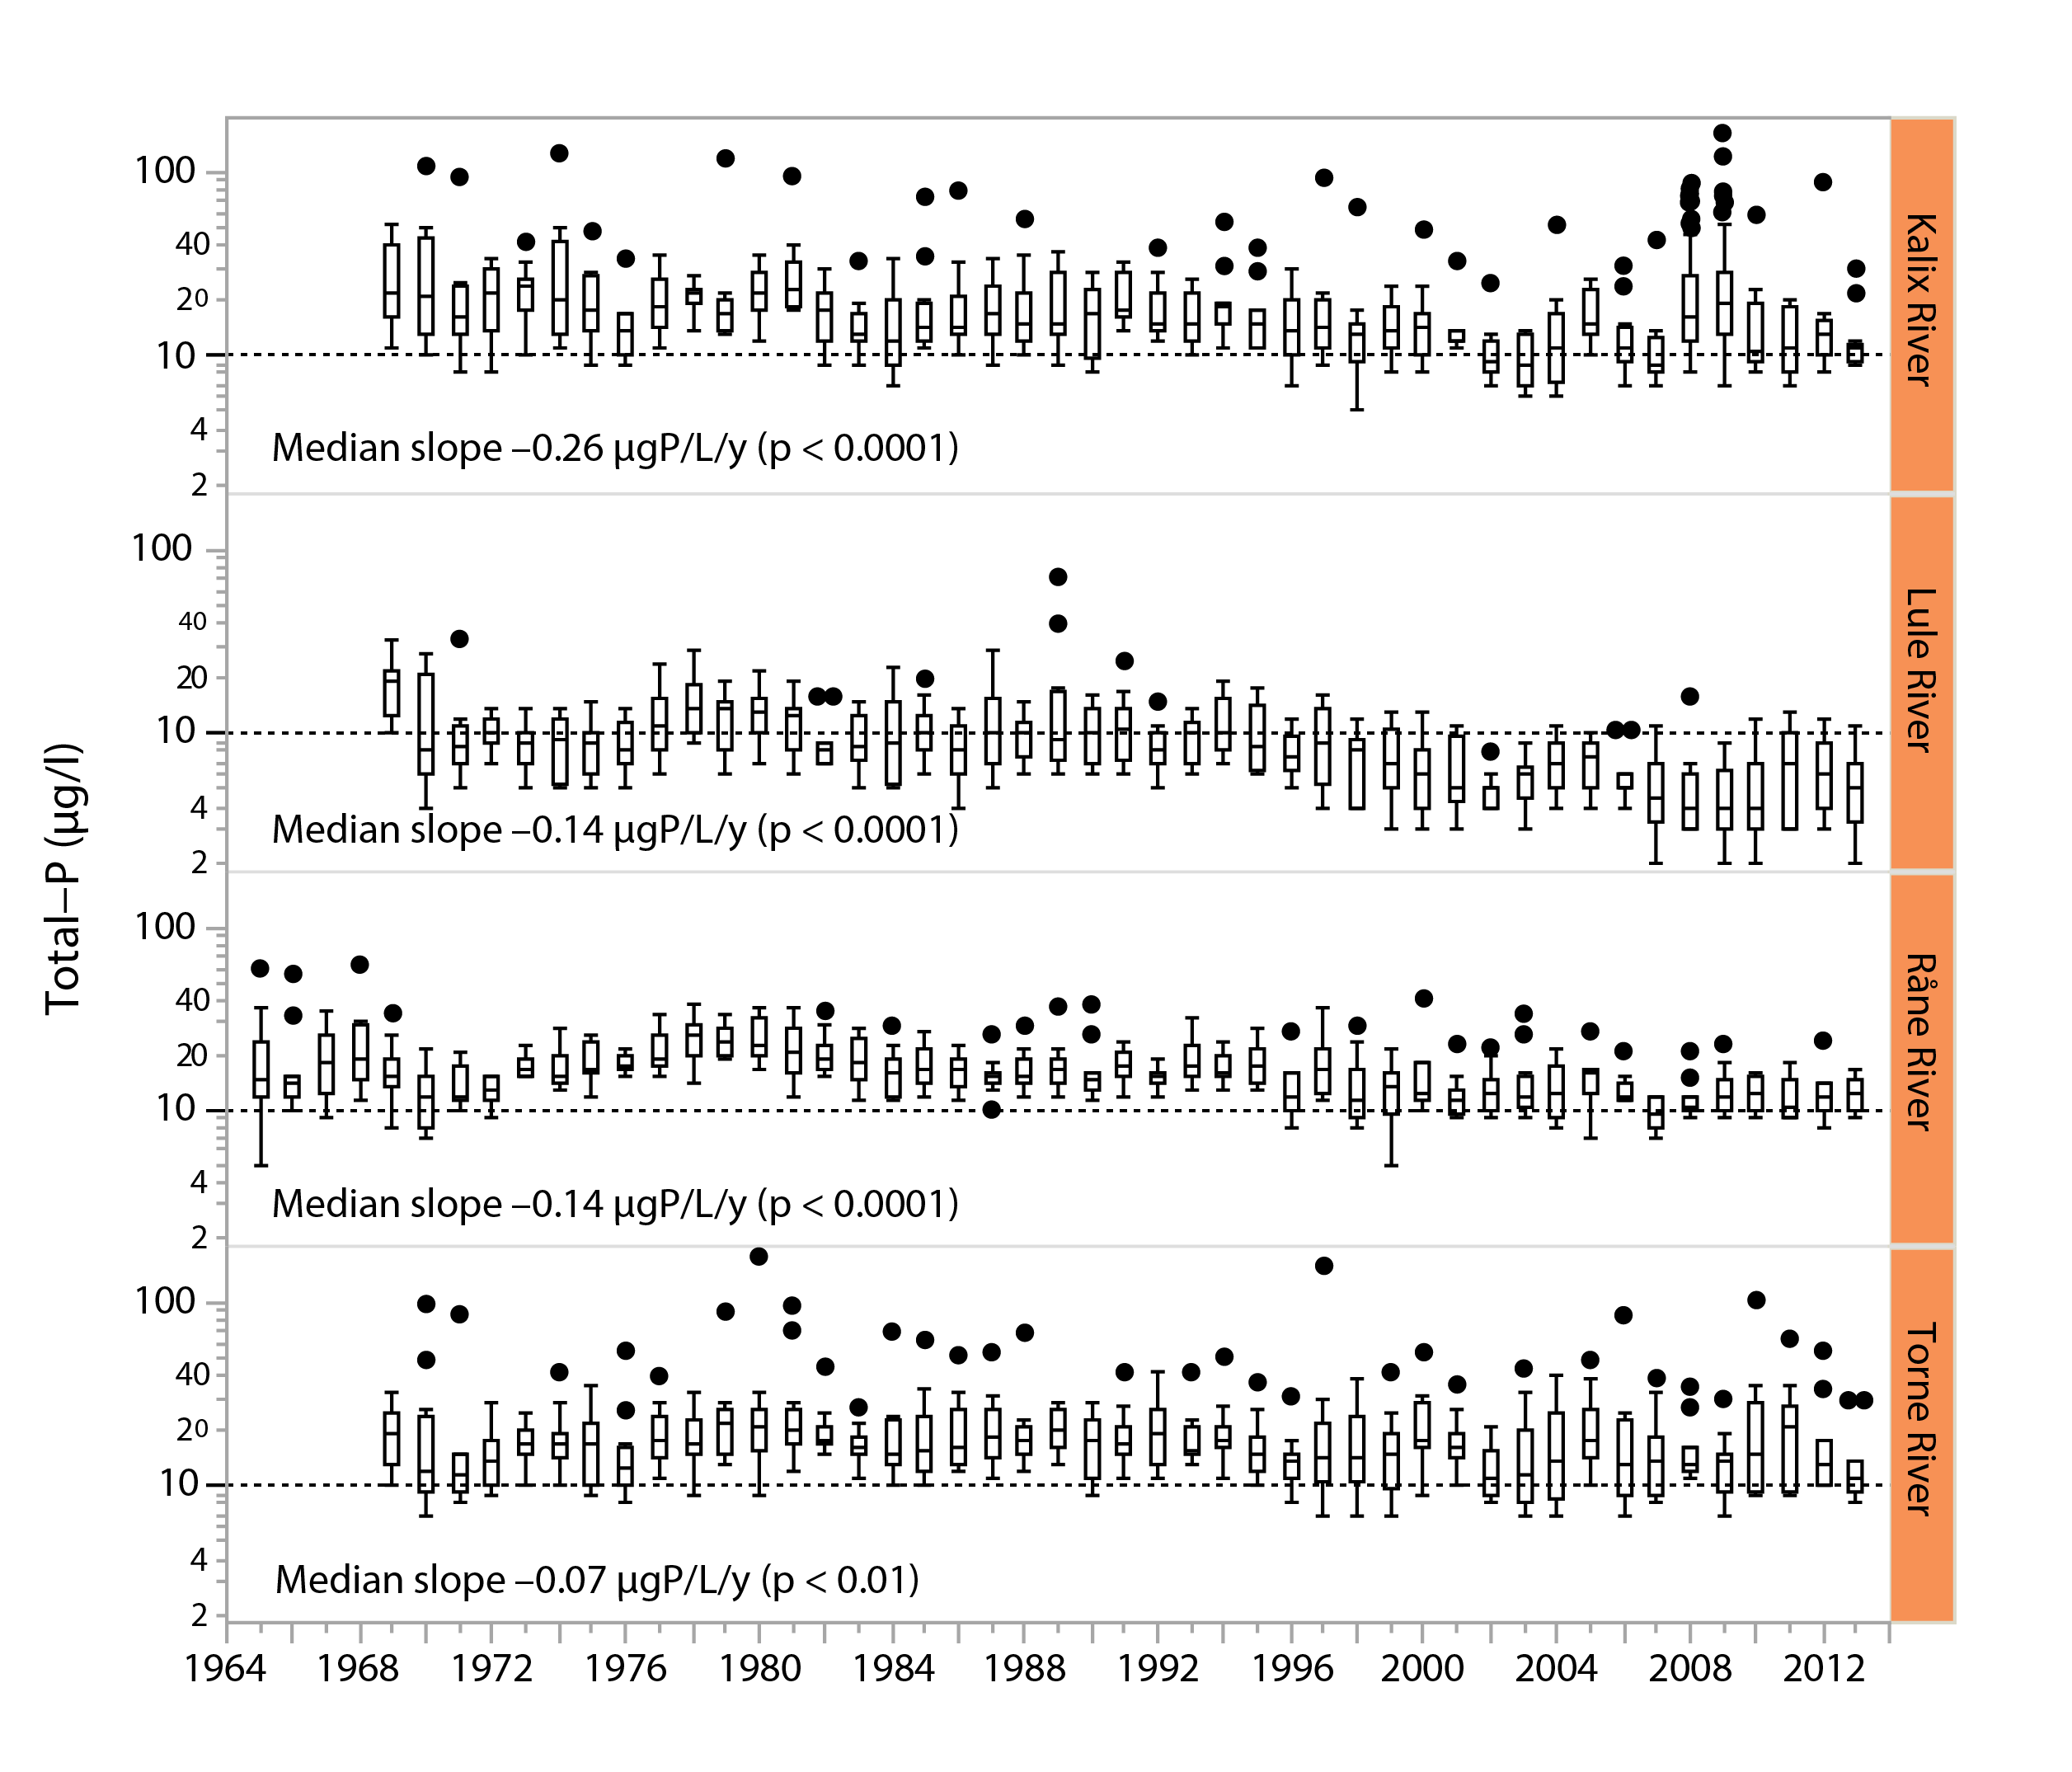
Figure 3-3 Long-term trends in total phosphorus water concentrations (μg/L) in four major, unregulated rivers that drain the subarctic Arctic/alpine ecoregion of the Scandinavian peninsula, the Kalix river, The Lule river, the Råne river, and the Torne river. Slopes and p-values are given in the different panels. Boxes indicate medians and 25th and 75th percentiles, while whiskers give the 10th and 90th percentiles. State of the Arctic Freshwater Biodiversity Report - Chapter 3 - Page 21 - Figure 3-3
-
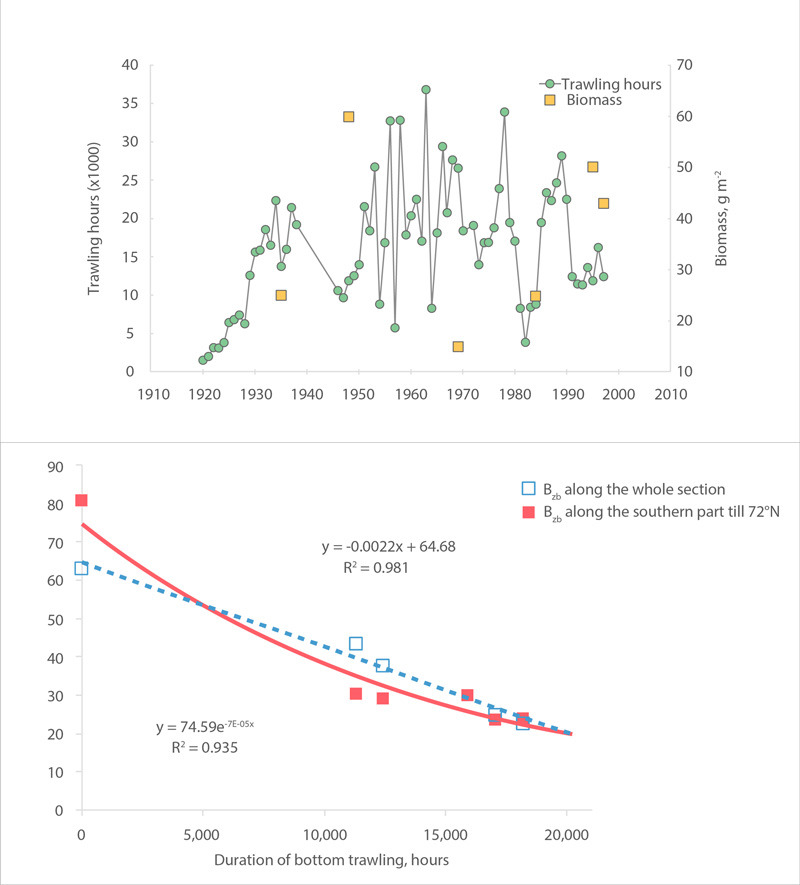
Variation of average annual trawling activity (in hours) and macrobenthic biomass (g m-2), (a) and relationship of biomass with a four-year lag (mean value of time of the turnover in biomass value) to trawling activity, (b) along the Kola section of the Barents Sea during 1920-1997 (Denisenko 2001, 2013). STATE OF THE ARCTIC MARINE BIODIVERSITY REPORT - <a href="https://arcticbiodiversity.is/findings/benthos" target="_blank">Chapter 3</a> - Page 97 - Figure 3.3.5
-
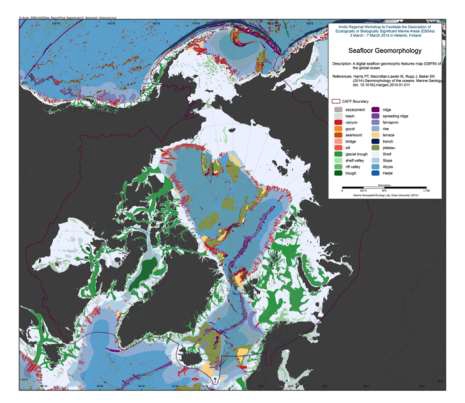
We present the first digital seafloor geomorphic features map (GSFM) of the global ocean. The GSFM includes 131,192 separate polygons in 29 geomorphic feature categories, used here to assess differences between passive and active continental margins as well as between 8 major ocean regions (the Arctic, Indian, North Atlantic, North Pacific, South Atlantic, South Pacific and the Southern Oceans and the Mediterranean and Black Seas). The GSFM provides quantitative assessments of differences between passive and active margins: continental shelf width of passive margins (88 km) is nearly three times that of active margins (31 km); the average width of active slopes (36 km) is less than the average width of passive margin slopes (46 km); active margin slopes contain an area of 3.4 million km2 where the gradient exceeds 5°, compared with 1.3 million km2 on passive margin slopes; the continental rise covers 27 million km2 adjacent to passive margins and less than 2.3 million km2 adjacent to active margins. Examples of specific applications of the GSFM are presented to show that: 1) larger rift valley segments are generally associated with slow-spreading rates and smaller rift valley segments are associated with fast spreading; 2) polar submarine canyons are twice the average size of non-polar canyons and abyssal polar regions exhibit lower seafloor roughness than non-polar regions, expressed as spatially extensive fan, rise and abyssal plain sediment deposits – all of which are attributed here to the effects of continental glaciations; and 3) recognition of seamounts as a separate category of feature from ridges results in a lower estimate of seamount number compared with estimates of previous workers. Reference: Harris PT, Macmillan-Lawler M, Rupp J, Baker EK Geomorphology of the oceans. Marine Geology.
-
Estimation of diatom assemblage changes over a period of about 200 years (top versus bottom sediment cores). State of the Arctic Freshwater Biodiversity Report - Chapter 4 - Page 41 - Figure 4-14
-
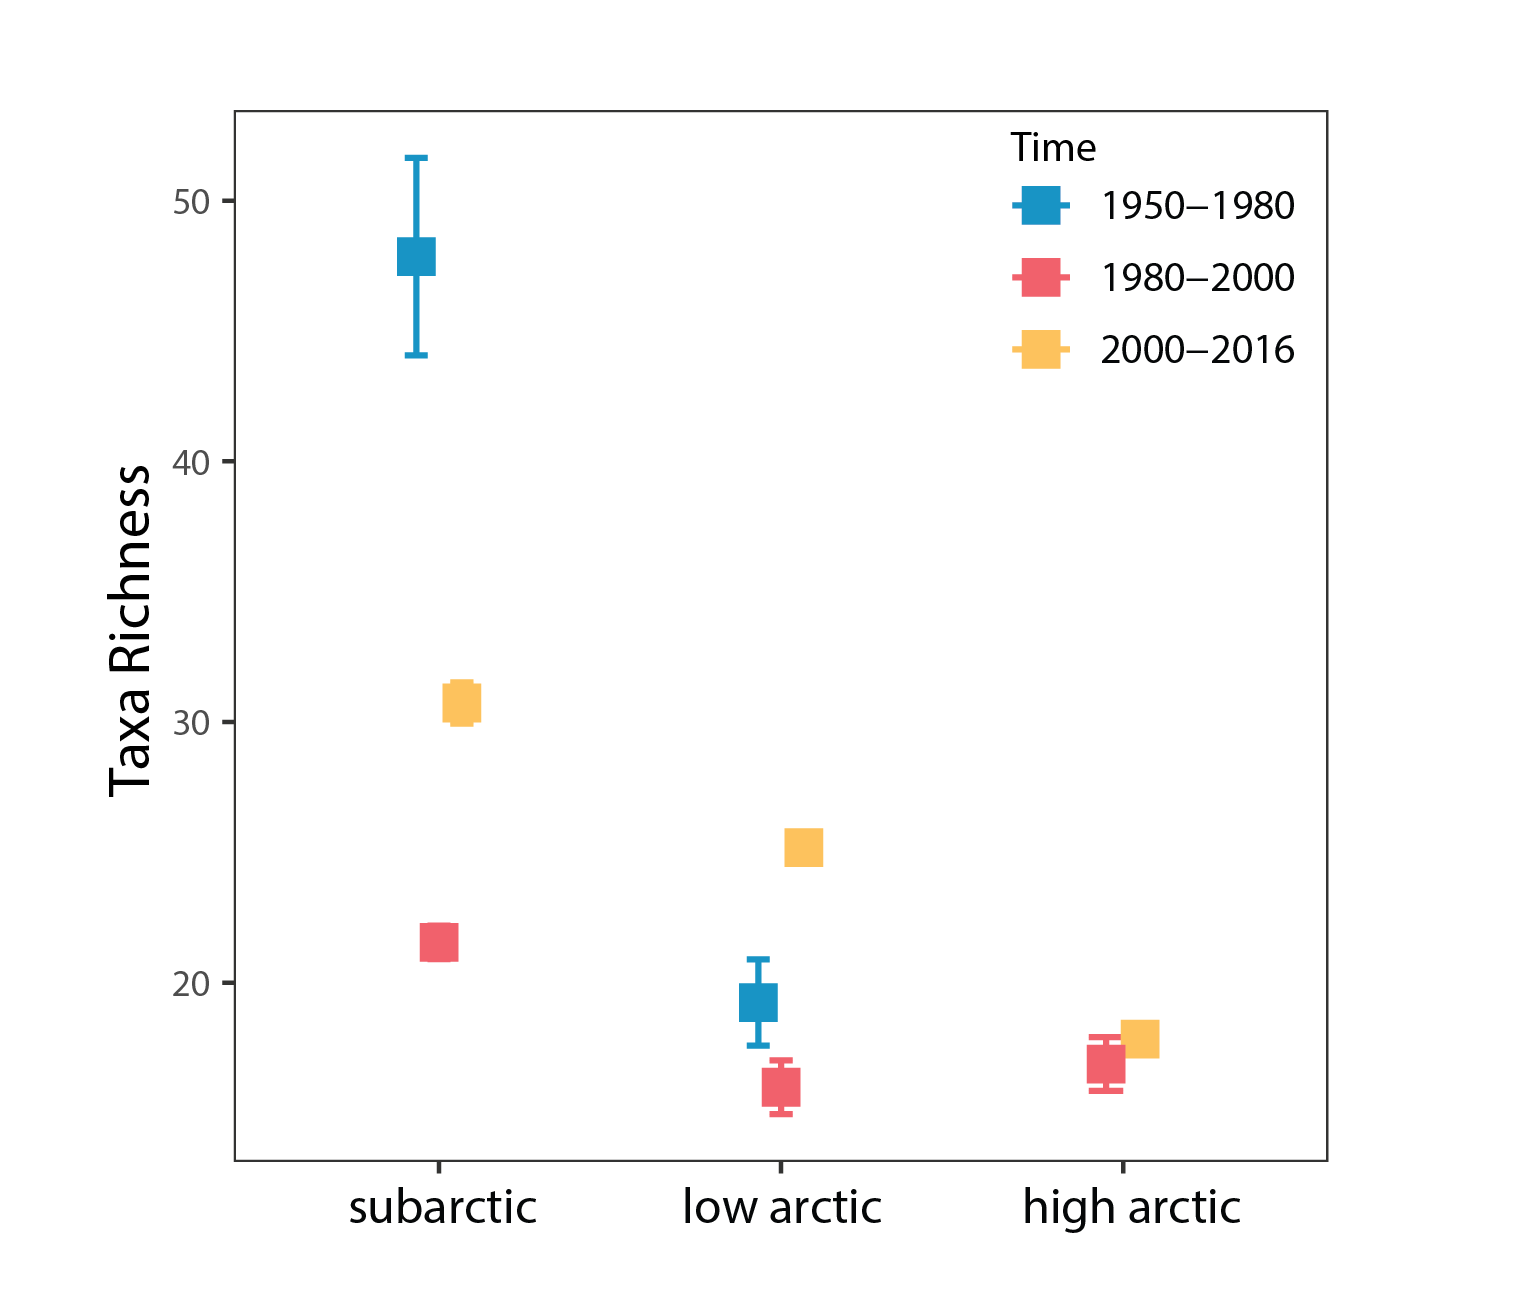
Phytoplankton species richness averaged by time periods ±SE in each Arctic region. State of the Arctic Freshwater Biodiversity Report - Chapter 4 - Page 49 - Figure 4-20
-
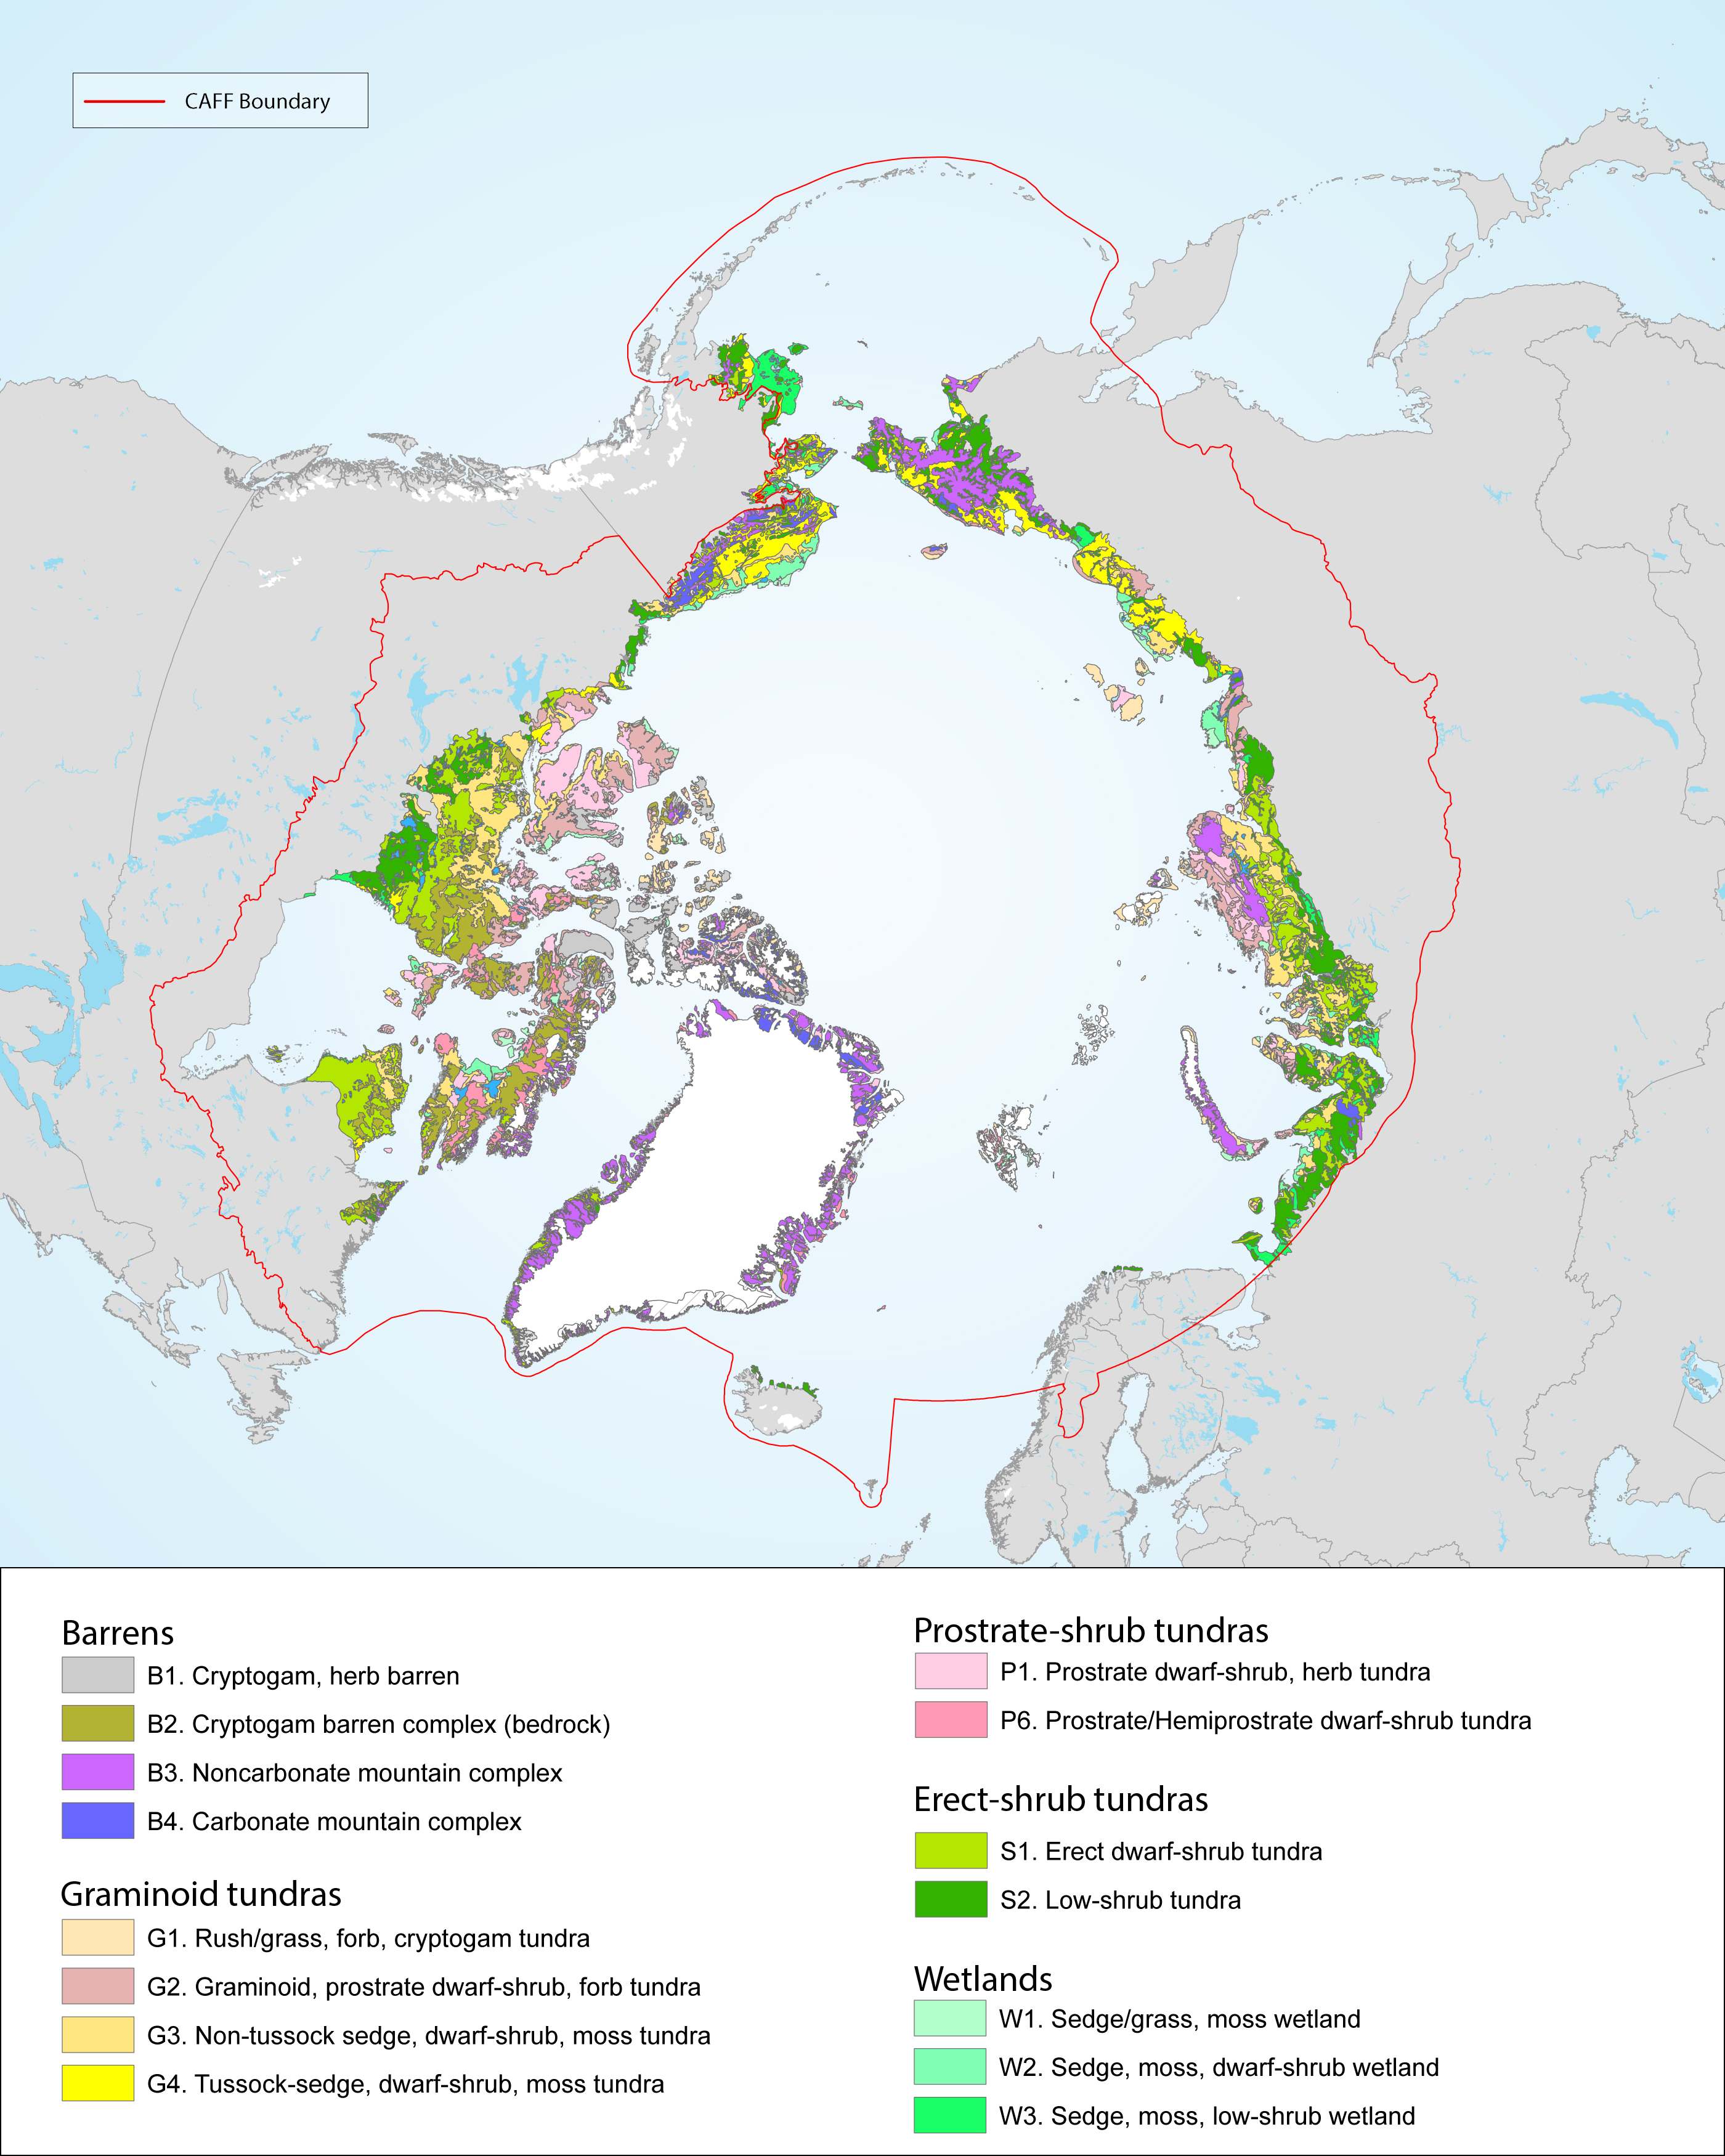
There is a great variation and heterogeneity among terrestrial Arctic ecosystems. This is further described as biogeographical areas in the Annotated Checklist of the Pan-Arctic Flora (Elven et al. 2020), as vegetation zones (Walker et al. 2005, Raynolds et al 2019) or as ecoregions recognised by Terrestrial Ecoregions of the World (Olson et al. 2001). The START focuses on high and low Arctic regions consistent with the CAVM’s subzones A to E, as shown in Figure 1-2 and Figure 2-1 STATE OF THE ARCTIC TERRESTRIAL BIODIVERSITY REPORT - Chapter 2 - Page 19 - Figure 2.1
-
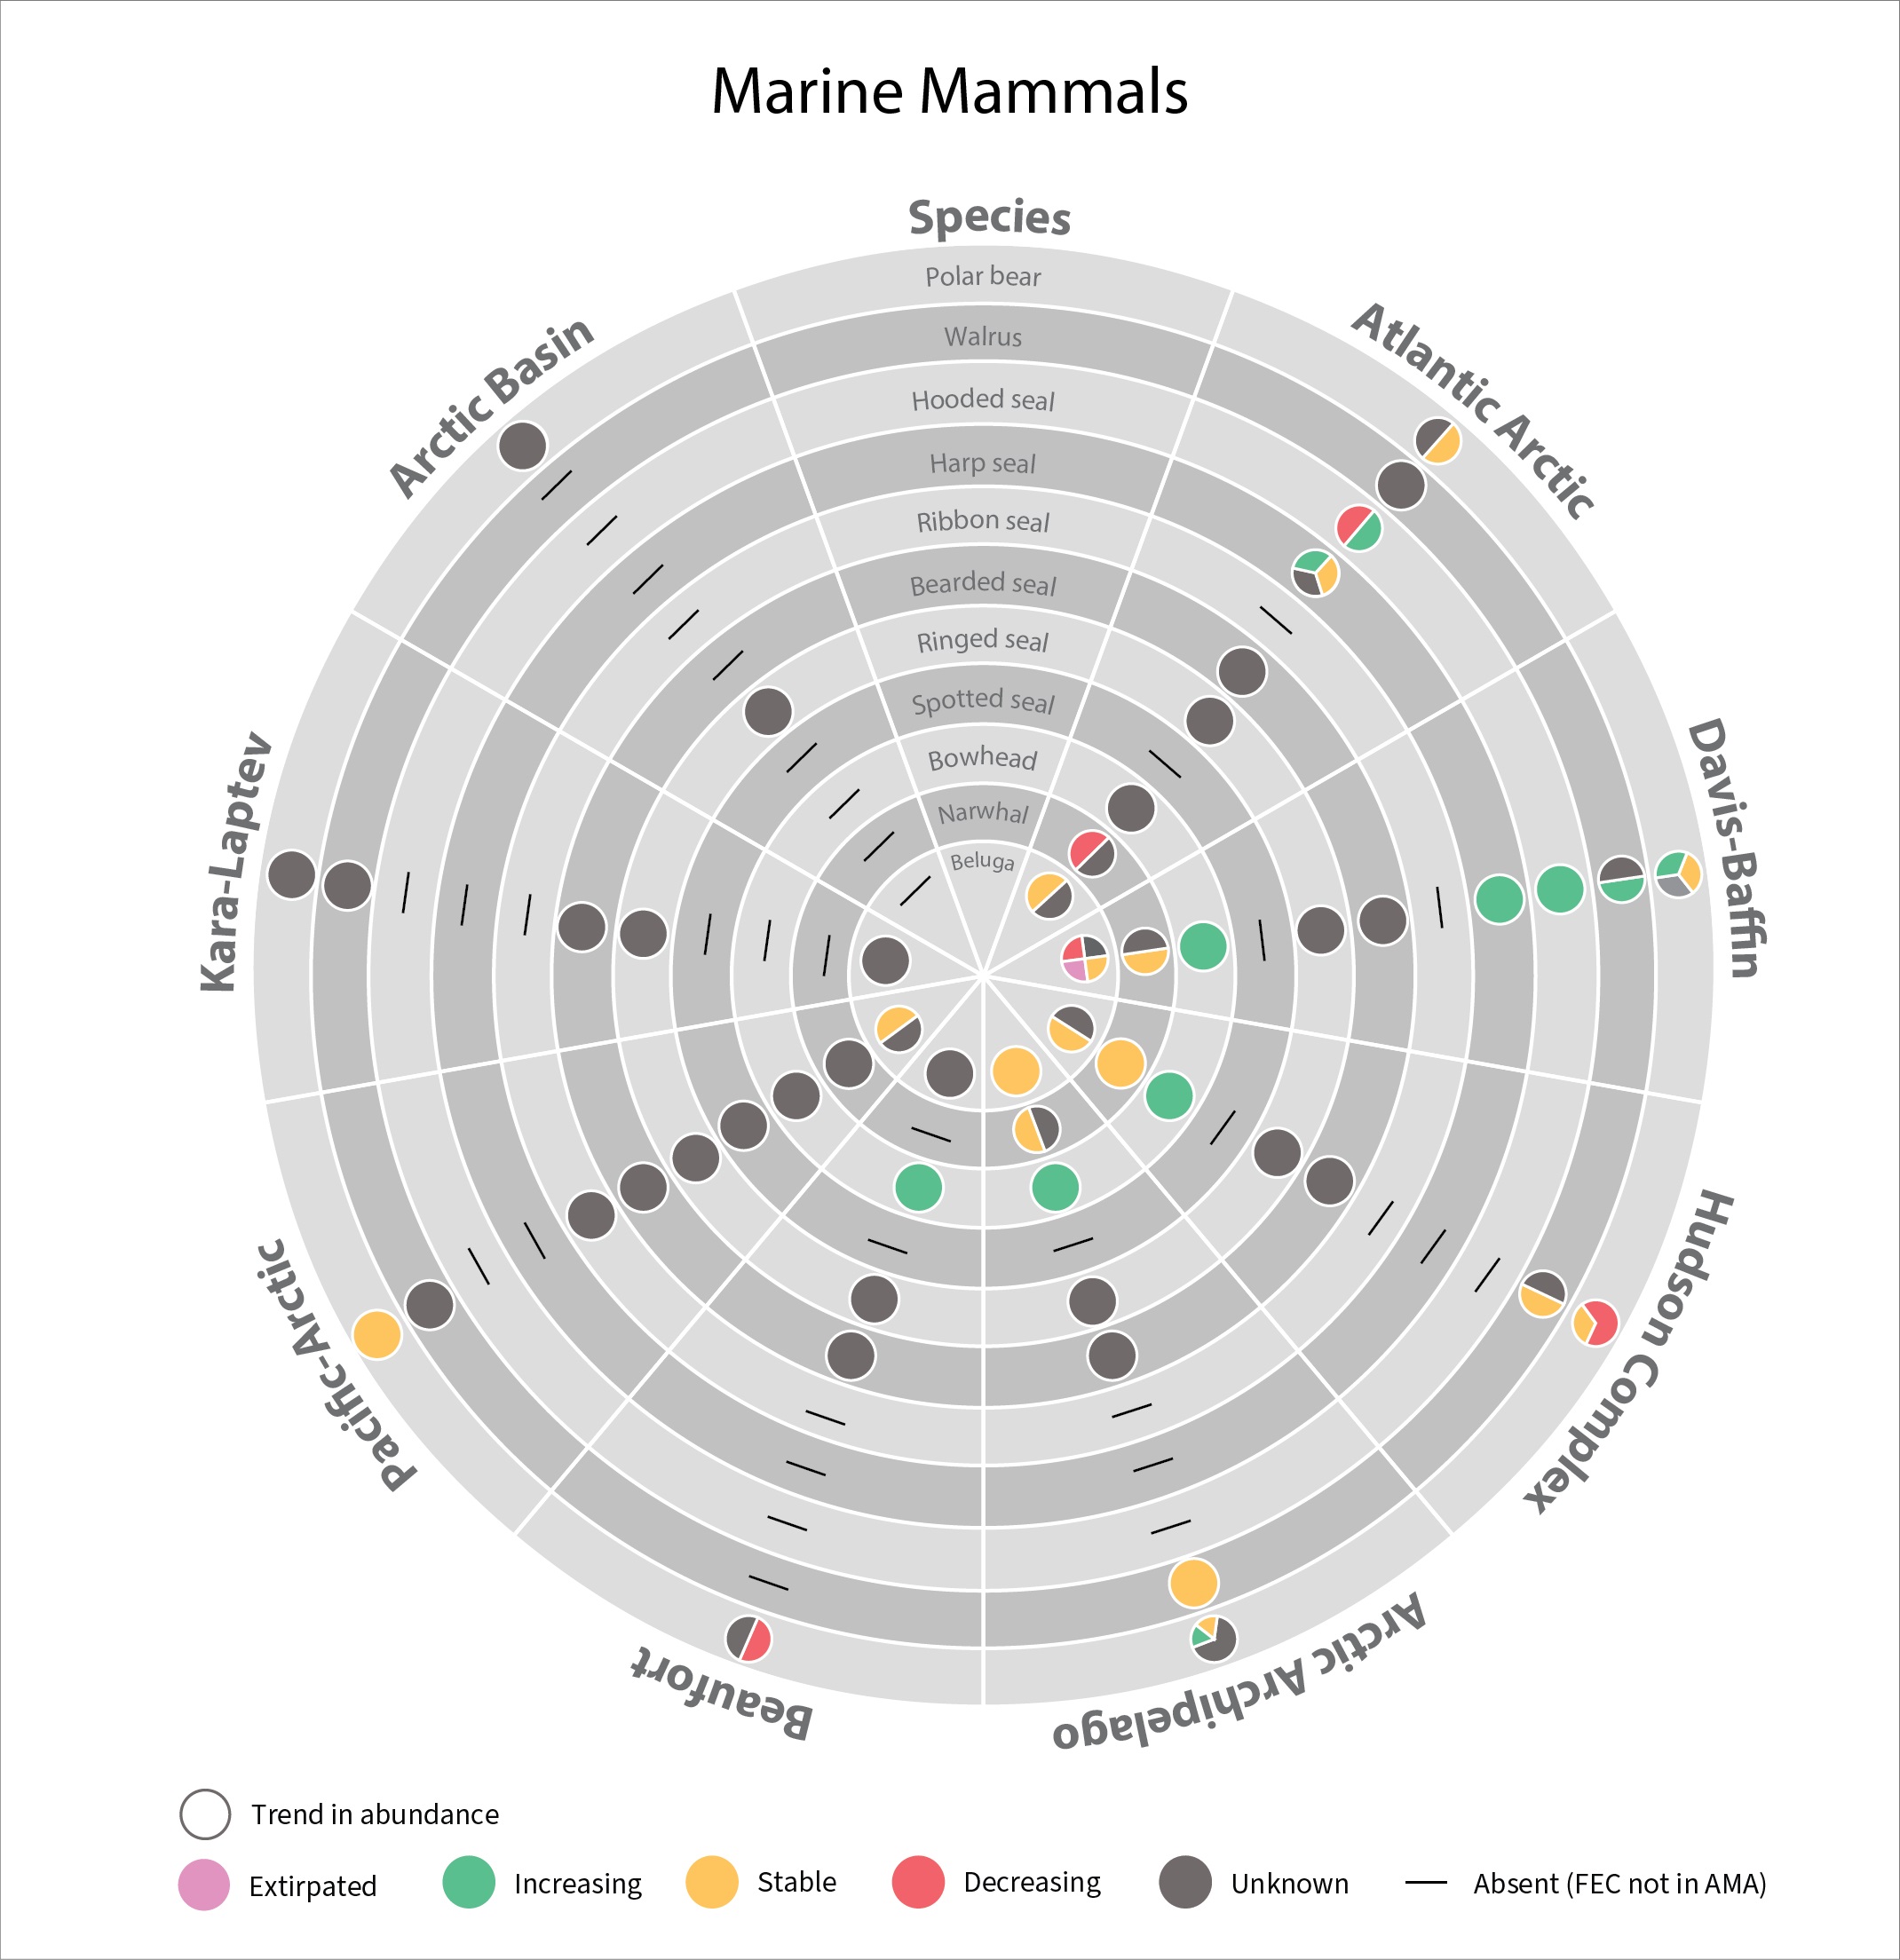
In 2017 the SAMBR synthesized data about biodiversity in Arctic marine ecosystems around the circumpolar Arctic.. SAMBR highlighted observed changes and relevant monitoring gaps. This 2021 update provides information on the status of marine mammals in the Arctic from 2015–2020: More detail can be found in the Marine Mammals 2021 Technical report. STATE OF THE ARCTIC MARINE BIODIVERSITY REPORT