 CAFF - Arctic Biodiversity Data Service (ABDS)
inlandWaters
Type of resources
Available actions
Topics
Keywords
Contact for the resource
Provided by
Representation types
Update frequencies
status
-

Figure 4 17 Results of circumpolar assessment of lake phytoplankton,(a) the location of phytoplankton stations, underlain by circumpolar ecoregions; (b) ecoregions with many phytoplankton stations, colored on the basis of alpha diversity rarefied to 35 stations; (c) all ecoregions with phytoplankton stations, colored on the basis of alpha diversity rarefied to 10 stations; (d) ecoregions with at least two stations in a hydrobasin, colored on the basis of the dominant component of beta diversity (species turnover, nestedness, approximately equal contribution, or no diversity) when averaged across hydrobasins in each ecoregion. State of the Arctic Freshwater Biodiversity Report - Chapter 4 - Page 56 - Figure 4-17
-
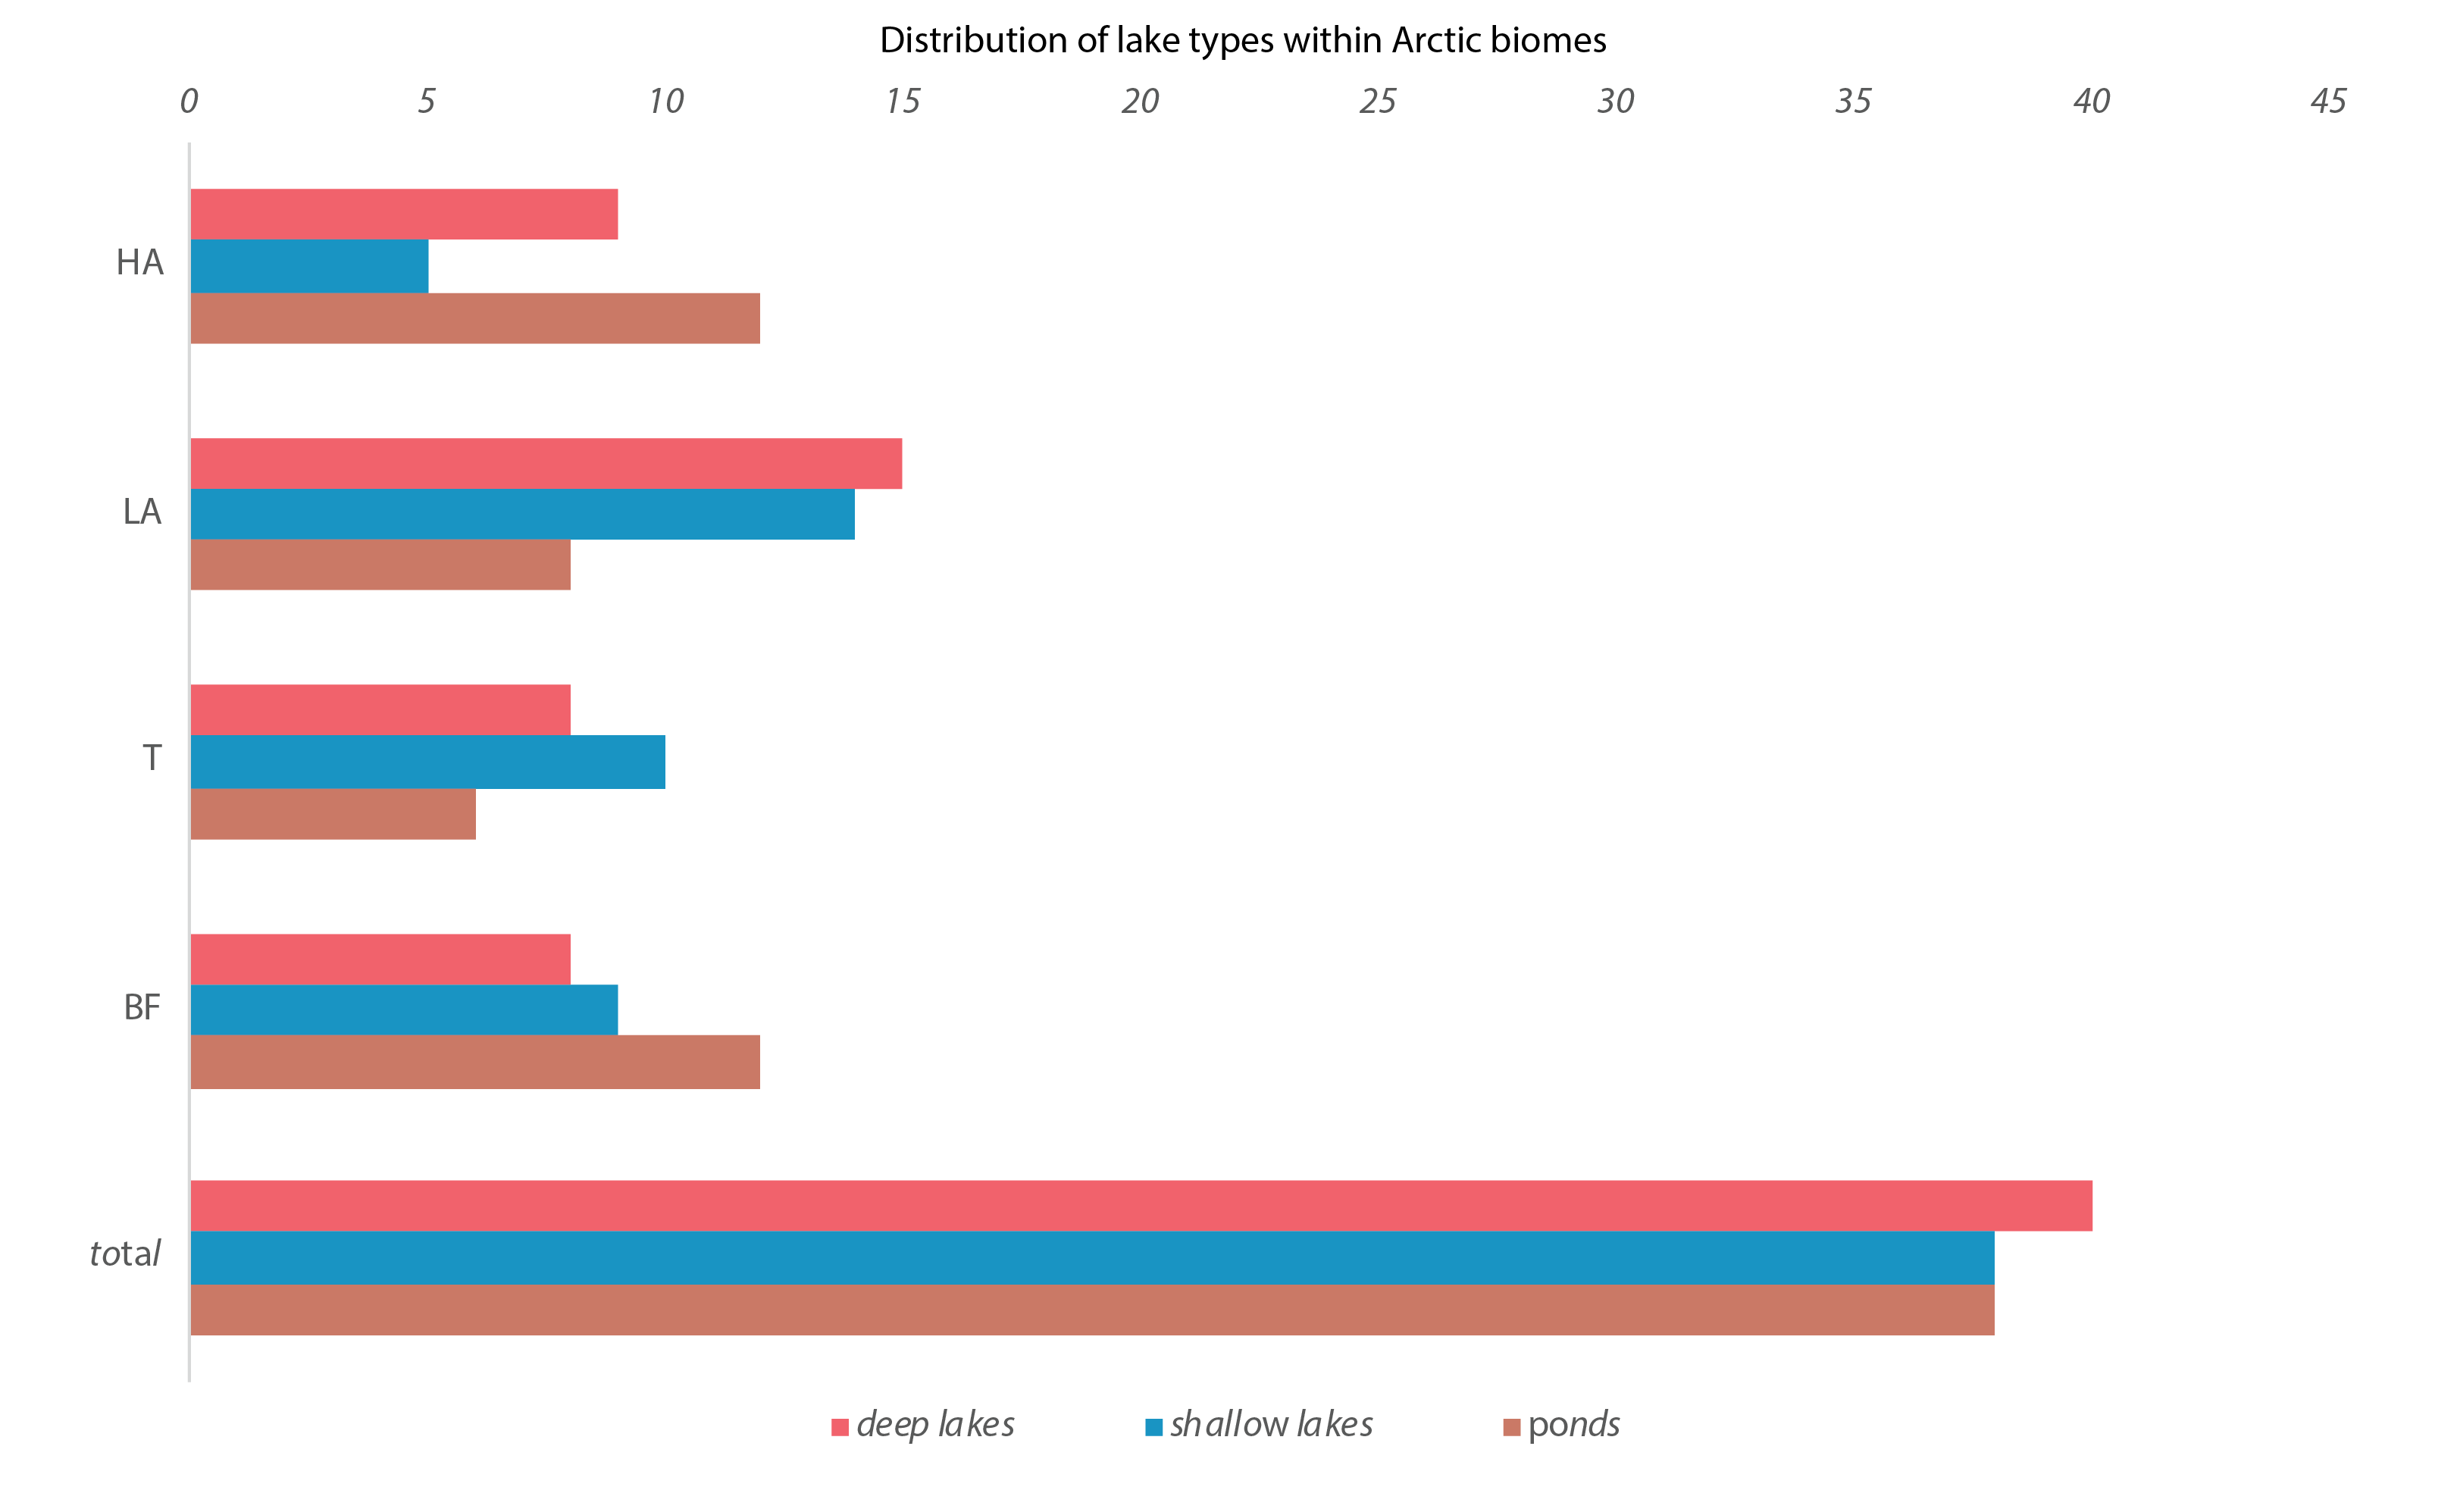
Figure 4-13 Number of deep lakes (red), shallow lakes (blue), and ponds (brown) in each geographical zone (BF, T, LA, HA). BF = Boreal Forest, T =Transition Zone, LA = Low Arctic, HA = High Arctic. State of the Arctic Freshwater Biodiversity Report - Chapter 4 - Page 40 - Figure 4-13
-
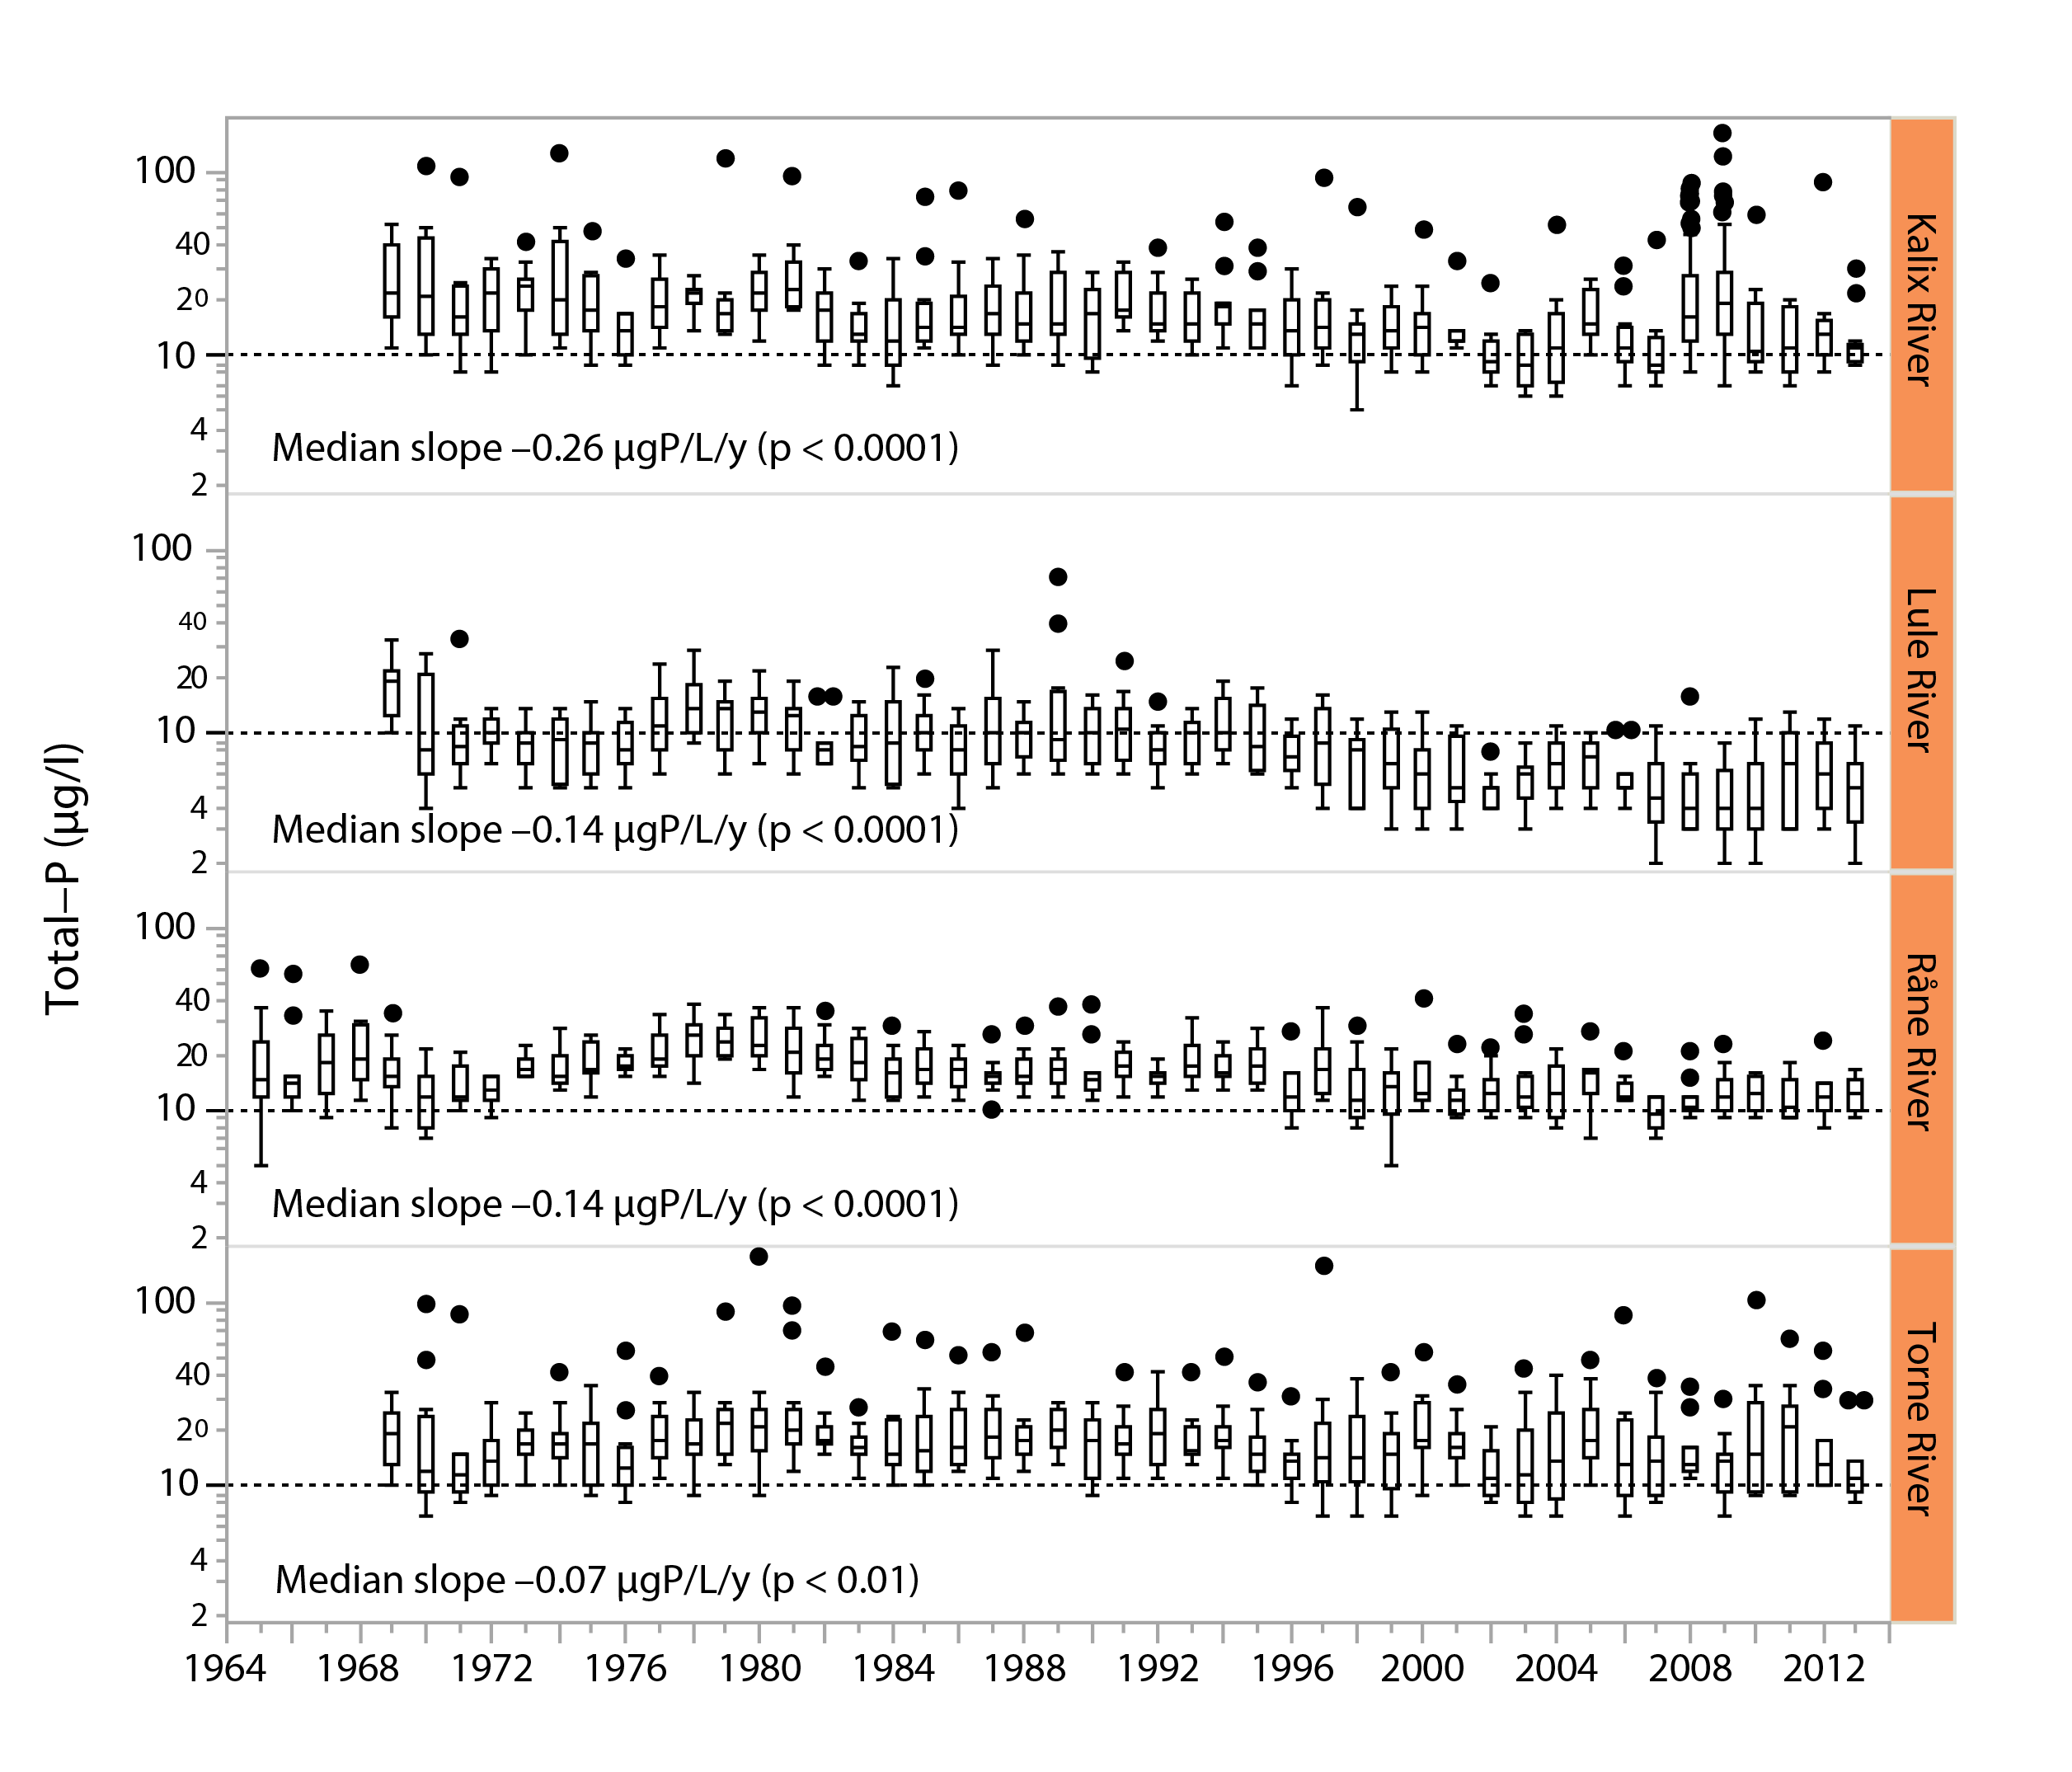
Figure 3-3 Long-term trends in total phosphorus water concentrations (μg/L) in four major, unregulated rivers that drain the subarctic Arctic/alpine ecoregion of the Scandinavian peninsula, the Kalix river, The Lule river, the Råne river, and the Torne river. Slopes and p-values are given in the different panels. Boxes indicate medians and 25th and 75th percentiles, while whiskers give the 10th and 90th percentiles. State of the Arctic Freshwater Biodiversity Report - Chapter 3 - Page 21 - Figure 3-3
-
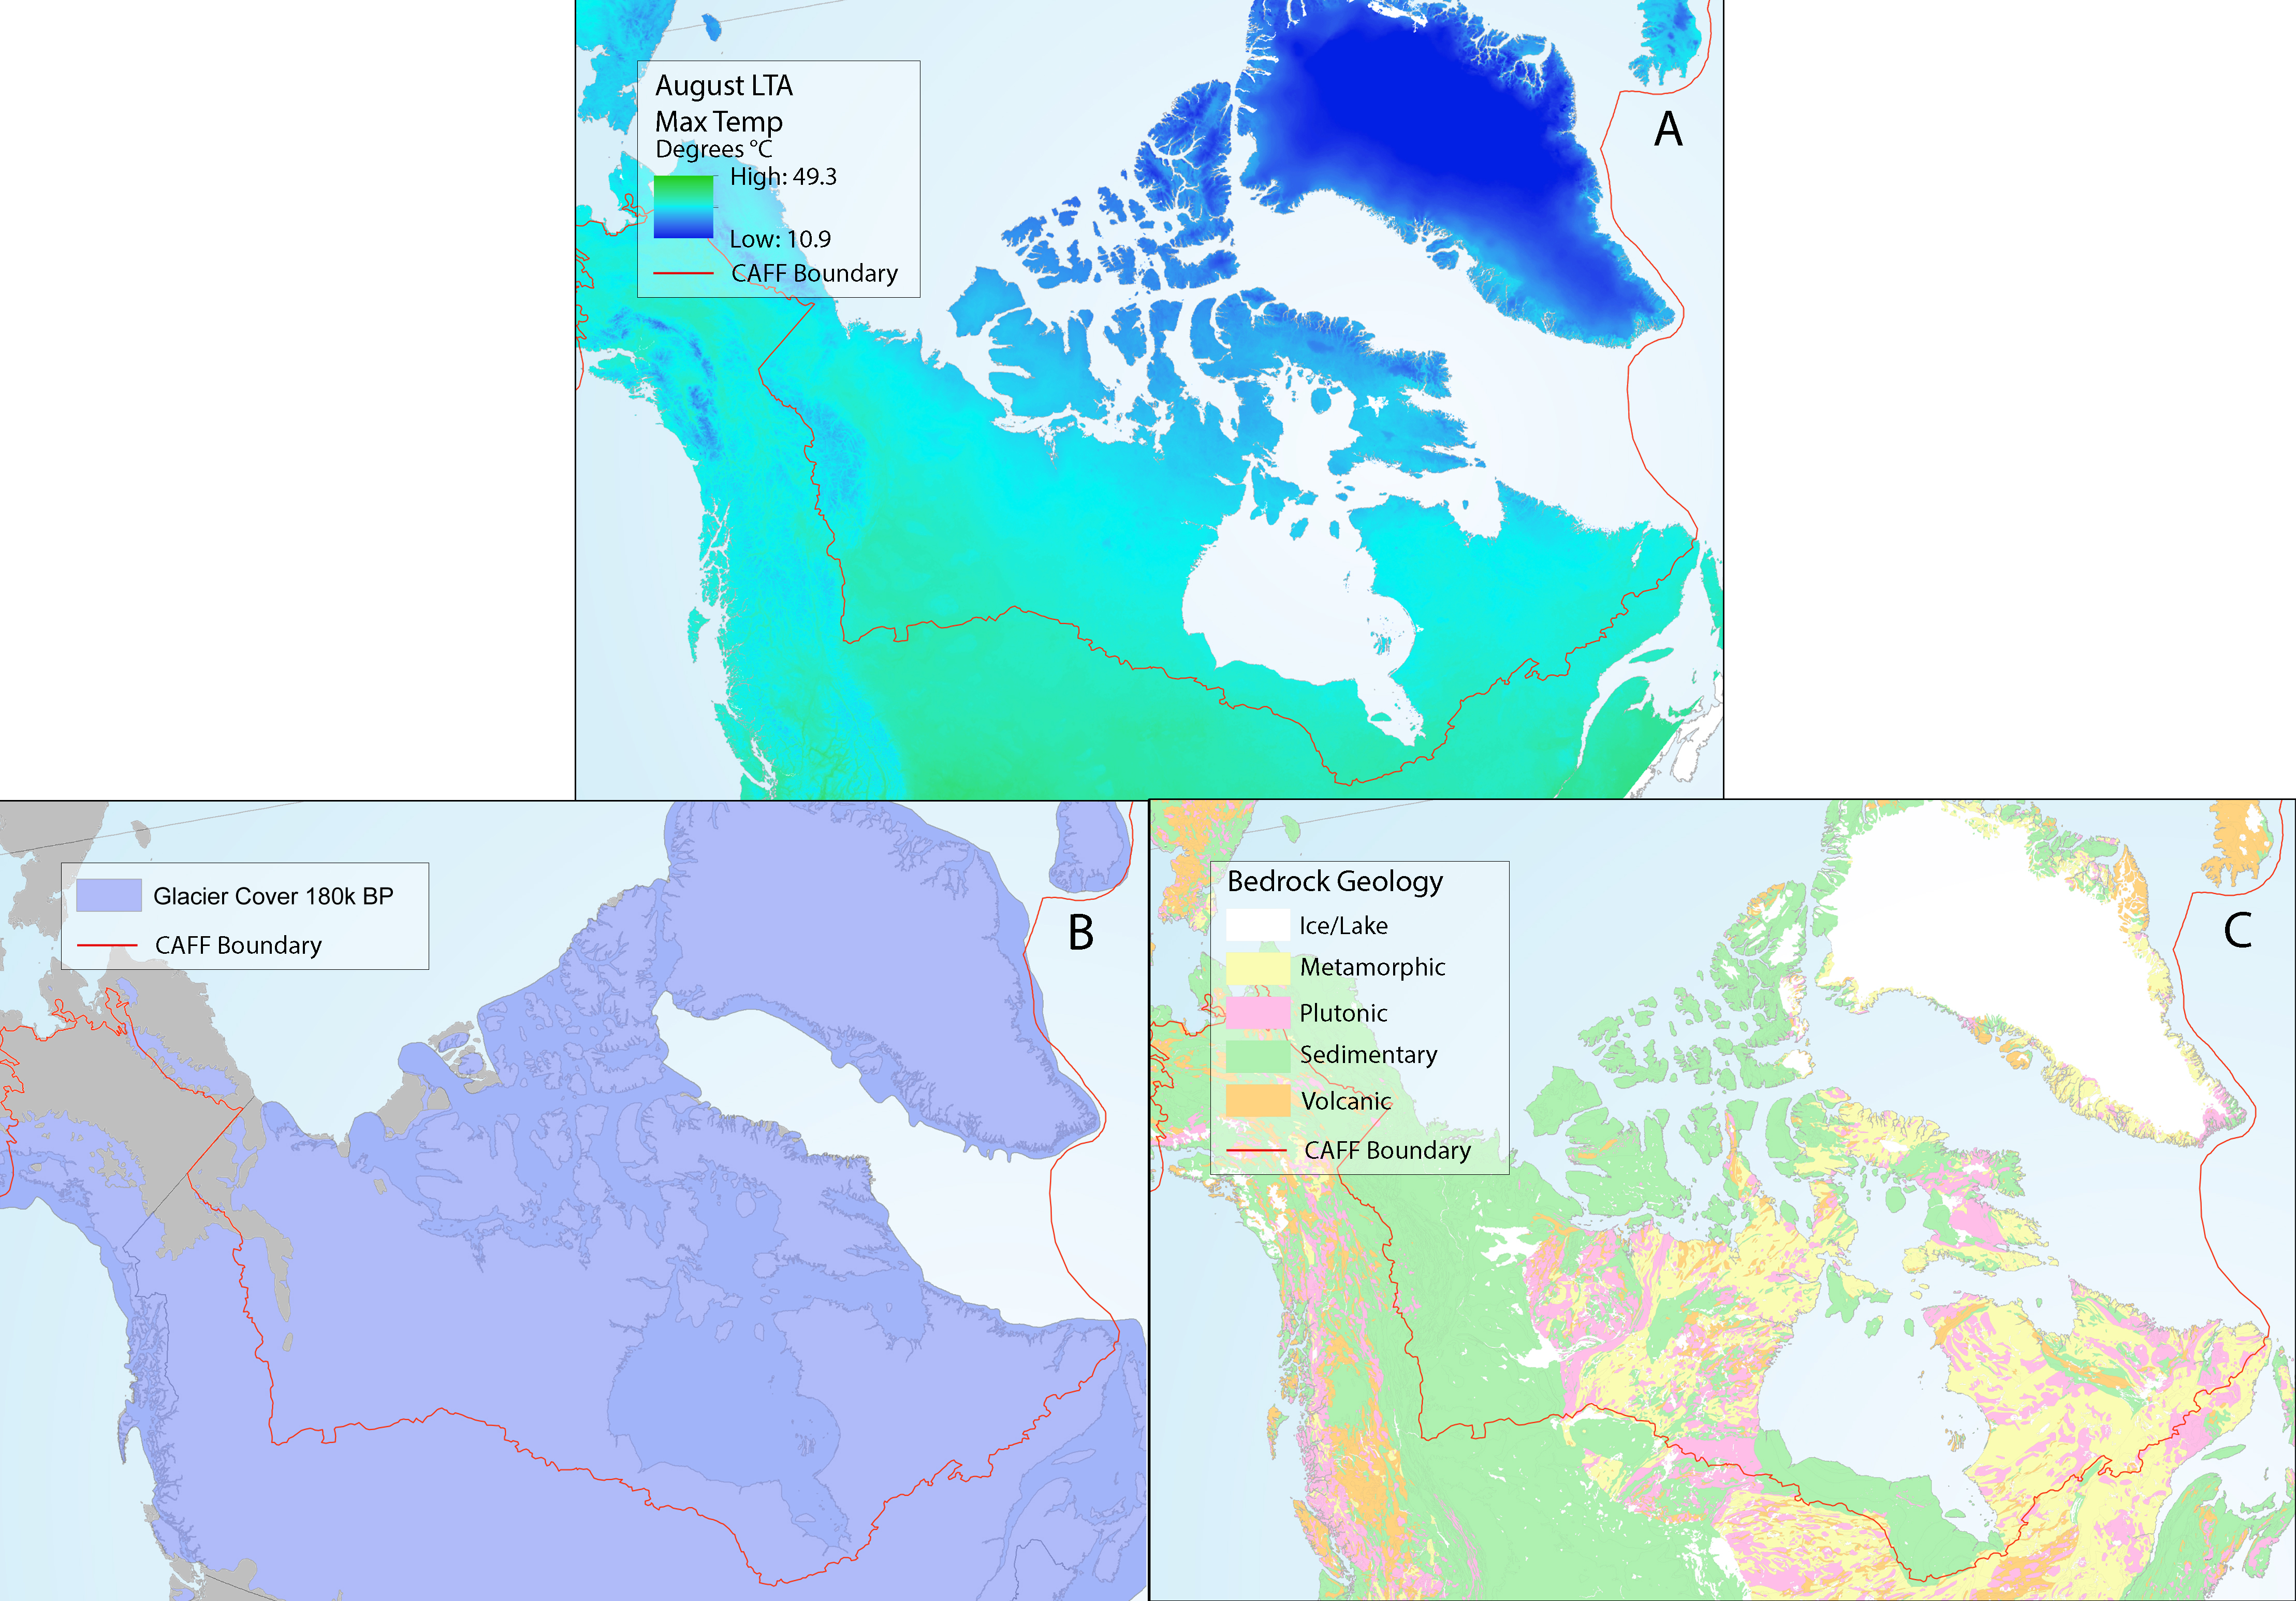
Abiotic drivers in North America, including (a) long-term average maximum August air temperature, (b) spatial distribution of ice sheets in the last glaciation of the North American Arctic region, and (c) geological setting of bedrock geology underlying North America. Panel (a) source Fick and Hijmans (2017). Panel (b) adapted from: Physical Geology by Steve Earle, freely available at http://open.bccampus.ca. Panel (c) source: Geogratis. State of the Arctic Freshwater Biodiversity Report - Chapter 5 - Page 86 - Figure 5-3
-
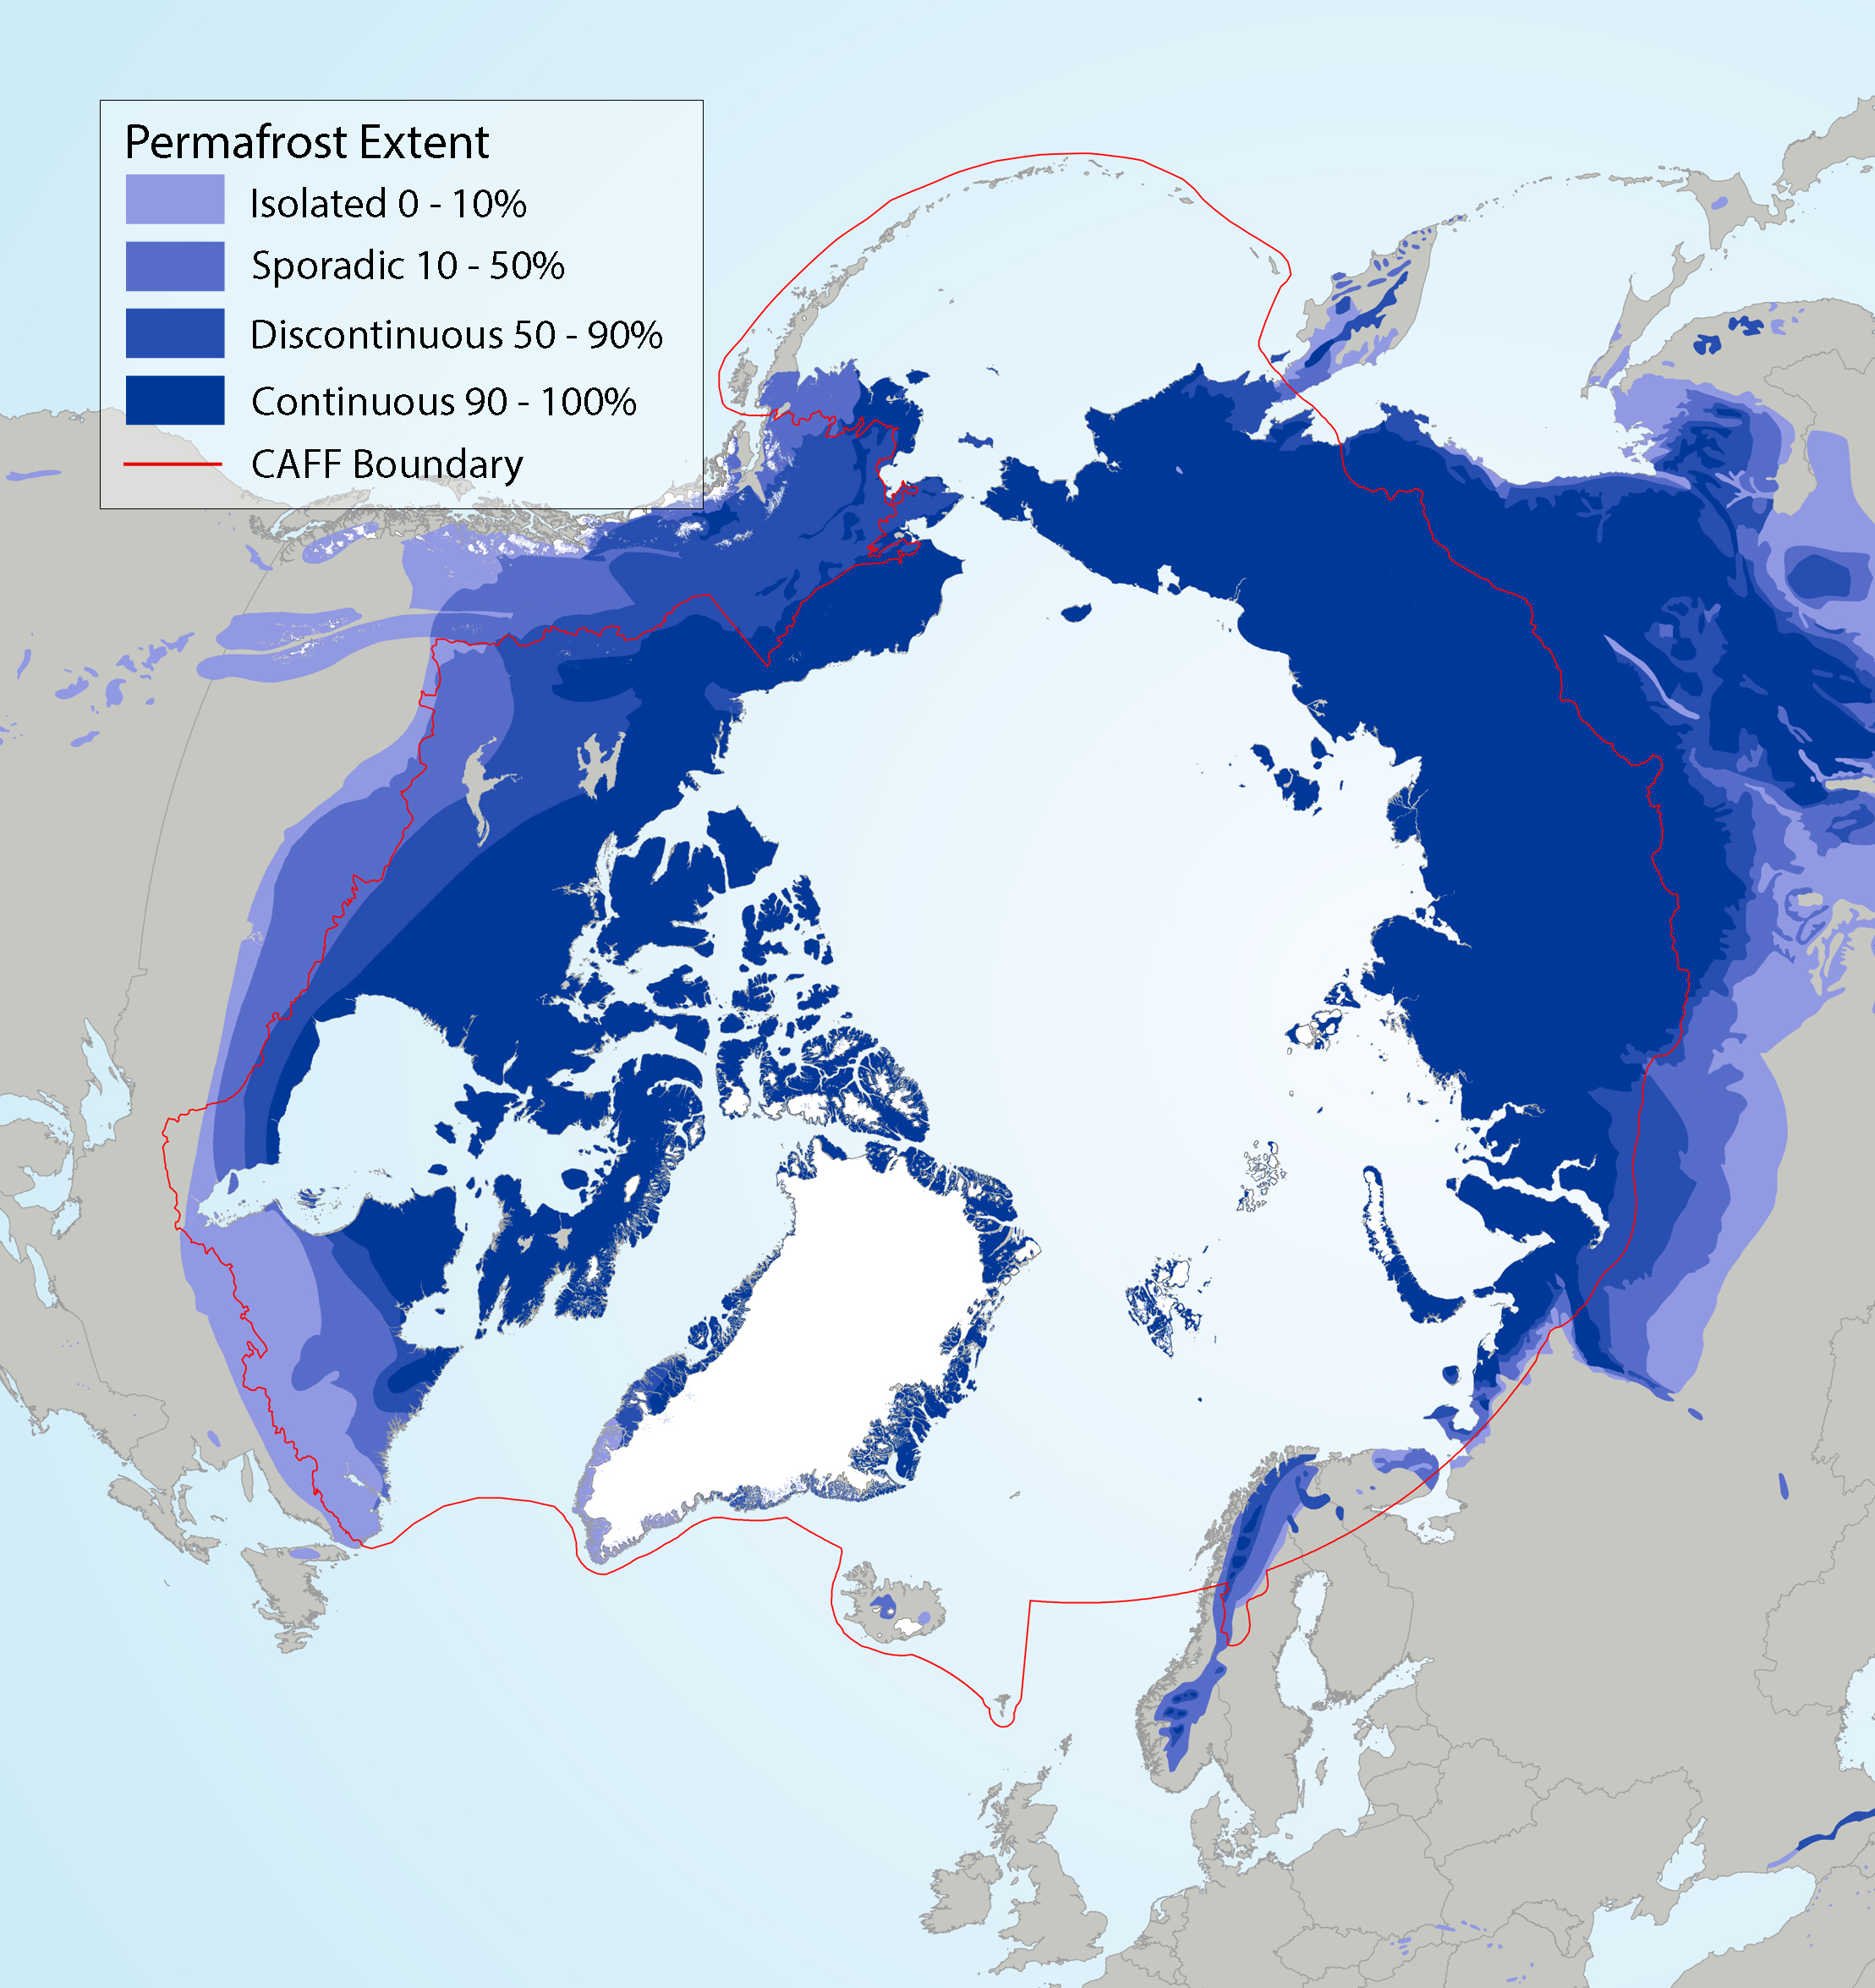
Circumpolar permafrost extent overlain on ecoregions used in SAFBR analysis, indicating continuous (90-100%), discontinuous (50-90%), sporadic (10-50%), and isolated (0-10%) permafrost extent. Source for permafrost layer: Brown et al. (2002). State of the Arctic Freshwater Biodiversity Report - Chapter 5 - Page 89 - Figure 5-6
-
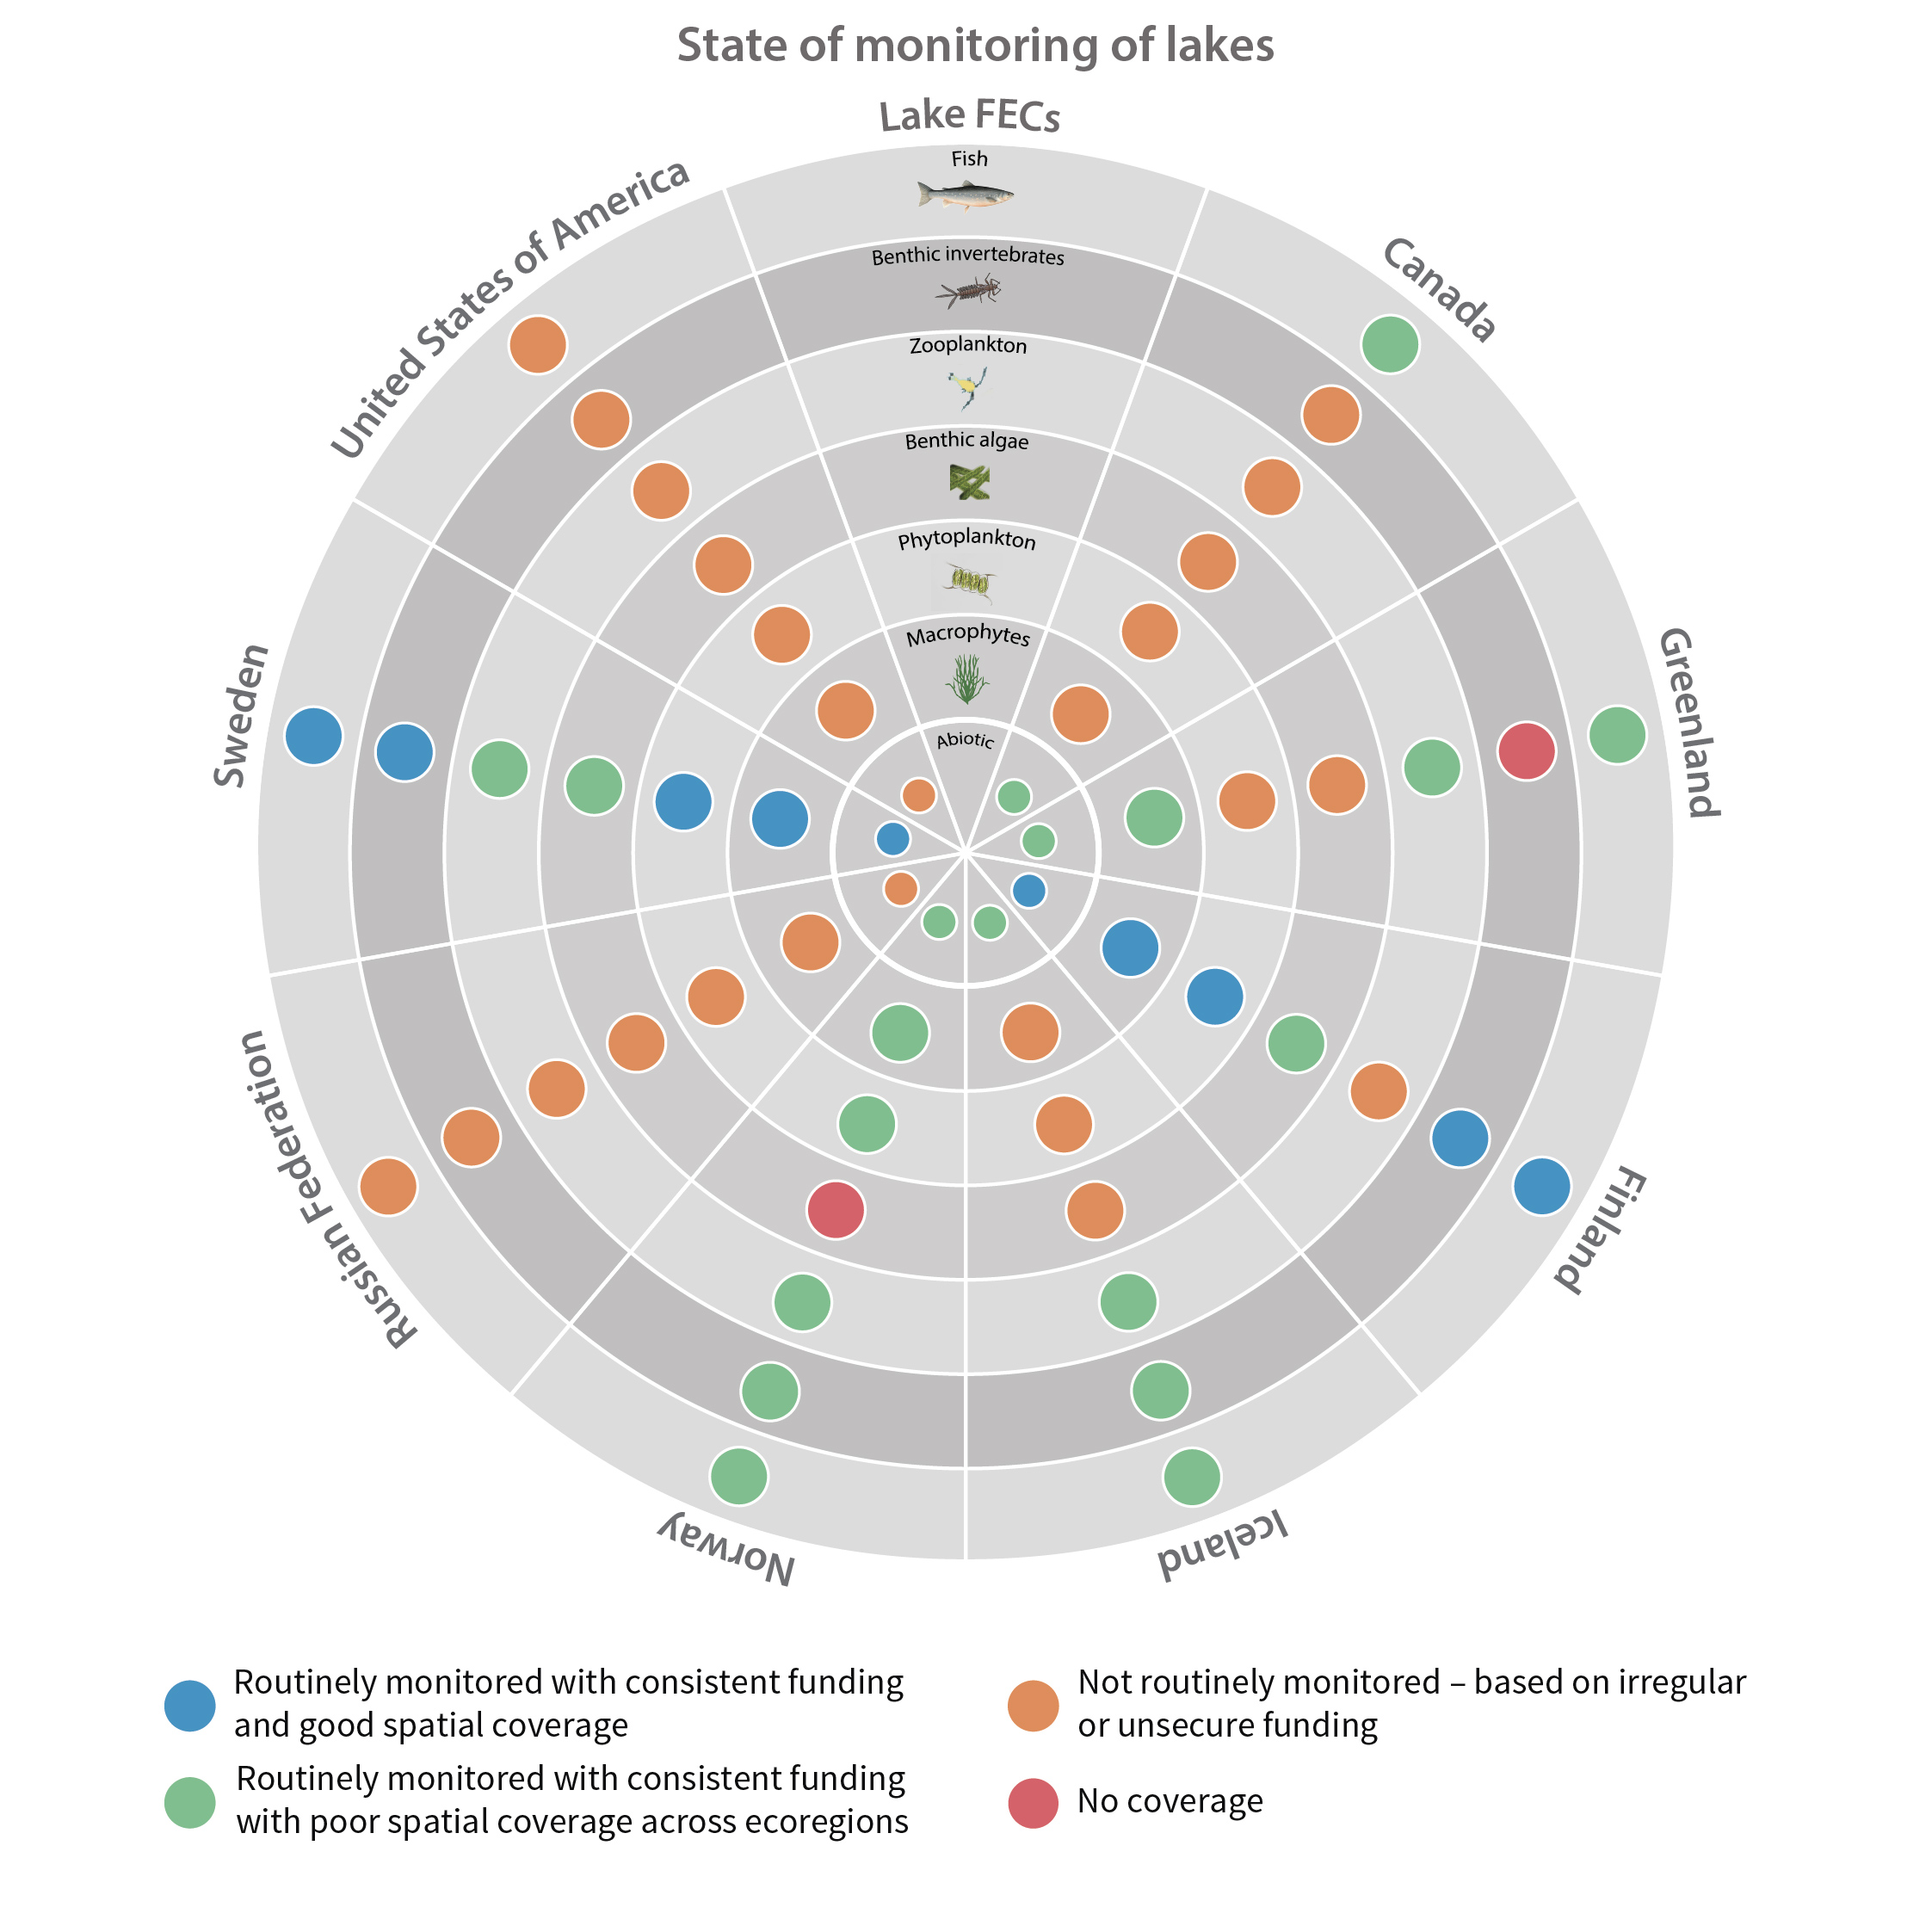
Although the circumpolar countries endeavor to support monitoring programs that provide good coverage of Arctic and subarctic regions, this ideal is constrained by the high costs associated with repeated sampling of a large set of lakes and rivers in areas that often are very remote. Consequently, freshwater monitoring has sparse, spatial coverage in large parts of the Arctic, with only Fennoscandia and Iceland having extensive monitoring coverage of lakes and streams Figure 6-1 Current state of monitoring for lake FECs in each Arctic country. State of the Arctic Freshwater Biodiversity Report - Chapter 6 - Page 93 - Figure 6-1
-
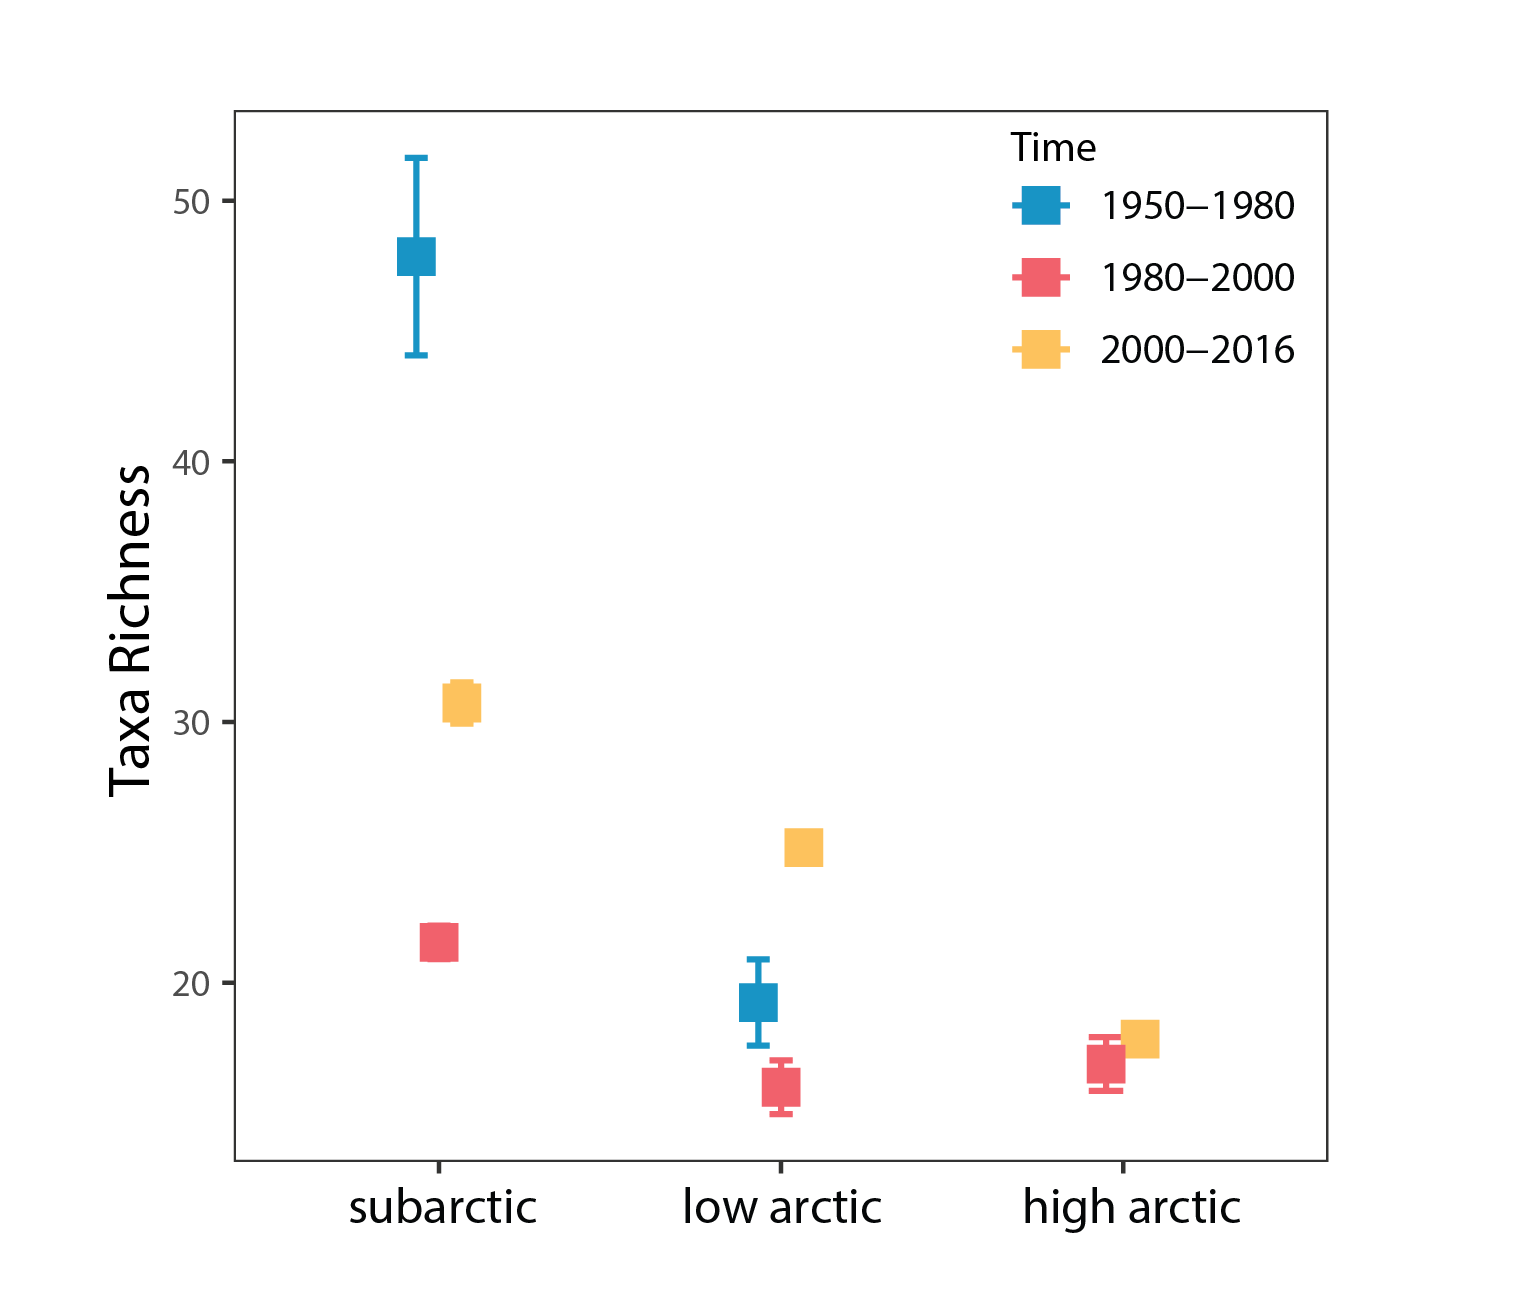
Phytoplankton species richness averaged by time periods ±SE in each Arctic region. State of the Arctic Freshwater Biodiversity Report - Chapter 4 - Page 49 - Figure 4-20
-
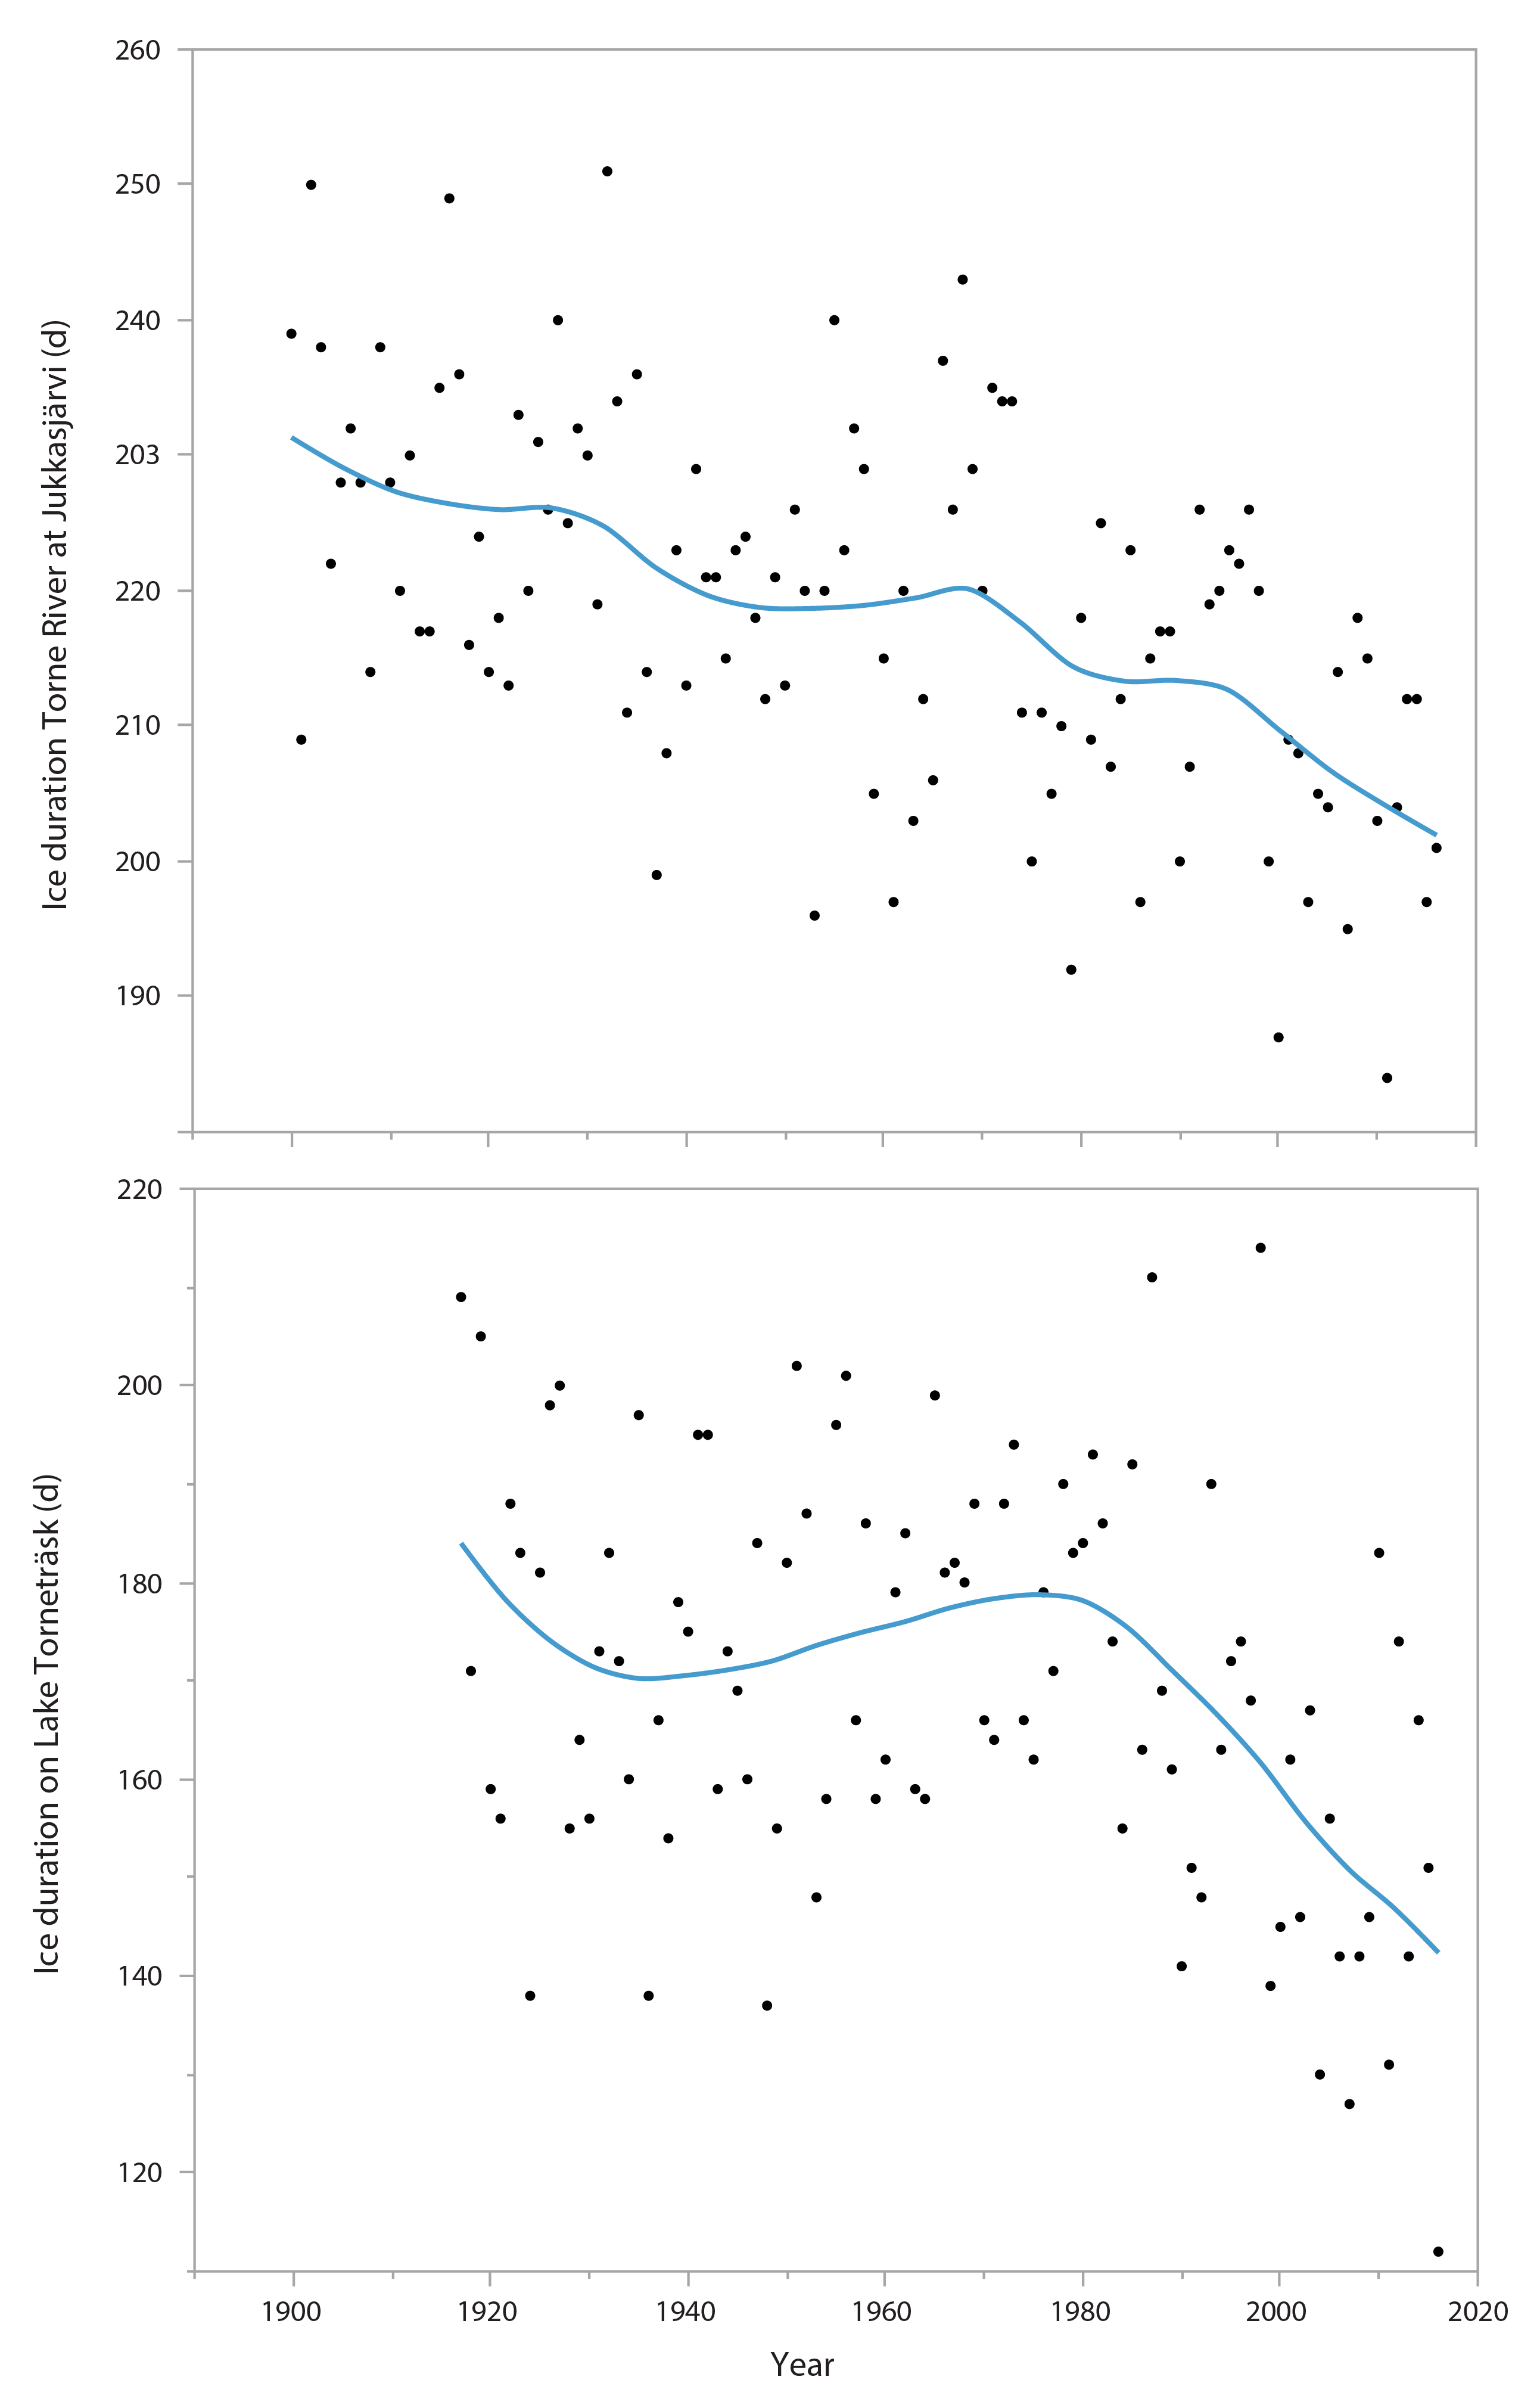
Figure 3-1 Long-term trends in ice duration (as days) in the River Torne (upper plot) and Lake Torneträsk (lower plot) at 68° north on the Scandinavian peninsula. Lines show smooth fit. Data source: Swedish Meteorological and Hydrological Institute. State of the Arctic Freshwater Biodiversity Report - Chapter 3 - Page 19 - Figure 3-1
-
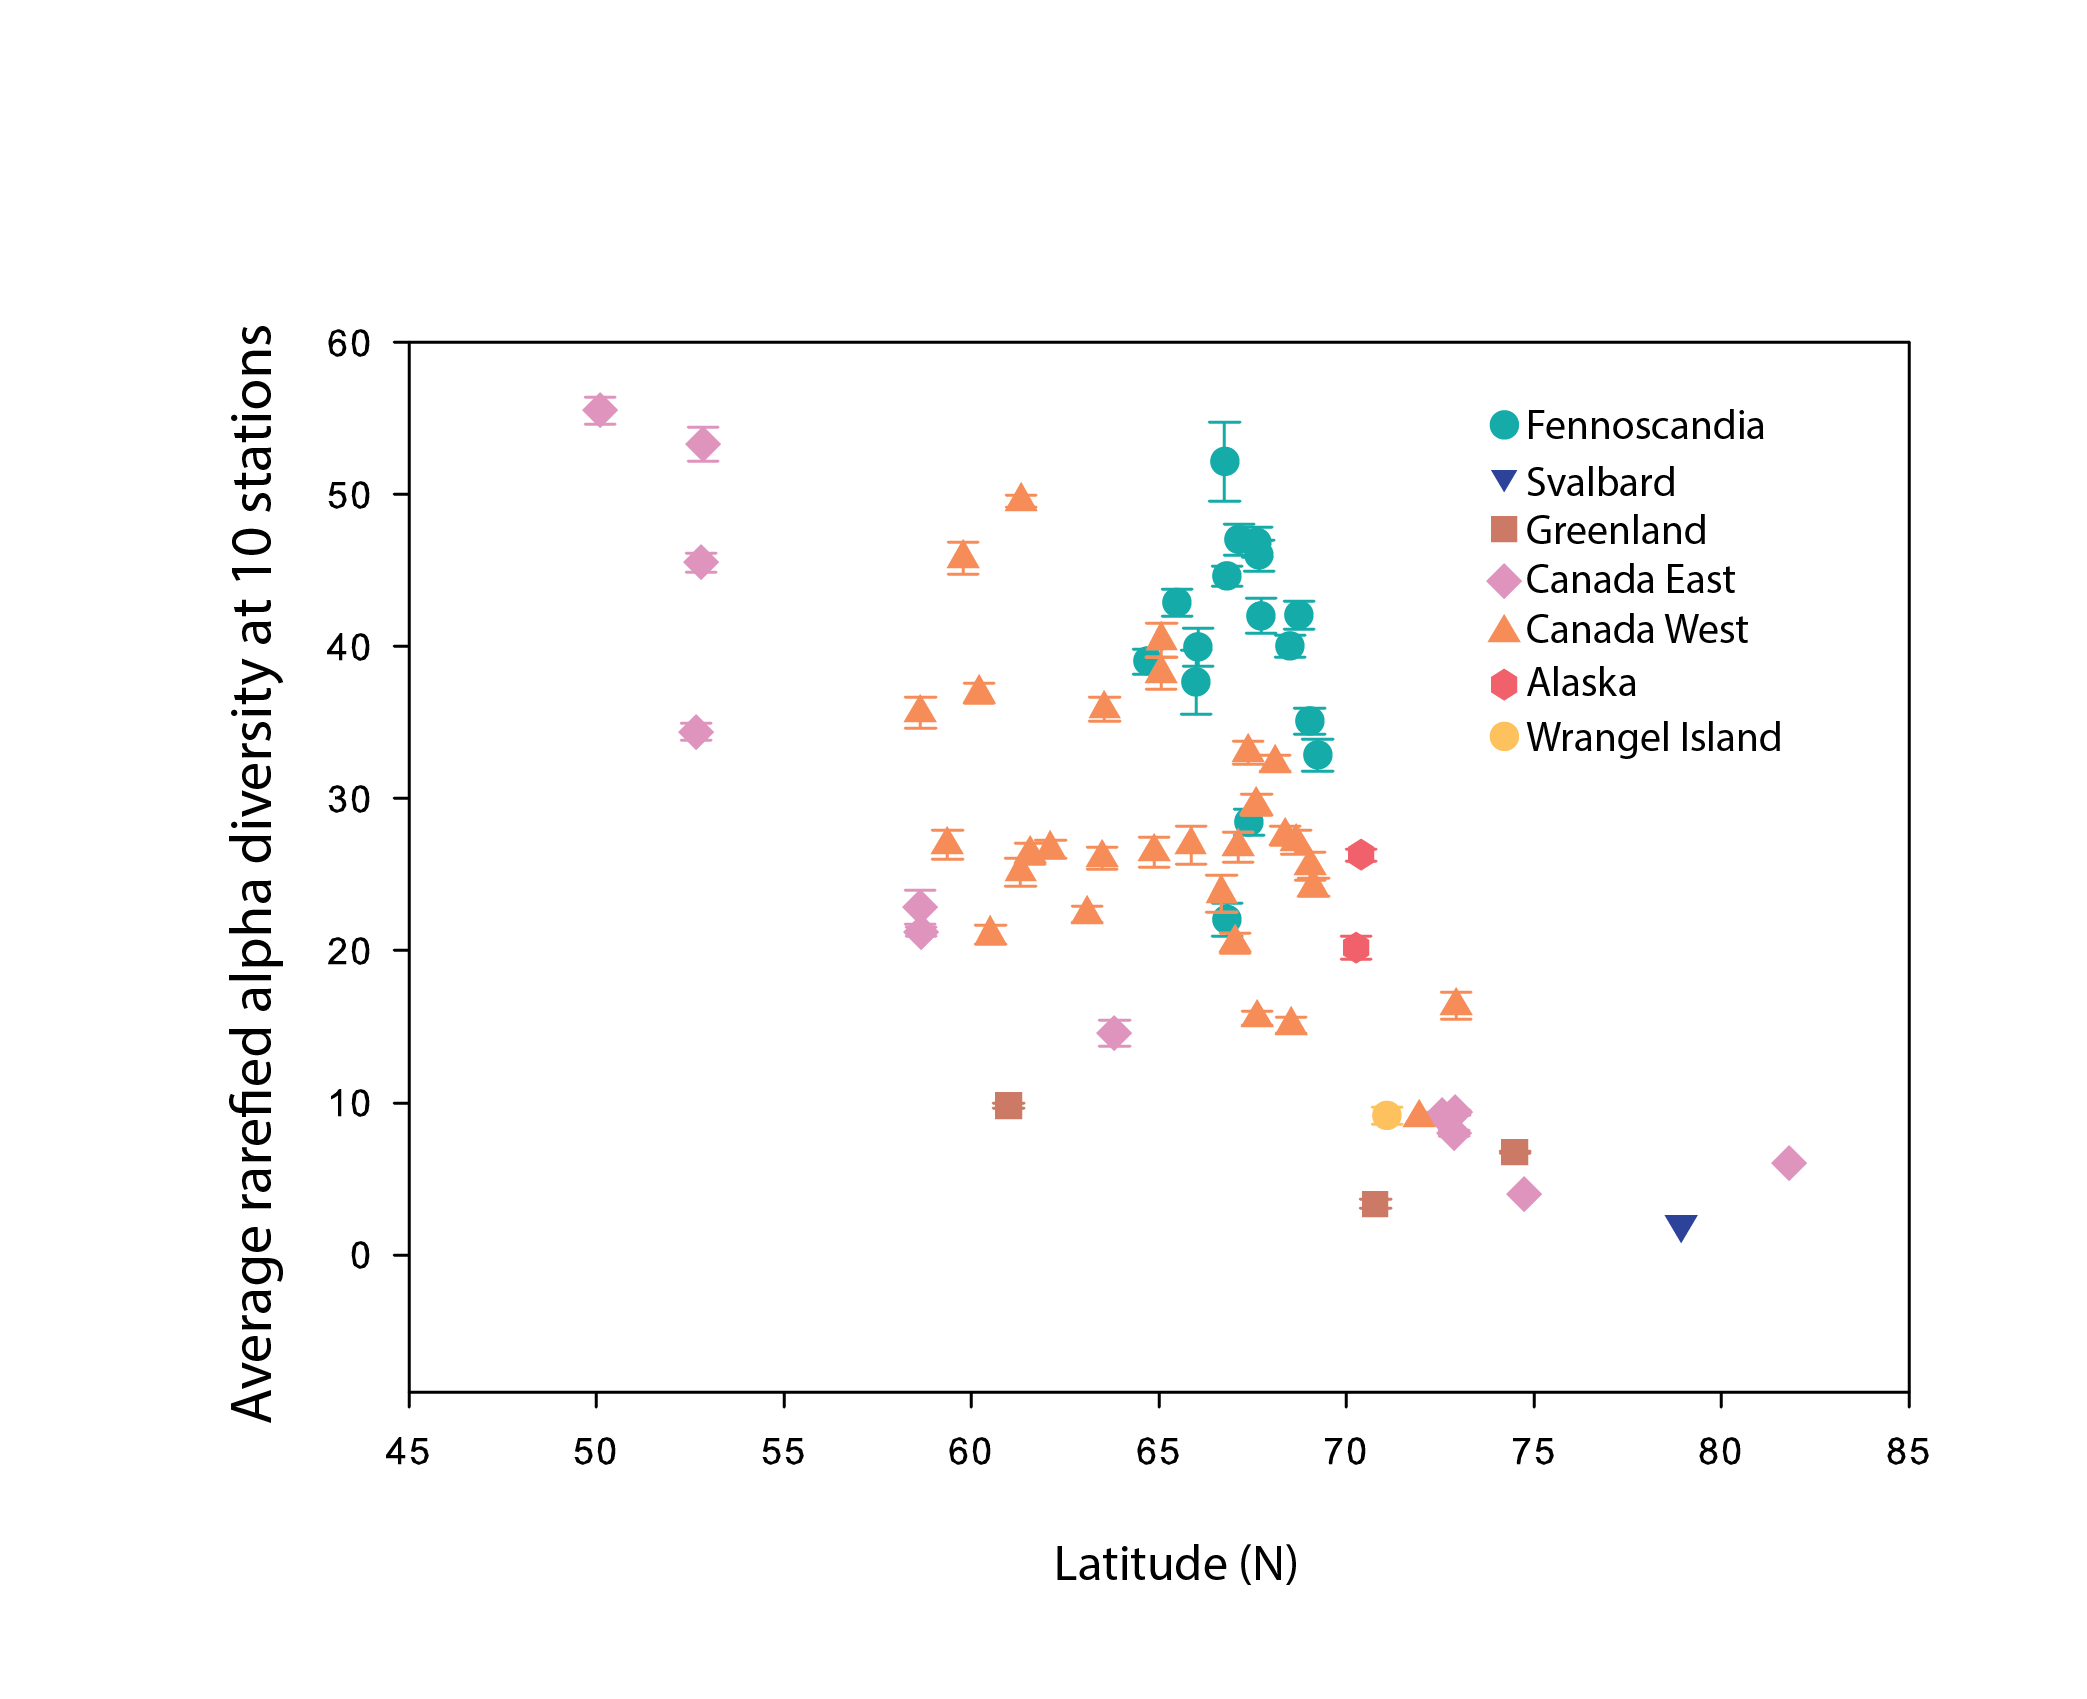
Alpha diversity (rarefied to 10 stations, with error bars indicating standard error) of river benthic macroinvertebrates plotted as a function of the average latitude of stations in each hydrobasin. Hydrobasins are coloured based on country/region State of the Arctic Freshwater Biodiversity Report - Chapter 4 - Page 68 - Figure 4-32
-
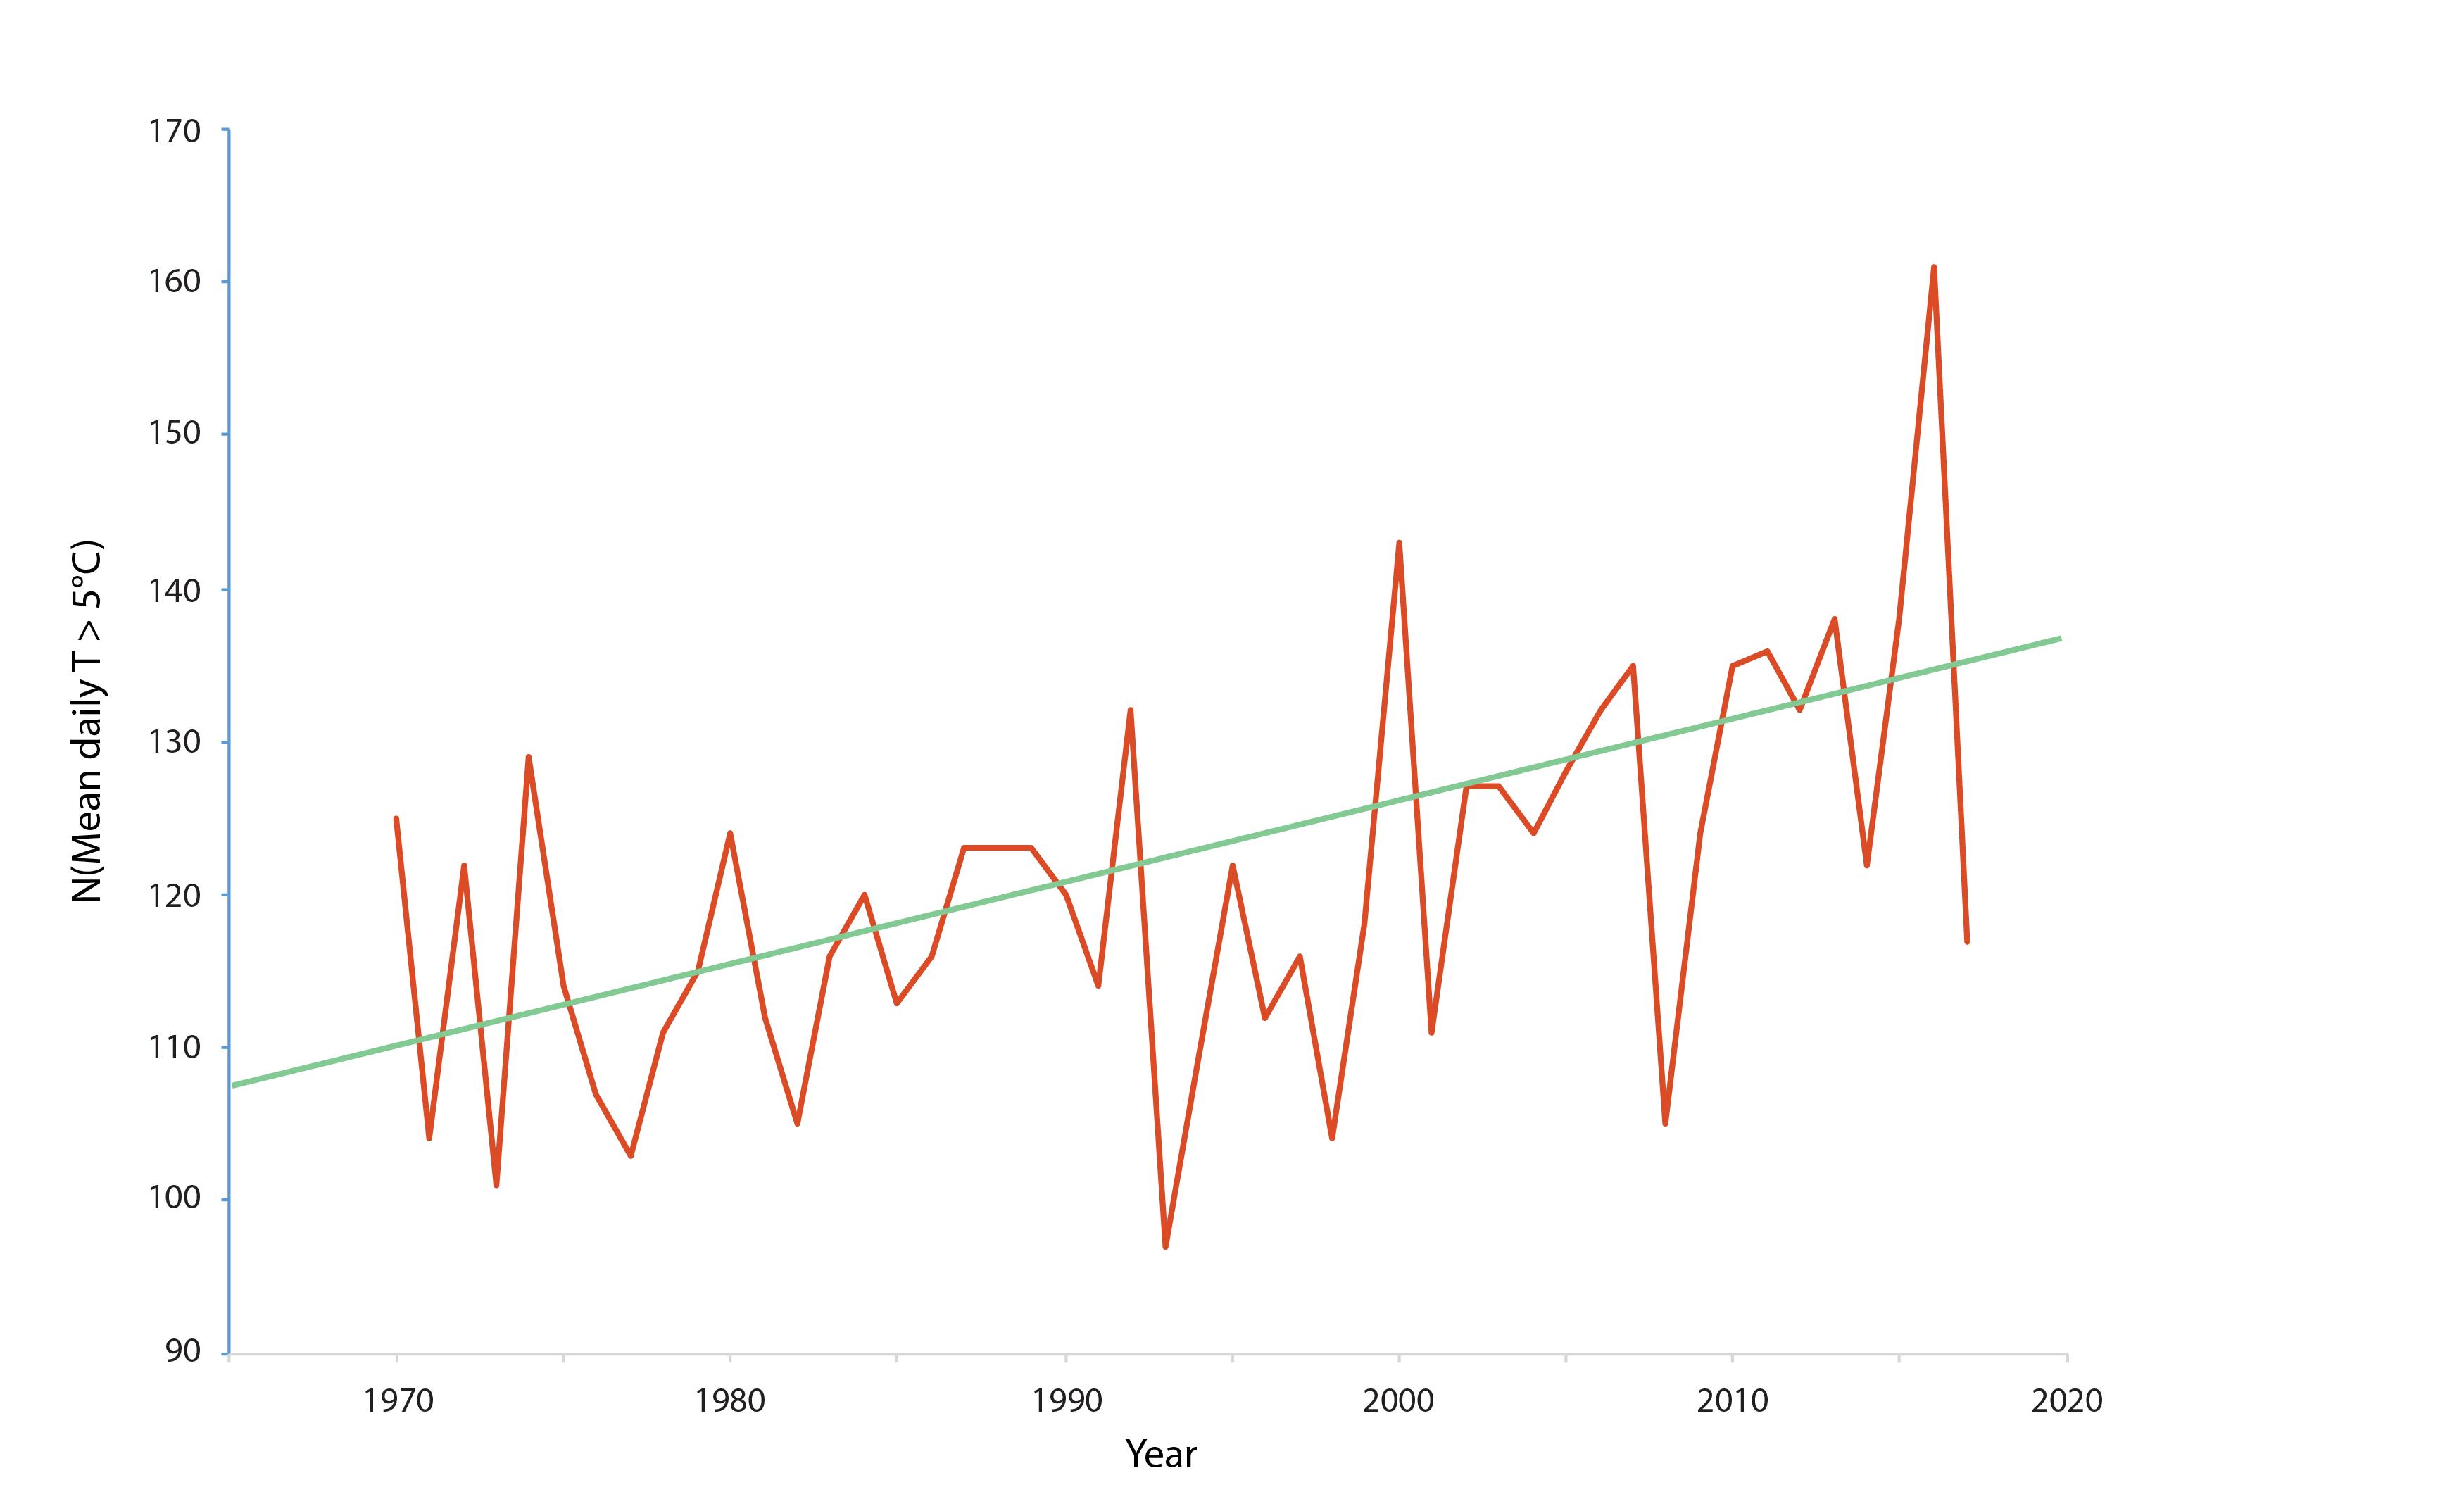
Figure 3-2 Long-term water temperature trends (1970–2017) for the Utsjoki Nuorgam station in the River Tana (69°N in Finland). The diagram shows the number of days per year with a mean temperature exceeding 5°C. The data show that from 1995 to 2017, this indicator increased by over 0.5 days per year. Data source: Finnish Meteorological Institute. State of the Arctic Freshwater Biodiversity Report - Chapter 3 - Page 15 - Figure 2-1